
Long-term Impacts of the One Big Beautiful Bill Act, as Enacted on July 4, 2025
Key Takeaways
-
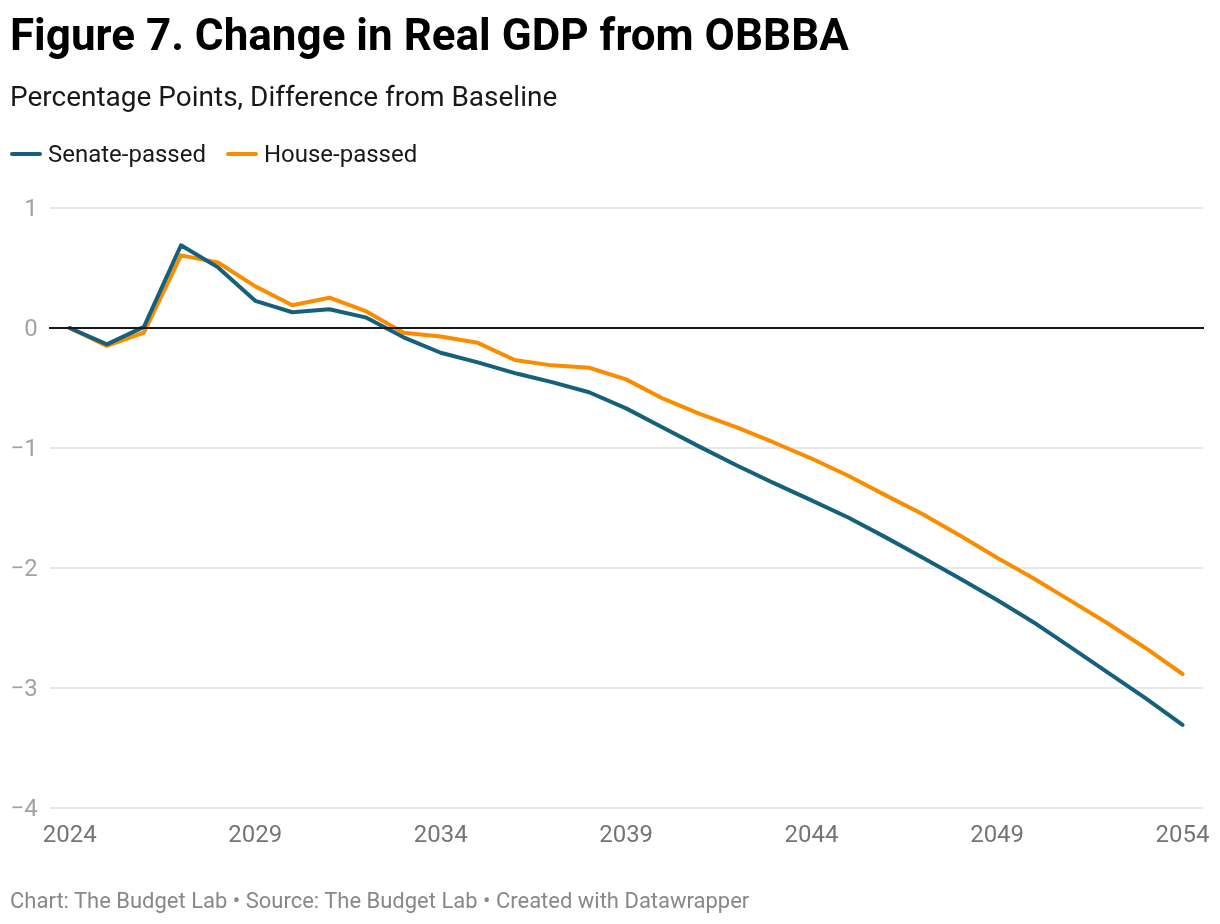
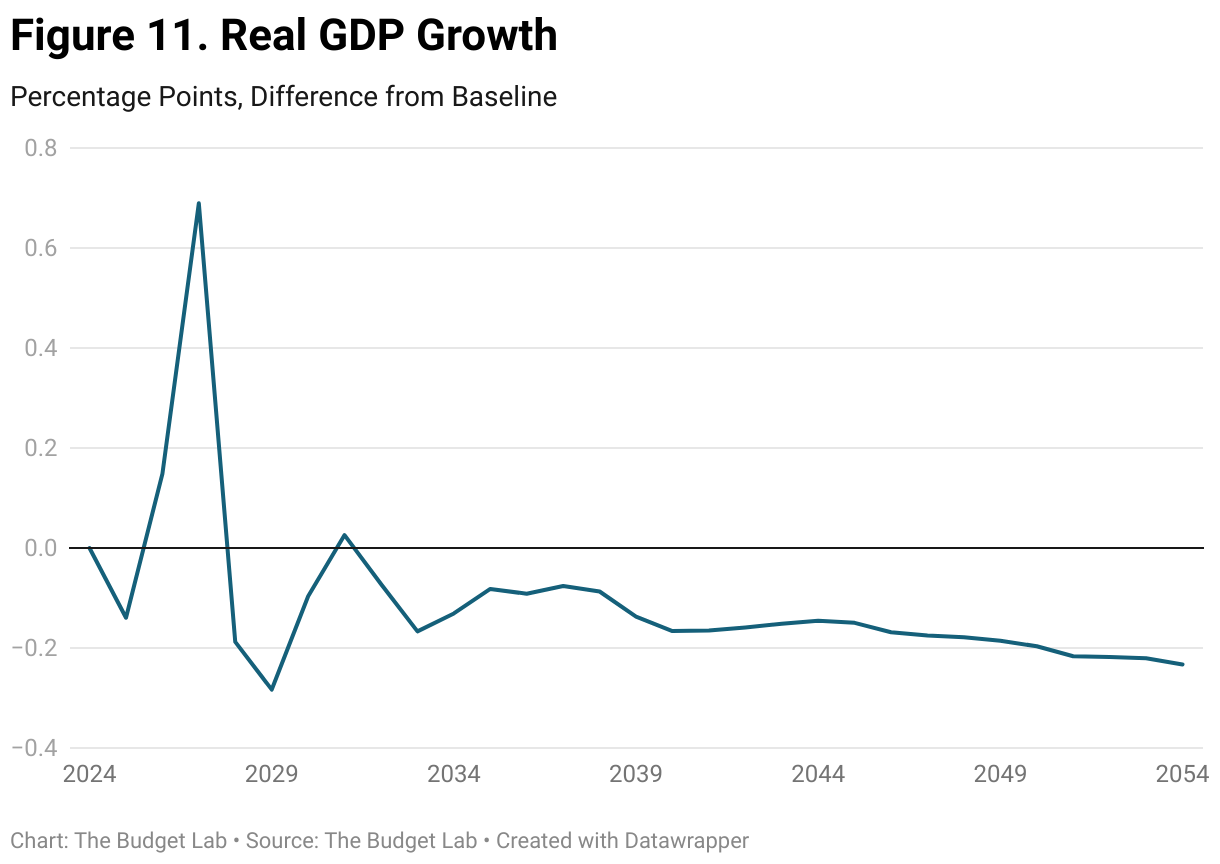
In the long run, real GDP growth slows because of the debt load from the One Big Beautiful Bill Act (OBBBA) that raises interest rates and results in crowding out. In the short run, however, there is a boost to GDP growth that averages 0.2 percentage point per year from 2025 to 2027. Thereafter GDP growth slows such that by 2054 the level of GDP is more than 3 percent smaller than it would have been if the bill were not enacted.
-
The increase in debt and deficits drives up interest rates. By 2054, the 10-year Treasury yield is 1.4 percentage points higher than it would have been if the bill were not passed.
-
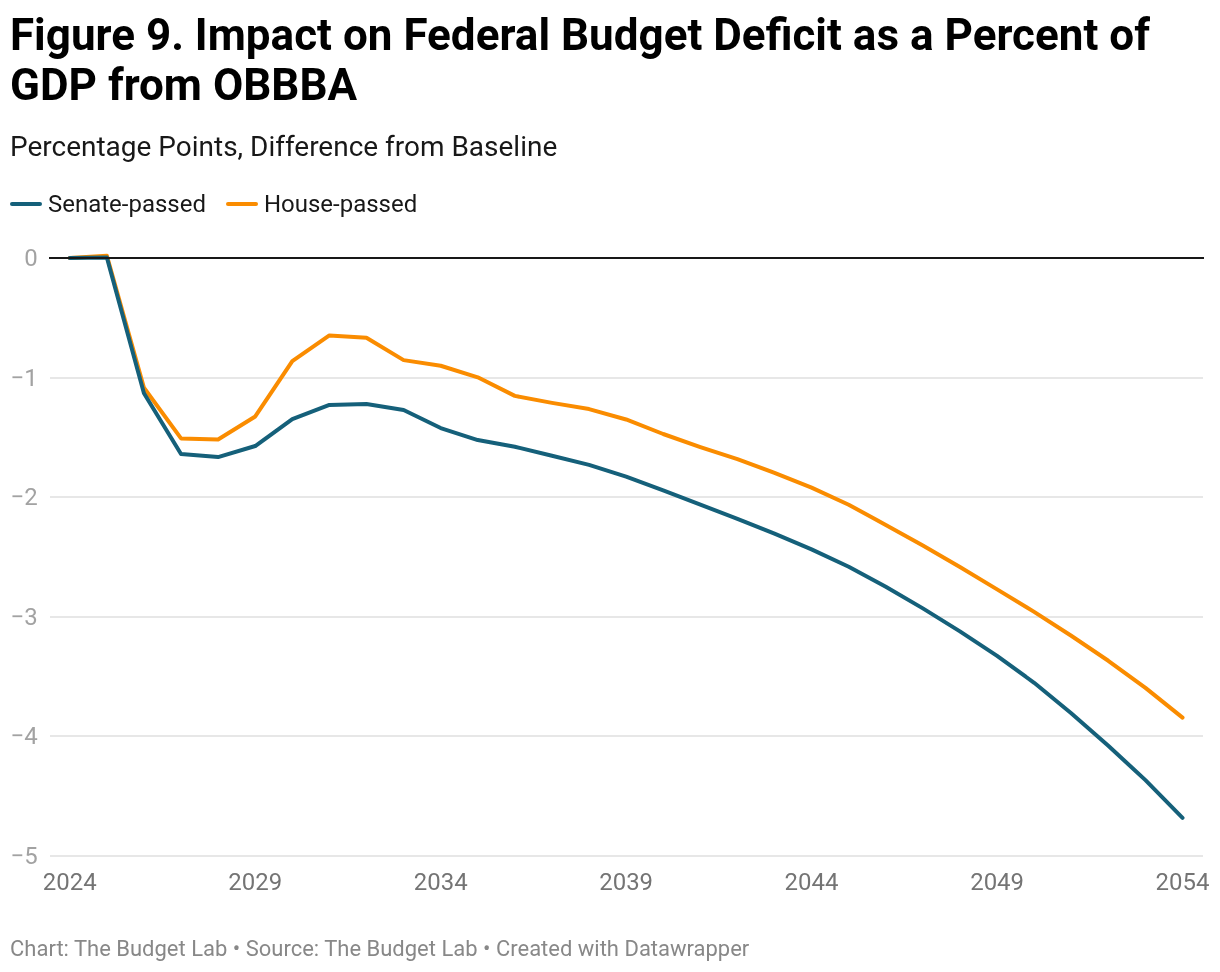
By the third decade, the deficit as a percent of GDP is 3.5 percentage points higher than in the baseline.
-
The increase in net interest outlays accounts for two-thirds of the increase in the deficit in the third decade.
-
Under passage of the bill and accounting for the macroeconomic impacts, debt-to-GDP reaches 194 percent in 2054. If the bill were not passed, debt-to-GDP would still reach 142 percent, accounting for macroeconomic feedback.
-
On average over 3 decades, direct mechanical effects associated with tax-law changes, spending reductions, and debt compounding at baseline interest rates account for one-half of the average increase in the ratio of budget deficits to GDP. The remaining portion of the average increase in deficit/GDP is accounted for by macro-dynamic impacts on the budget deficit from higher interest rates and lower GDP.
-
Increases in debt and deficits are larger with the version of the budget bill that was signed into law on July 4, 2025, than they would have been with the version of the bill passed by the House of Representatives on May 22, 2025. Larger deficits and debt result in more interest payments, higher interest rates, more crowding out of investment, and a larger decline of GDP in the long run despite more generous tax treatment of certain types of business investment in the final version of the bill.
Summary
This report updates our analysis of the long-term macroeconomic and budgetary impacts of the One Big Beautiful Bill Act (the OBBBA) to reflect the version of the bill signed into law on July 4, 2025.
On June 6, 2025, The Budget Lab published its analysis of the long-term impacts of the version of the bill that was then under consideration on the Hill and which had been passed by the House on May 22. There were several changes to the legislation between the earlier House and final Senate versions. One July 1, we published a conventional score of the budget bill as it was then under consideration. The final (Senate) version of the budget bill signed into law on July 4 reflected additional changes relative to the version that was the subject of our July 1 analysis.1 In the aggregate, tax cuts in the final (enacted) version of the bill were larger than in the version passed by the House on May 22. The composition and timing of changes to spending were altered between the House and Senate versions, but in terms of overall budgetary impacts, changes to spending policies were less impactful than changes to tax rates. In a later section, we compare the long-term budget and economic impacts of the final version of the bill with the one that passed the House on May 22.
As enacted, the OBBBA will add substantially to debt while containing relatively few investment-incentivizing provisions (as opposed to direct tax cuts for individuals). As such, there are few provisions that would drive economic growth in the long run as opposed to simply running up debt and generating upward pressure on interest rates.
This analysis is of the OBBBA as enacted. It assumes that no temporary provisions in the bill become permanent. The Budget Lab plans to follow up with analysis if the provisions become permanent. This analysis does not reflect the impacts of recent tariff announcements, which are the subject of other analyses from The Budget Lab.
We plan to refine our methodology in the future and welcome feedback on our approach for assessing the economic and budget impacts of changes to federal spending and tax policies.
Impacts on GDP of Enacting the One Big Beautiful Bill
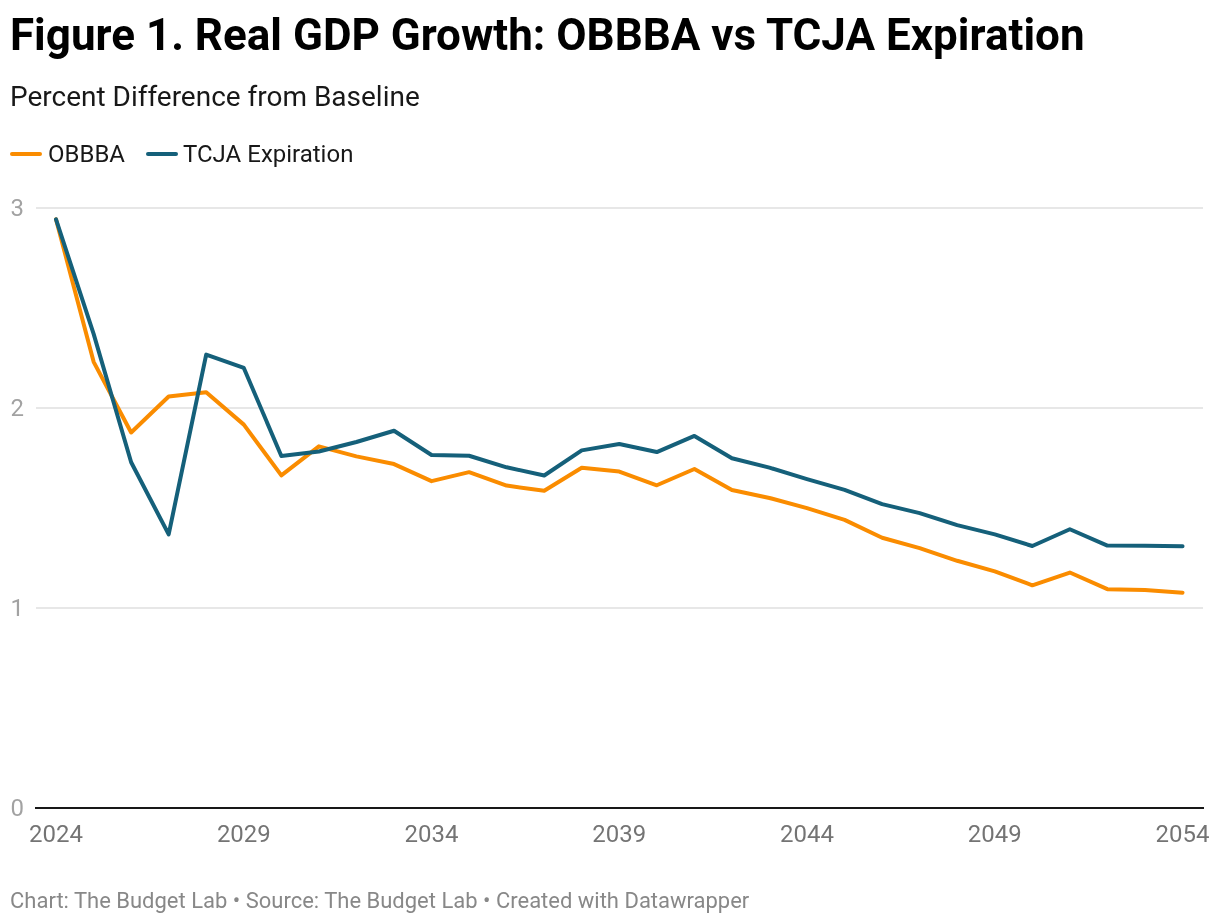
The macroeconomic impacts of the OBBBA are substantial and increase over time, with larger effects from the final version than would have occurred with the earlier version passed by the House on May 22, 2025.2 In the short run, enacting the OBBBA is more stimulative to aggregate demand than the alternative of allowing the TCJA to expire. Consequently, real GDP, income, and employment are higher, resulting in a small offset to the direct revenue loss attributed to lower tax rates. From 2025 to 2027, real GDP growth is, on average, 0.2 percentage point higher than it would have been if the bill had not been enacted.
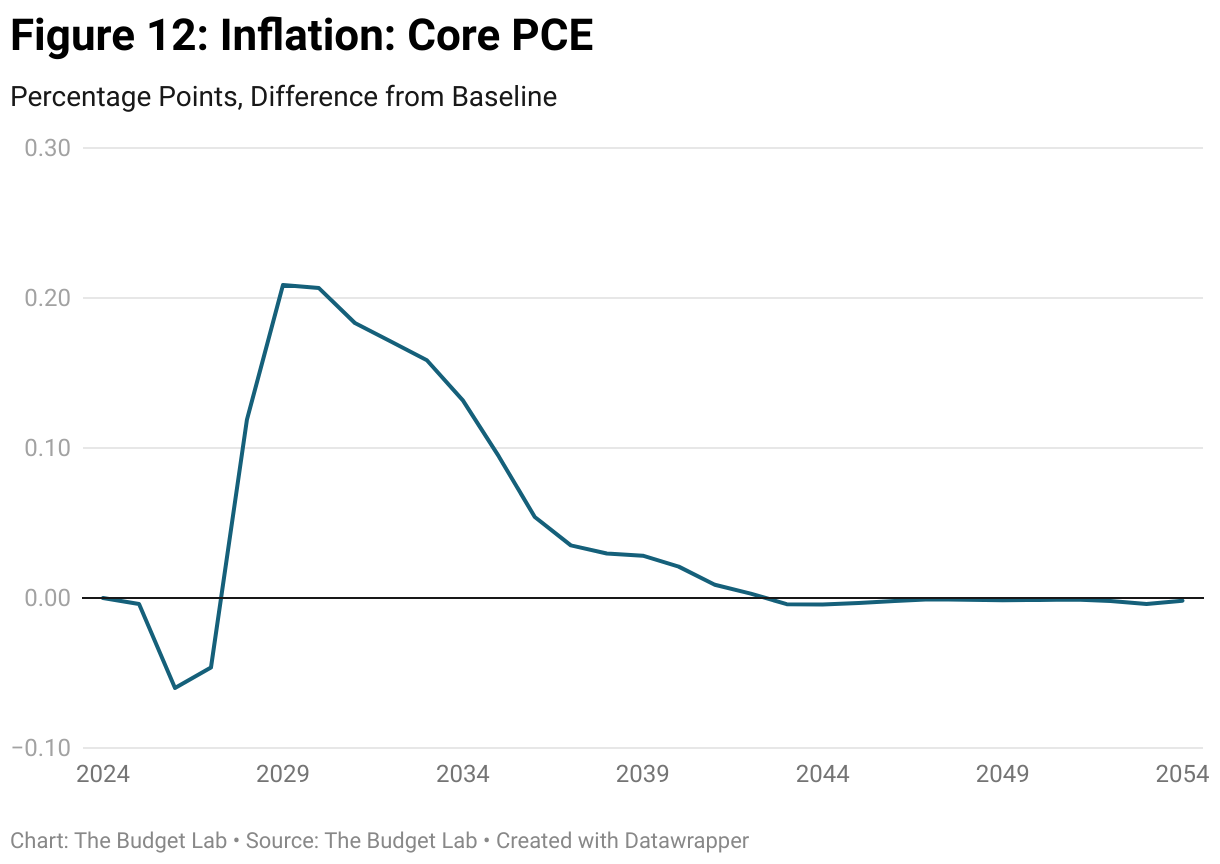
However, the boost to GDP is short-lived, in part because the Federal Reserve would be expected to raise interest rates to prevent a persistent increase of inflation above 2% (while balancing that objective with the other half of its dual mandate, to promote full employment). Investors anticipate that more Fed rate hikes will occur in the future as deficits and debt grow, adding to upward pressure on bond yields.
Higher interest rates depress interest-sensitive spending relative to the expiration baseline, both directly through higher real interest rates that increase rental prices for investment and indirectly through lower equity valuations that weaken aggregate demand. In the near term, the Fed raises the federal funds rate to counteract the inflationary consequences of fiscal stimulus. After inflation is brought back to 2%, the federal funds rate rises more slowly than the 10-year yield, which is boosted by expectations of future increases in short-term interest rates. In 2054, the federal funds rate is 0.4 percentage point above baseline versus 1.4 percentage points for the 10-year yield.
Over time, business fixed investment falls below the path that would have prevailed were the TCJA allowed to expire at the end of 2025. The bill does provide investment incentives through reductions in effective tax rates on profits and capital income (capital gains, dividends, and interest). More generous provisions related to expensing of research and development and other categories also influence business expenditures on investment. However, the positive impacts on investment spending from these factors are more than fully offset by increases in the cost of equity and debt financing that result in higher rental prices for fixed investment. A lower trajectory for business fixed investment results in less capital-deepening, a smaller contribution to productivity growth, and a lower trajectory for potential output.3 The long-run negative growth impacts largely stem from crowding out of investment spending. Budget Lab considers our macro work, as with all our work, to be an iterative process and plans to update and refine our methodology as we go.
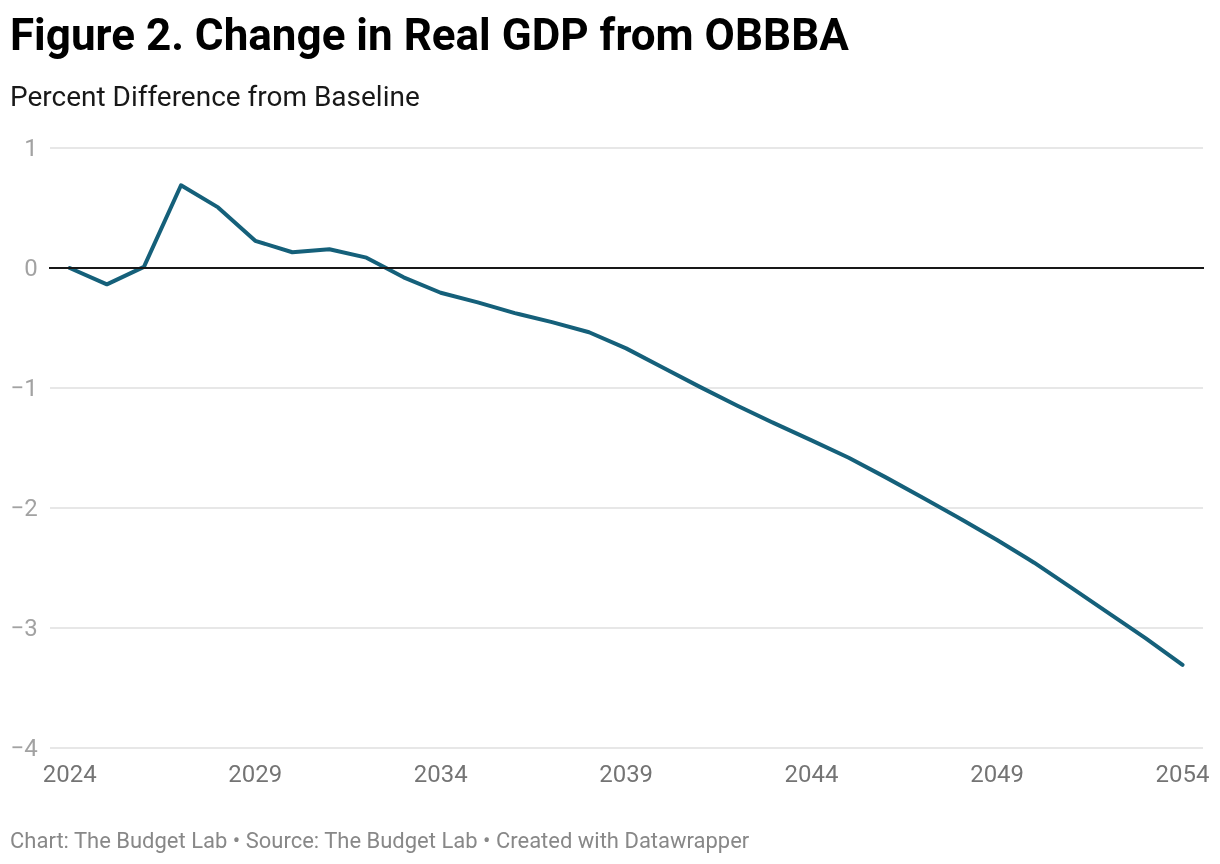
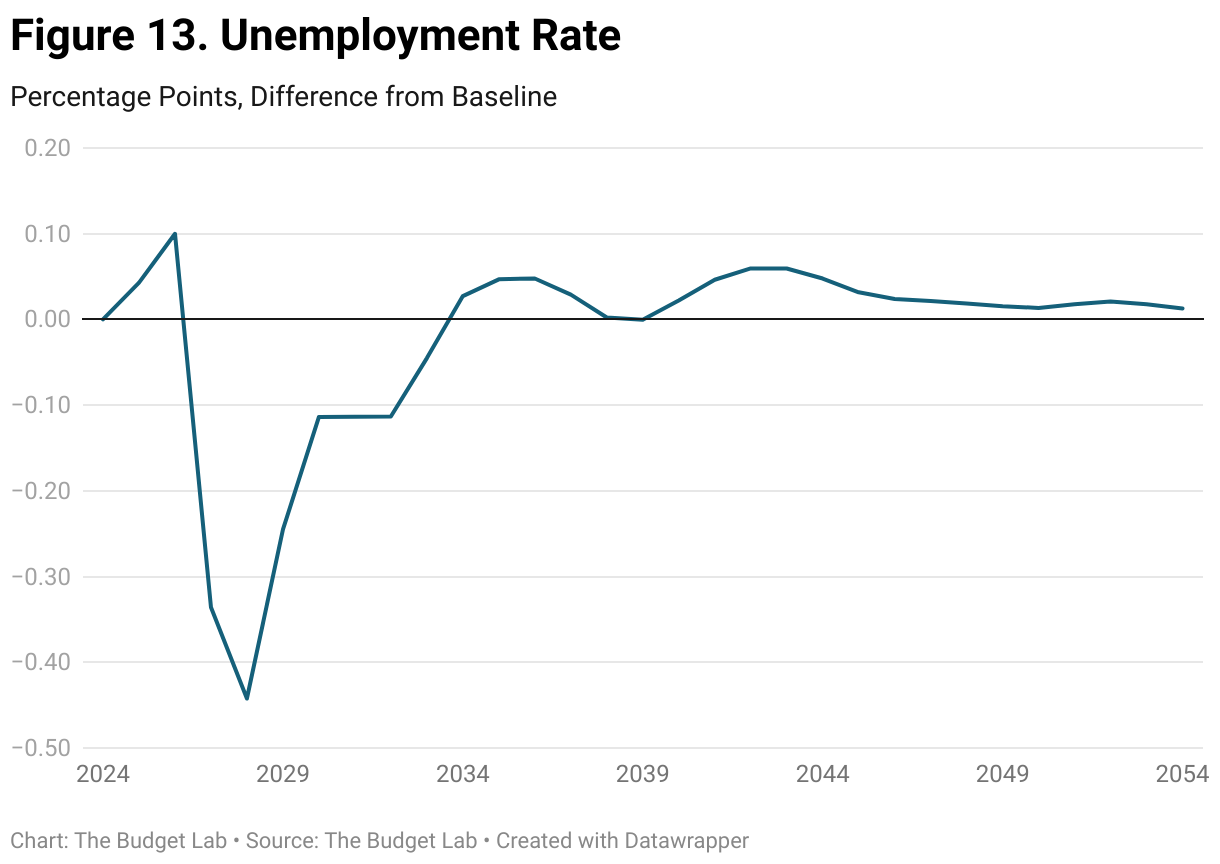
Monetary policy is assumed to be effective in keeping inflation close to 2% and the economy near “full employment” (the unemployment rate equal to NAIRU) beyond the short run, so a lower path for potential output corresponds to a lower trajectory for real GDP. In 2054, real GDP is 3.3% lower with the OBBBA than in the baseline scenario.4 The decline in GDP relative to baseline exacerbates the fiscal deterioration as it translates into lower paths for taxable incomes. Consumer spending is influenced by several developments, including lower trajectories for real labor and transfer income, and for real net worth. Higher interest rates are a drag on spending for durable goods. Asset income is boosted by higher interest payments on government debt. (Please see additional graphs on the economic impacts in the Appendix.)
For monetary policy to be effective in keeping inflation at 2% (and the unemployment rate equal to the NAIRU), real interest rates are pushed higher in the face of a permanent net fiscal expansion. The upward pressure on interest rates is manifested in growing interest payments to holders of federal government debt, which boosts personal disposable income and consumer spending even with a substantial increase in the personal saving rate. These forces intensify as interest rates rise, and debt continues to grow relative to nominal GDP.
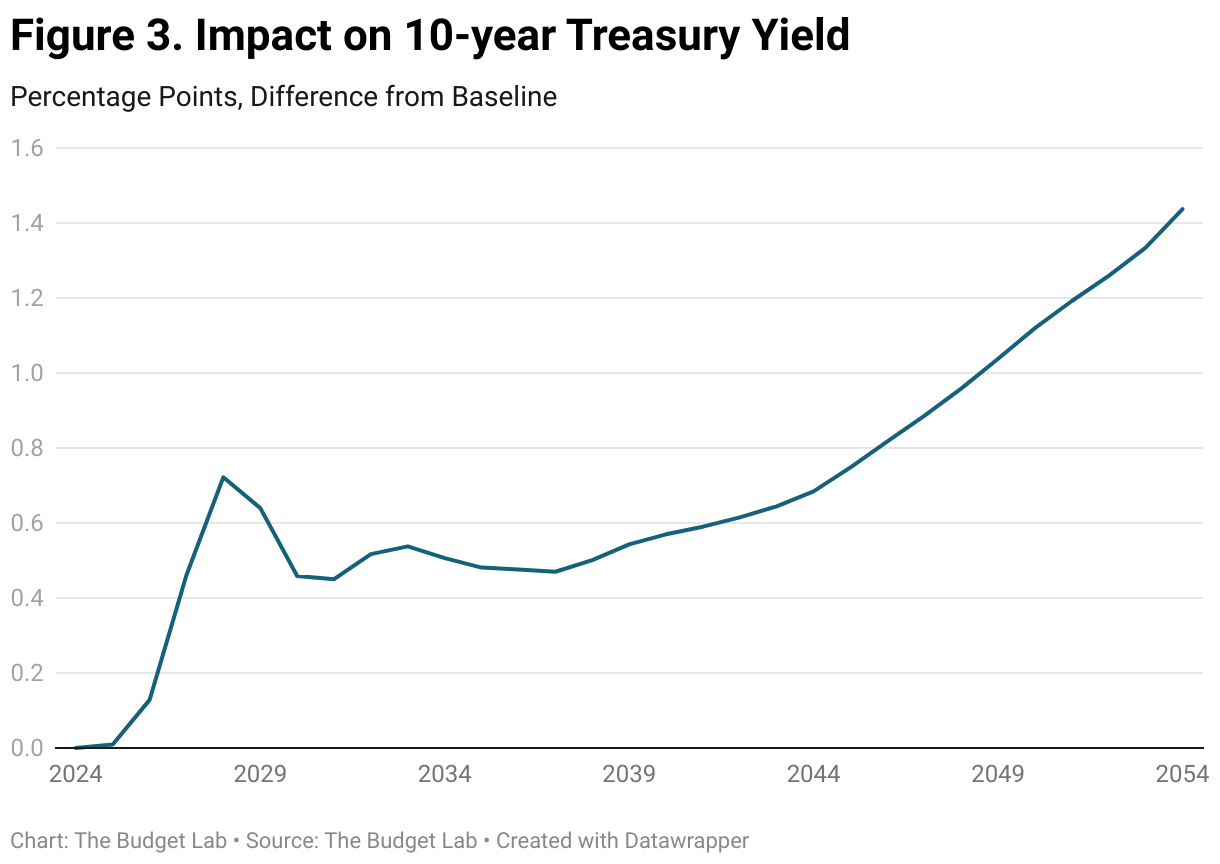
Approximately two-thirds of the increase in the 10-year yield in the simulation, relative to baseline, is due to investors’ expectation that short-term interest rates will be pushed still higher in the future, including beyond the end of the 30-year horizon of this analysis, in order to keep inflation at 2% and the economy at full employment. Approximately one-third of the increase in the 10-year yield is accounted for by an increase in the term premium — the difference between 10-year yield and the expected federal funds rate over the 10-year life of that instrument.5 Enacting the OBBBA results in larger increases in interest rates than if all its provisions were temporary because investors expect more future debt accumulation.
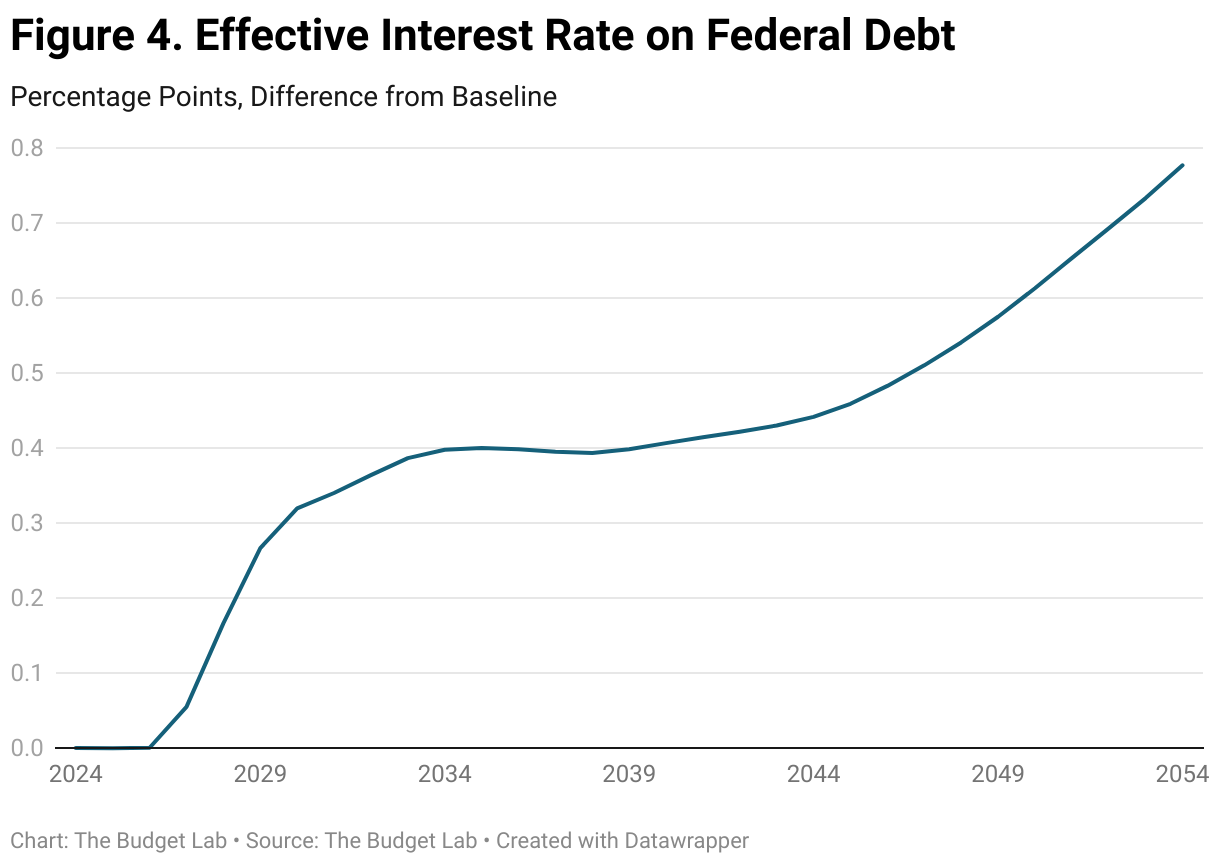
Higher short- and long-term interest rates are reflected in increases in the average effective interest rate on government debt. Typically, approximately 30% to 40% of federal debt matures each year, so the average effective interest rate on government debt rises more slowly than market interest rates, such as the 10-year Treasury yield. In our simulation, the effective interest rate on debt in 2054 is 0.8 percentage point higher than if the OBBBA had not been enacted.
The increases in interest rates, net interest outlays, and debt stemming from enacting the OBBBA could be larger than shown here. For this exercise, we assumed that foreigners acquire federal debt in similar proportions to recent history. In contrast, if foreigners were to pare their participation in acquiring new and refinanced debt, there could be more upward pressure on interest rates. Negative crowding-out effects on investment and potential output would be larger, resulting in further deterioration in potential output and GDP. In addition, in our modeling the personal saving rate increases several percentage points relative to baseline, tempering the increase in private aggregate demand that would put upward pressure on GDP and inflation unless counteracted by even higher interest rates. If the personal saving rate rose by less than in our simulation, there could be more upward pressure on interest rates, budget deficits, and debt/GDP.
Direct and Indirect Effects on Deficits and Debt
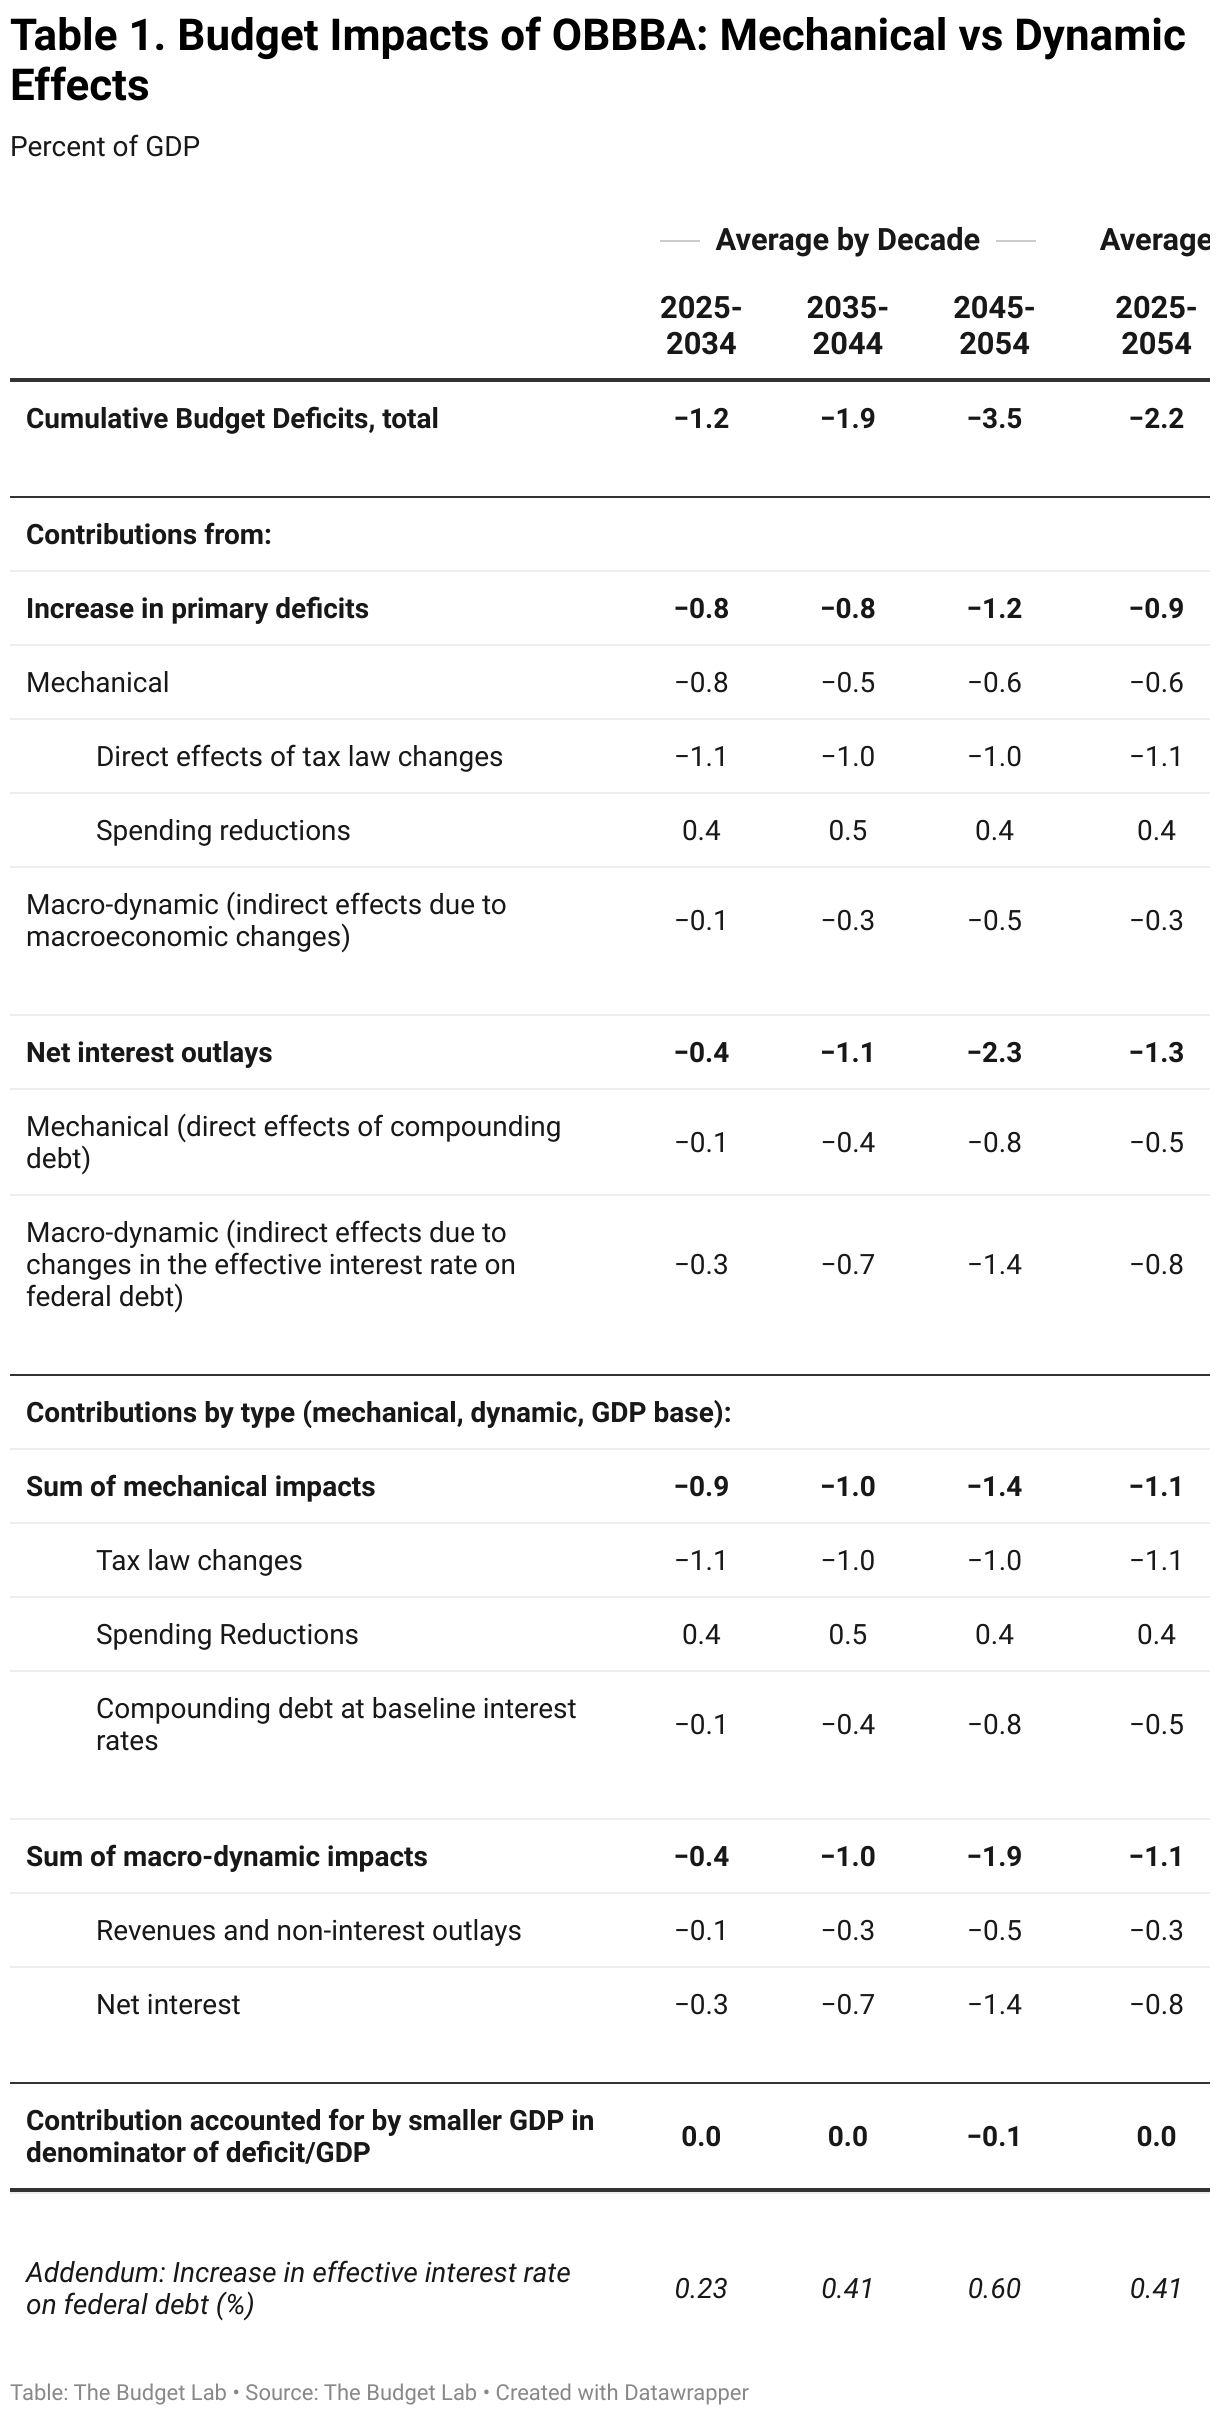
Over the first decade (through 2034), deficits average 1.2% of GDP, with two-thirds of that increase accounted for by larger primary deficits and the remaining one-third attributable to higher net interest outlays. Impacts on primary deficits and net interest outlays can be split into direct-mechanical impacts and macro-dynamic impacts.
In the first decade, changes to primary deficits that result directly from reductions in federal outlays and changes in tax law (“mechanical effects”) account for nearly all of the increase in primary deficits. The mechanical effect of higher debt due to tax-law changes and spending reductions that, on net, raise primary deficits accounts for one-third of the increase in net interest outlays in the first decade. Macro-dynamic factors, which in the first decade consist primarily of the impact on net interest of an increase in the average effective interest on government debt, account for the remaining portions of the increases in primary deficits and net interest.6 Higher interest rates can impact the primary deficit by slowing down the economy and impacting taxable income.
The importance of macroeconomic feedback on the budgetary impacts of enacting the OBBBA increases substantially over time. In the third decade, macro-dynamic effects account for more than one-half of the increase in total deficit/GDP, with most of the remainder accounted for by mechanical effects. The increasing relative importance of macro-dynamic impacts is particularly stark in the case of net interest outlays. A higher effective interest rate accounts for three-fifths of the increase in net interest outlays in the third decade.
Averaged over the full 30 years, macro-dynamic effects and mechanical effects each account for one-half of the overall increase in the ratio of deficits to GDP.
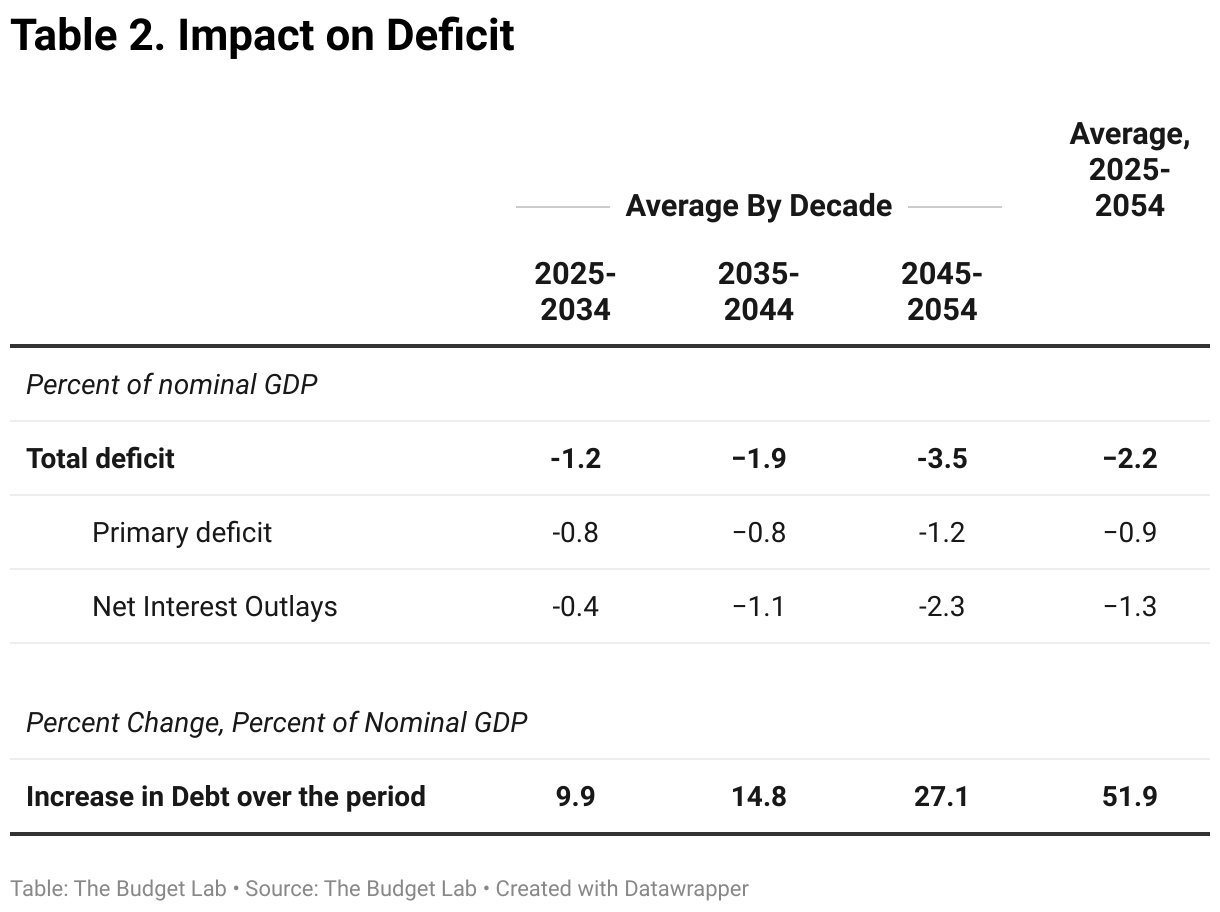
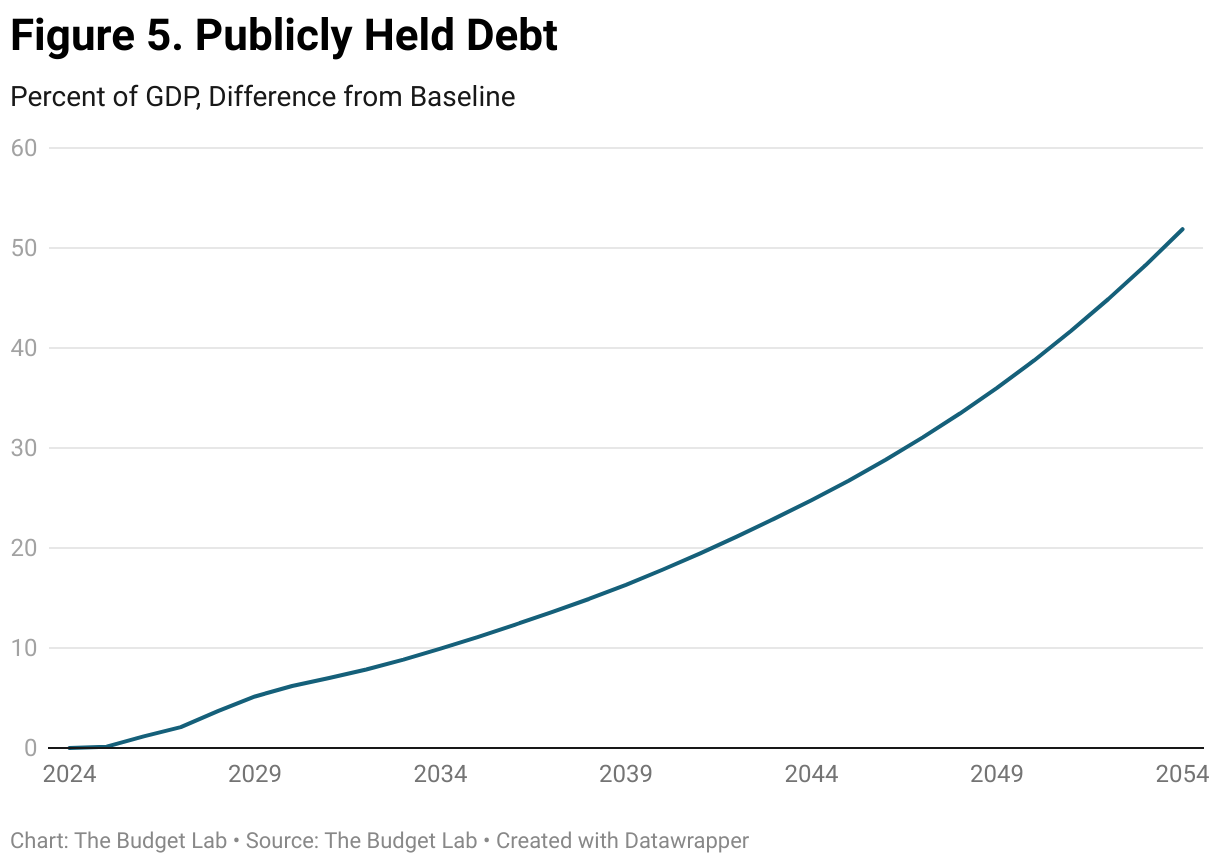
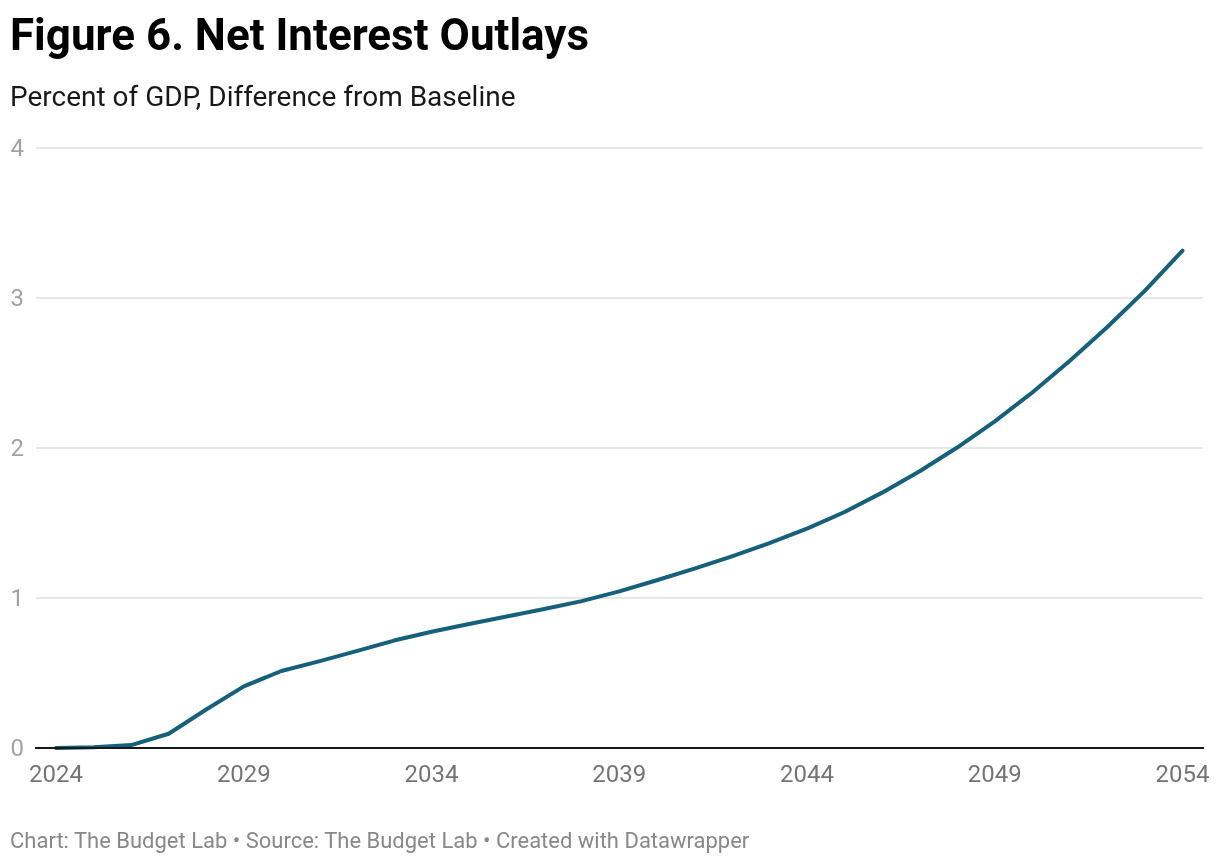
A second table summarizes debt, deficits, and net interest as percentages of nominal GDP, by decade and reflecting all effects, i.e., direct-mechanical and macro-dynamic, and taking into account that the path of GDP is different than in the baseline. Over the first decade, the ratio of debt to GDP rises 10 percentage points relative to baseline. The increases in subsequent decades are significantly larger, mostly due to larger increases in net interest outlays relative to baseline. In the third decade, net interest outlays as a percent of GDP are 2.3 percentage points higher than in the baseline scenario. In the final year (2054), net interest outlays are 3.3 percentage points higher than in the baseline scenario. In 2054, federal debt rises to 194% of GDP, 52 percentage points higher than in the baseline scenario. A decline in GDP relative to baseline contributes to the increase in the ratio of debt to GDP.
Impacts on debt and net interest are shown in nearby charts.
Comparison to Other Research
If our modeling exercise were to continue beyond 2054, the ratio of debt to GDP in the following decade would average approximately 79 percentage points higher than if TCJA were allowed to expire at the end of 2025. The ratio of the increase in the 10-year yield as of 2054 (1.4 percentage points) to the expected increase in debt/GDP over the ensuing decade is 1.8 bps / percentage point. This calculation is appropriate to the extent that investors anticipate future increases in debt that will contribute to higher future interest rates. If the calculation were performed in a purely static fashion — reflecting the increase in debt/GDP as of 2054 but no further increase — the ratio of the change in the 10-year yield to the change in the ratio of debt/GDP, in percent, would be 2.8. Outside research indicates that each percentage point of increase in the ratio of debt to GDP (%) is associated with approximately 2 basis points of increase in the 10-year yield, although estimates do vary.7
At first glance, our results on the relationship between changes in debt/GDP and interest rates differ from those in the Congressional Budget Office’s “extended baseline” projections, which show essentially no increase in interest rates in the long run even as debt rises relative to GDP. However, there are many factors that can affect interest rates in the long run baseline. For example, CBO projects long run reductions in labor force growth that reduce potential GDP growth and thereby reduce real interest rates in equilibrium. The CBO extended baseline interest rates reflect the net effect of rising debt and slowing labor force growth, along with other factors. We project OBBBA to substantially increase debt while leaving labor force growth and other factors largely unchanged, with correspondingly large net increases in interest rates.
More recently, on June 17, the CBO published a short report on the dynamic effects of the version of the OBBBA that was passed by the House on May 22. (As noted in the text of this report, the final version contained a number of important changes relative to the House version.) CBO estimates that the House version of the OBBBA would raise the 10-year Treasury yield by an average of 14 basis points during the first decade (2025–2034) alongside an increase in federal debt that reaches 7.1 percentage points of GDP in 2034. Comparable results from our estimates of the House version include an average increase in the 10-year yield in the first decade of 31 basis points, which reflects a period of Fed tightening to offset inflationary impulses; and a cumulative increase in the ratio of debt to GDP of 7.0 percentage points as of 2034.
Issues of Long-Term Sustainability
There is an important question about the extent to which the scale of the increase in debt produced in this simulation is sustainable. As substantial as the effects are in this exercise, the economic and fiscal outcomes could be much worse in the event of a debt crisis sparked by investor pullback from the market for US government debt. Such a crisis would complicate the task of financing large deficits alongside the refinancing of growing amounts of maturing debt. In the event of a debt crisis, financial conditions would deteriorate sharply, possibly sparking a severe recession or worse. Fed rate cuts might be inadequate to the task of fighting recession and restoring full employment.8 One might anticipate that, in an attempt to avoid a more severe economic weakening, monetary policymakers would undertake substantial purchases of government debt at larger scale than seen in the aftermath of the 2008-2009 financial crisis or the Covid-19 pandemic.
Impacts of Changes to the Final Version of the OBBBA
Several changes were made to the OBBBA after initial passage in the House of Representatives on May 22, 2025, which formed the basis of our earlier analysis of the bill’s longer-run macroeconomic and budget impacts. Of these, the most consequential in terms of longer-run budgetary and macroeconomic impacts are larger reductions in average effective tax rates for personal income and corporate profits. On average over both the first decade (2025–2034) and for three decades (2025–2054), we estimate that the average effective personal tax rate (income-weighted, NIPA concept) was lowered by 0.1 percentage point more in the final version than in the version passed by the House. We estimate that the average effective corporate tax rate was reduced by 0.4 percentage more, on average, than in the House version in the first decade and 0.2 percentage point more, on average, over 3 decades.
In addition, certain provisions related to cost recovery that were temporary in the House bill were made permanent in the final version, resulting in modestly higher depreciation allowances for new investment spending when stated on a present-value basis. Permanent expensing provisions in the Senate version provided a modest additional boost to investment spending relative to the House version. However, these effects were more than offset by greater amounts of crowding out through higher interest rates and higher costs of capital for the final legislation.
Our estimates of the impacts on effective marginal tax rates for wage and salary income and various categories of capital income (interest, dividend, and capital gains) are similar for the House and Senate versions for most years and rates. One difference was in adjustments to income tax brackets. Income tax brackets were raised only for the two lowest income brackets in the Senate version as opposed to for all but the top bracket in the House version, for the first four years (through 2028). Given progressivity in the tax code, this resulted in a smaller reduction in the income-weighted effective marginal tax rate for wage and salary income with the Senate version. Because the difference was temporary (and not particularly large), it had no meaningful effect on the long-run macroeconomic impacts of the legislation.
There were aggregate spending reductions in both the House and Senate versions. Although there were differences between the two versions in the composition of spending, the reductions in total federal expenditures were similar, as were their longer-run macroeconomic impacts. Over the first decade, legislative changes reduced federal expenditures by $1.2 trillion in the final version, about $0.3 trillion less of a reduction than in the House version; estimates of aggregate spending reductions in the final two decades are similar for the two versions. In both versions, spending reductions were lodged primarily within transfers, and within that category, primarily for grants-in-aid to state governments related to health care.
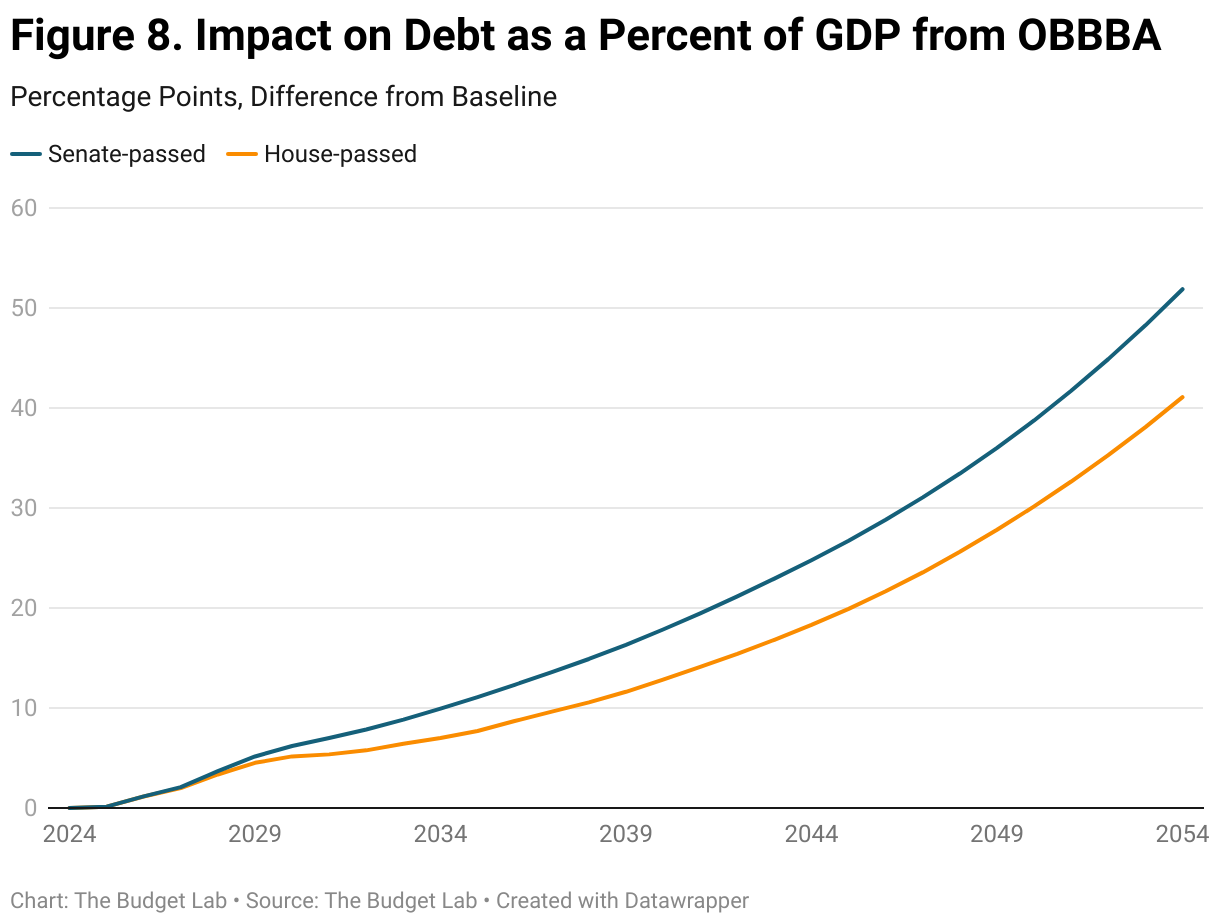
Prior to accounting for macroeconomic feedback, the Senate version of the OBBBA implies larger deficits than the earlier House version and larger increases in federal debt in both the first and subsequent decades. After accounting for macroeconomic feedback, the increase in the ratio of debt to GDP (in percent) as of 2054 is 11 percentage points larger for the Senate version (194% versus 183%). As of 2054, the total budget deficit increases to 4.7% of GDP versus 3.8% for the House version. The difference in total deficits to GDP is largely due to larger increases in net interest with the Senate version, reflecting both larger primary deficits and a larger increase in the average interest rate on federal debt. In 2054, the average effective rate is 0.8 percentage point higher versus 0.6 percentage point for the House version.
In terms of aggregate demand and GDP, the short-run stimulative effects of the two versions are, in our modeling, broadly similar. Both versions boost GDP in the short run in response to tax reductions that raise after-tax incomes and that are partially offset by the effects of spending reductions. The boost to aggregate demand raises employment and generates inflationary pressures, which the Fed would counter by raising interest rates in pursuit of its goal of keeping inflation and inflation expectations at 2% over time. Prior to a monetary policy response, the short-run demand boost is slightly larger with the Senate version, resulting in a modestly larger Fed response. In both versions, the boost to GDP is short-lived, with GDP growth raised on average over the first three years by 0.2 percentage point (after accounting for the effects of higher interest rates). For the Senate version, the peak effect on the level of GDP is 0.7% in 2027 versus 0.6% with the House version. Averaged over the first decade, GDP growth is functionally zero with either version.
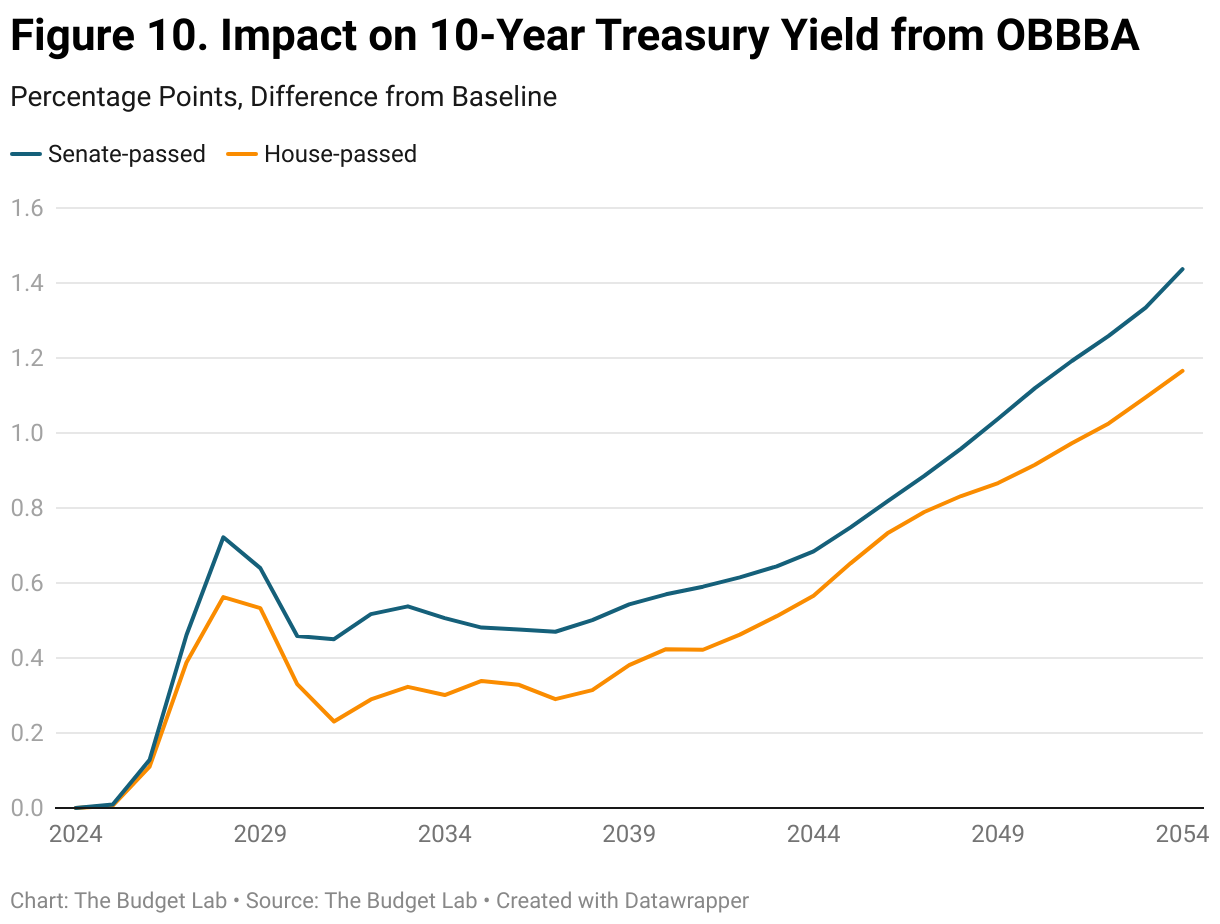
The 10-year Treasury yield is pushed up more due to larger deficits in the Senate version. In 2054 the 10-year yield impact is 1.4 percentage points with the Senate version (versus 1.2 percentage points). Larger deficits and higher debt result in more crowding out. Even more so than with the House version, the effects of crowding out more than offset the potentially investment-incentivizing effects of changes in taxation that alter business taxation and cost recovery. In 2054, real business fixed investment is 14% lower versus a reduction of 13% generated by the House version. The stock of computer equipment is 8% lower and non-computer equipment 10% lower with the final version, slightly larger increases than estimated with the House version. Declines in capital stocks (relative to baseline) negatively impact labor productivity growth.
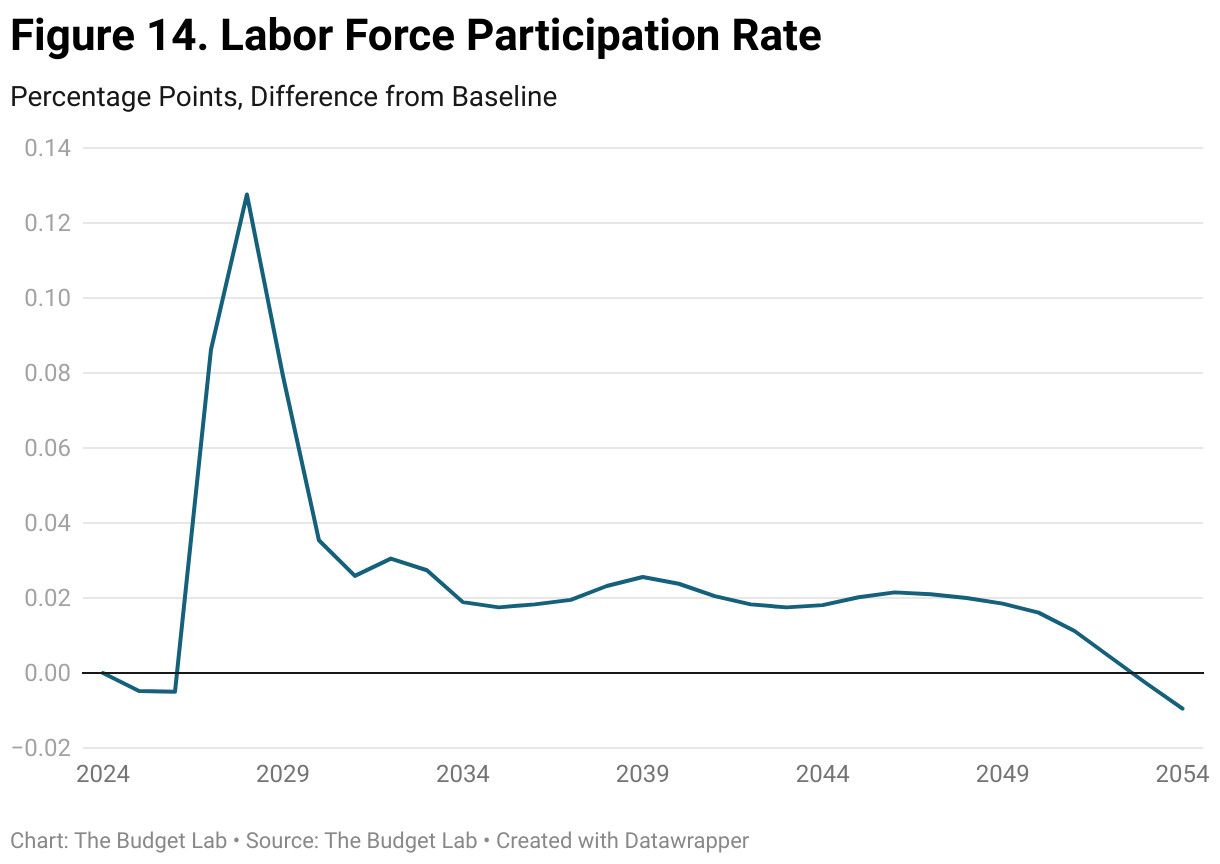
In our modeling, there is relatively little impact of the OBBBA on the rate of labor force participation. Accordingly, lower investment that results in less growth in labor productivity also lowers potential GDP that over time is reflected in lower real GDP. In the long run, as of 2054, real GDP is 3.3% below baseline, a larger reduction than with the House version (2.9%).
From a methodological perspective we used the same procedures to simulate the effects of the two versions of the OBBBA. Simulations were prepared with USMM utilizing the same assumptions for population and demographics, growth of total factor productivity, and real energy prices. All fiscal assumptions other than those implied by the OBBBA were identical. The two simulations were constructed relative to the same current-law baseline. Monetary policy was conducted in the same fashion assuming both credible and efficacious policy. Expectations for monetary policy were modeled in the same manner. To reflect the larger long-term fiscal effects of the Senate version, our assumptions resulted in modestly higher paths for the equity risk premium and the 10-year for term premium. Federal domestic interest payments are higher due to more debt and higher interest rates; as with the House version, we projected a significant increase in the personal saving rate as debt increases relative to projected incomes. A smaller response of domestic saving would have resulted in even higher interest rates, larger federal outlays for interest, more debt, and more crowding out that would reduce real GDP in the long run.
Alternative Interest Rate Scenarios
As an alternative to our estimate of the effects of the bill, we developed a scenario with alternative assumptions that resulted in smaller increases in interest rates, less crowding out, and a lower debt trajectory than in the estimate described in this report. Specifically, we aimed to keep the long-run response of the 10-year Treasury yield to the increase in debt-to-GDP ratio (in %) to about 2 basis points per percentage point when computed on a “static” basis, as described above. On a forward-looking basis, the long-run effect in the alternative scenario is 1.4 basis points of 10-year yield per percentage point of debt/GDP in the forecast. Among the changes for the alternative scenario were:
- less of a rise in the term premium related to a lower trajectory for the average effective maturity of federal debt,
- a more muted response of the average effective interest rate on government debt to market interest rates (i.e., Treasury yields),
- and less of a response of consumer spending to increases in interest payments on domestic holdings of government debt.
The first two factors contributed directly to a smaller increase in the average effective interest rate on federal debt relative to our previous scenario, implying a lower trajectory for net interest payments by the federal government. Combined with the third factor, this resulted in both a lower trajectory for interest income of households and less of a spending response by consumers to that income stream. In equilibrium, this resulted in lower interest rates generally as the Federal Reserve adjusted the federal funds rate to keep inflation and inflation expectations at 2% with the unemployment rate close to the NAIRU. A lower trajectory for the federal funds rate was reflected in lower paths for expected future short-term interest rates that influence bond yields in the alternative scenario.
The effects of these changes are noteworthy, including an increase in the 10-year Treasury yield as of 2054 that is a little more than one-half as large as in the Budget Lab’s estimate. Increases in the average effective interest rate on government debt, net interest outlays, the overall deficit, and debt are also smaller in the alternative, while the long-run reduction to GDP is not as large due to less (but still substantial) crowding out.
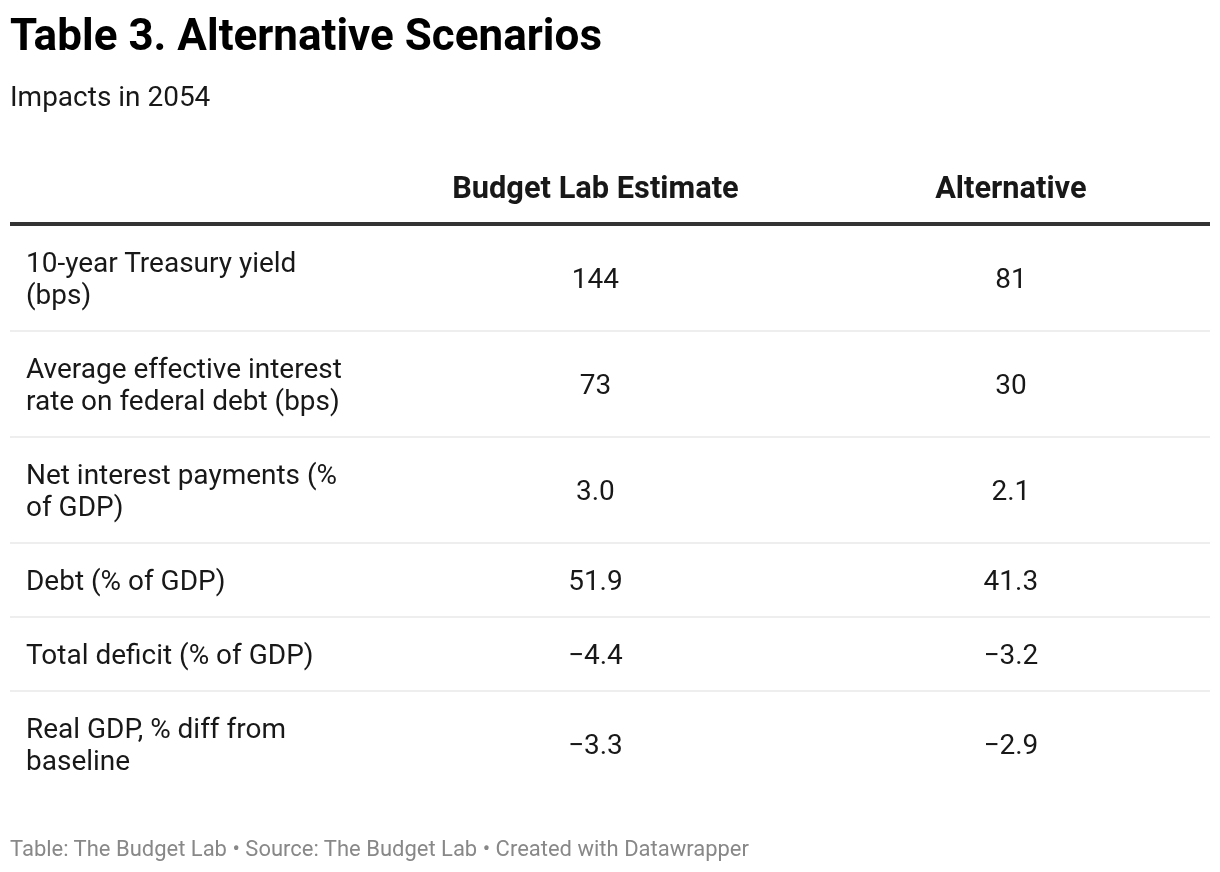
The intent of the alternative scenario is to highlight how results might respond to different modeling assumptions; in particular, that the impacts on interest rates and debt service are dependent on such assumptions. This exercise is not intended to suggest that all or most of the risk relative to our published estimate is tilted toward a smaller impact on interest rates and less crowding out than in the previous scenario.
Additional Graphs
Footnotes
- Among the late changes were a temporary increase in the SALT “cap” from $10,000 to $40,000 (with indexing); changes to the phase-out of energy credits; indexing of the child tax credit; changes to international taxation; and adjustments to rates and coverage of endowment taxation.
- Our analysis of the OBBBA is relative to a long-term, current-law baseline we constructed that is similar to CBO’s extended baseline. Please see the appendix of the Budget Lab’s June 6 report for a description of the baseline used for this analysis.
- In our modeling, there is no material long-run impact of the One Big Beautiful Bill on the labor force, so lower productivity growth through capital-shallowing translates into lower growth of potential GDP. Monetary policy is assumed to be effective in keeping the unemployment rate at the NAIRU beyond the short run, so the path of real GDP mirrors the path of potential in the long run.
- Nominal GDP is 2.1% lower than baseline in 2054, a smaller decline than for real GDP. The smaller reduction of nominal GDP in the long run reflects a small but permanent increase in the price level stemming from a temporary increase in inflation in the first few years after enactment.
- As of 2054, when the 10-year yield is 1.4 percentage points above baseline, the average expected federal funds rate over the subsequent 10 years is 0.9 percentage point higher than baseline. The term premium — the difference between the 10-year yield and the average expected short rate — is 0.5 percentage point larger than in the baseline.
- A final contribution to differences in ratios of deficits/GDP between the OBBBA and baseline scenarios is due to the mathematical effect on ratios of a lower trajectory for nominal GDP in the former than in the latter. The mathematical contribution from this source is small, rounding to an average of 0.0 percentage point of debt/GDP over the full 3 decades and -0.1 percentage point of deficit/GDP in the final decade.
- See Neveu, A., and J. Schafer, “Revisiting the Relationship Between Debt and Long-Term Interest Rates,” CBO Working Paper 2024-05, December 2024; Laubach, T. “New Evidence on the Interest Rate Effects of Budget Deficits and Debt,” Journal of the European Economic Association, vol. 7, no. 4 (June 2009), pp. 858–885, and Plante, M., A. Richter, and S. Zubairy, “Revisiting the Interest Rate Effects of Federal Debt,” NBER working paper 34018, July 2025.
- The Fed’s task would be further complicated if the dollar were to weaken, pushing up import prices and inflation. The goal of keeping inflation and inflation expectations anchored at 2% could inhibit the Fed from focusing more fully on offsetting recessionary forces sparked by a debt crisis.