Is the U.S. Labor Market Cooler Than It Looks?
Over the three months ending in April, the US economy added an average of 242,000 jobs a month, according to Current Employment Statistics (CES) data published by the Bureau of Labor Statistics (commonly known as the payroll or establishment survey). How strong of a number is this? Put differently: at what point would slowing job growth start to be a concern?
One way to answer this question is to compare the 242,000 jobs against historical periods of strong labor market performance. Recent job growth looks quite robust through this lens. Over calendar year 2000 for example (December 1999 to December 2000), payroll employment grew by an average of 161,000 jobs a month (see Table 1). Adjusting this number to account for the fact that the population was smaller in 2000 than it is now, that 2000 pace would be equivalent to 192,000 jobs a month in today’s labor market.1 The years 2006 and 2019 saw average population-adjusted jobs growth of 200,000 and 172,000 a month, respectively.
Table 1.
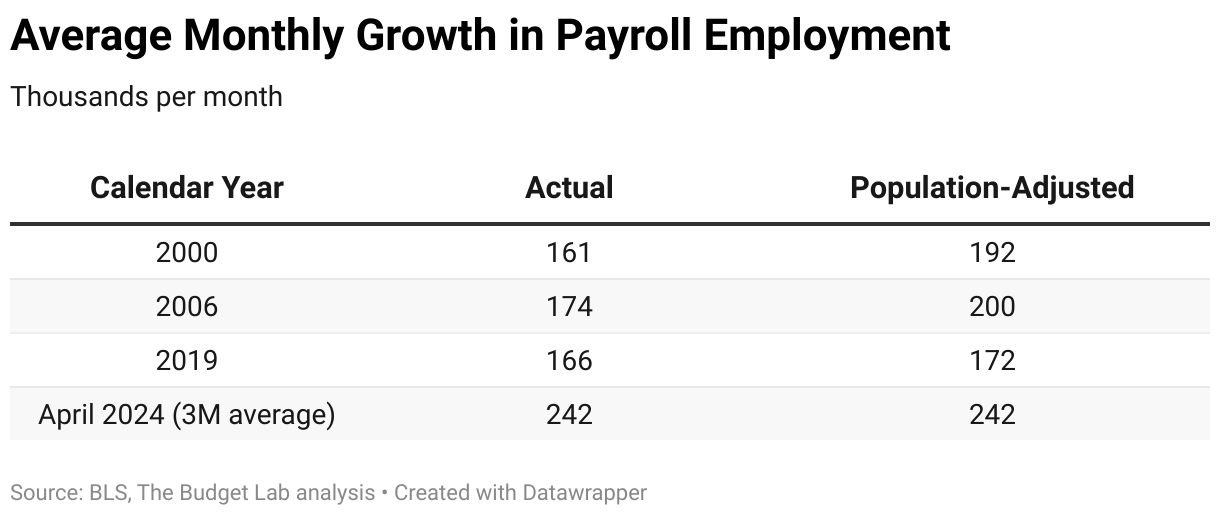
So the current 242,000 jobs growth pace is impressive even compared to recent robust labor markets. But these are historical years of strong growth. Even if job growth fell somewhat below these benchmarks, it would not necessarily signal a recession or even a weak labor market. It could merely mean that the labor market was expanding at an adequate and moderate, rather than a strong, pace.
A different approach then is to calculate the trend or “breakeven” pace of jobs growth. This is the amount of job growth needed to keep pace with growth in the labor force. If jobs are growing at the breakeven rate, then the unemployment rate will remain steady. Sustained jobs growth above the breakeven rate brings down the unemployment rate over time; growth below raises it. Figure 1 shows two approaches to calculating this breakeven pace. The first is a “mechanical” calculation similar to the one used in the Atlanta Fed’s Jobs Calculator, and is a conventional method labor economists use to estimate the breakeven rate. It calculates the number of new household employment jobs that would have been needed on average over the prior 12 months to keep the unemployment rate constant, and then converts that household employment number into equivalent CES payroll employment.2 As Figure 1 shows, this calculation can jump around because the labor force and unemployment rate data themselves are volatile. In April, the mechanical approach suggested breakeven jobs growth of around 120,000 per month. This is close to the long-run average of about 100,000. So the 242,000 average monthly jobs growth of the last three months is well above that mechanical breakeven, implying downward pressure on the unemployment rate and a hot labor market (see Figure 2).
Figure 1.
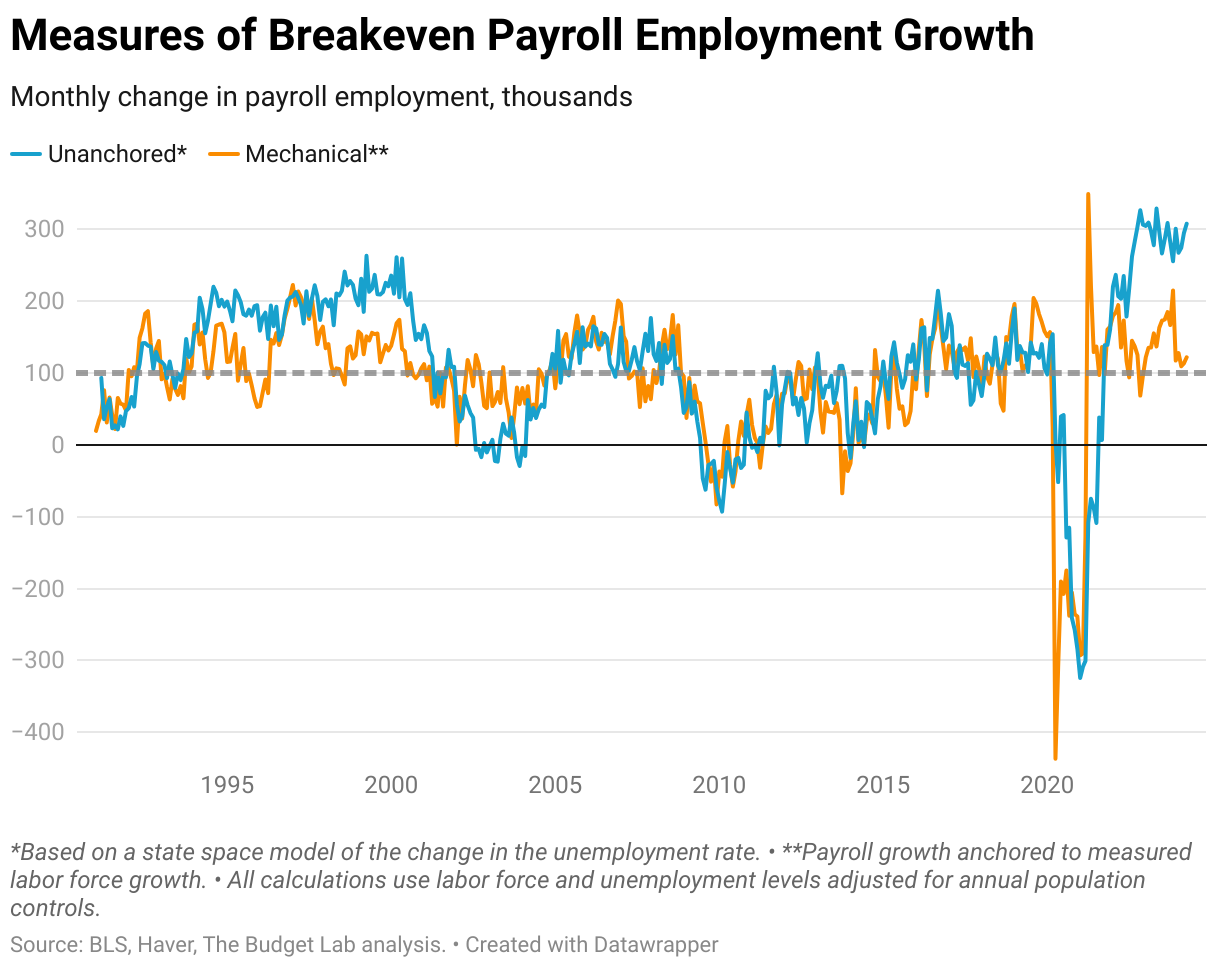
Figure 2.
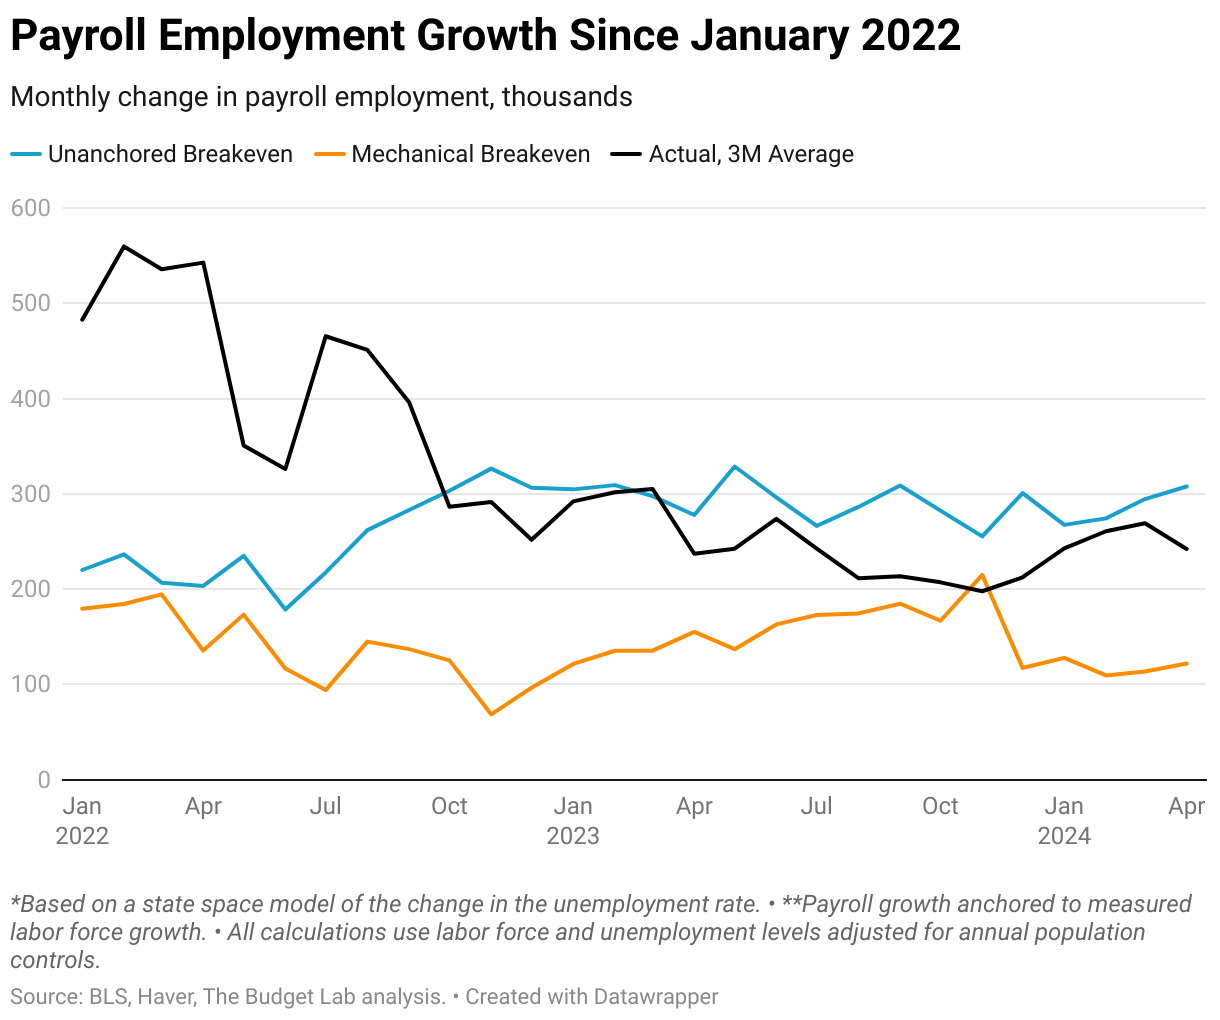
But the unemployment rate has not drifted down; if anything, it has ever-so-slightly risen. This movement is not concerning on its own—the unemployment rate remains remarkably low at below 4 percent—but it is the opposite of what the mechanical breakeven pace suggests ought to be happening in the labor market.
This raises the question of why the unemployment rate has not been falling more given strong payrolls growth. The answer may lie in the data themselves. Recently there have been concerns that the Current Population Survey (CPS), the source of official unemployment rate and labor force data (and a smaller, more volatile survey than the CES), may be undercounting the size of the labor force due to a combination of higher nonresponse rates and increased immigration.3 This possibility is not a certainty, and it will take years of additional, independent data—such as another decennial Census—before economists can fully evaluate it. But if the hypothesis were true, mechanically anchoring the breakeven payroll growth calculation to the CPS estimate of the labor force would understate the true breakeven pace of CES jobs growth in the economy.
The “unanchored” lines in Figure 1 and Figure 2 allows for this possibility of mismeasurement in the CPS by relaxing the relationship between the breakeven pace and the size of the labor force. Rather than mechanically calculating the breakeven rate from official CPS labor force growth, the unanchored breakeven allows the relationship between the breakeven pace and the change in the unemployment rate to vary and shift over time.4 Encouragingly, the unanchored version tracks the mechanical version for much of the last three decades. But in the last two years, the two approaches have diverged sharply: the unanchored approach suggests the breakeven pace of payroll growth is 300,000 a month rather than 120,000.
Put another way, the unanchored breakeven estimate reflects the fact that the unemployment rate has not fallen as much over the past two years as one would have expected given strong payroll employment growth. The model behind the unanchored breakeven interprets this outcome to mean that the breakeven pace of payroll growth has risen since 2022. This could be consistent with the aforementioned worries that the CPS is understating labor force growth. If in truth the labor force were expanding at a faster clip than the CPS shows—such as due to high immigration not fully measured by the CPS—then the 242,000 jobs added on average over the last three months in the payroll survey would not be as surprising or extraordinary. In fact it would signal a labor market that is much cooler than conventional approaches would indicate.5
The high unanchored breakeven pace is not itself concerning at the moment: the current 242,000 average payroll job growth is not far off from it, and breakeven job growth is uncertain anyway. But if the true pace of payroll employment growth is actually higher than widely appreciated, it could lead to an error by fiscal and monetary policymakers. For example, if the pace of payroll growth were to slow—say, to 100,000 a month—policymakers could misinterpret it as an acceptable pace of jobs growth requiring no dramatic change in policy, rather than a weak report that might otherwise motivate fiscal or monetary policy intervention.
Correction: an earlier version of this post misstated the benchmark adjustment to payroll employment figure in footnote 5.
Footnotes
- The simple adjustment here is to take the percent growth in payroll employment over December 1999 to December 2000 and apply it to the level of payroll employment in April 2023 (twelve months ago). The US workforce is also older now than it was in 2000, which may affect job growth comparisons.
- The Current Population Survey, the source of the official unemployment rate and the size of the labor force, reports a concept of employment called “household employment”, whereas the Current Employment Statistics data reports “payroll employment” which is the less volatile and more commonly-cited source of job growth numbers. Household and payroll employment are related concepts but have several key differences .
- For a more extensive explanation, see the Appendix of Tedeschi (2024).
- More specifically, the unanchored breakeven pace is a state variable in a state space model where the year-on-year change in the unemployment rate is estimated using two lags of itself and the gap between actual and breakeven payroll growth.
- This is not the only possible explanation for the divergence between these approaches. CES payroll employment growth may be overstated at the moment. Every year, BLS rebenchmarks payroll employment to more closely match administrative state unemployment insurance data on establishments and employment. These adjustments can be either positive or negative. The last benchmark adjustment to payroll employment was -266,000 to the March 2023 level, which is reflected in the current payroll employment data. However, a large wedge between the mechanical and unanchored breakevens is still present in March 2023 even after the benchmark adjustments, suggesting that the high unanchored breakeven is not being driven by mismeasurement in the CES.