The “No Tax on Tips Act”: Background on Tipped Workers
Last Thursday, Senators Cruz, Scott, Daines, and Kramer introduced the “No Tax on Tips Act”. The bill excludes tipped income from federal income taxes (but, importantly, not from federal payroll taxes).
This brief analysis puts the new bill in the context of the current US tipped workforce and the tax system. Tipped workers do not make up a large share of employment. They also tend to be much younger than non-tipped workers, and many already have very low federal income tax liability.
Tipped work is only a small sliver of the labor market.
“Tipped occupations” are jobs where tips are common in the US, such as waiters & waitresses, bartenders, barbers, and hairdressers.1 The Budget Lab estimates that there were roughly 4 million workers in tipped occupations in 2023. That’s about 2 ½ percent of all employment.
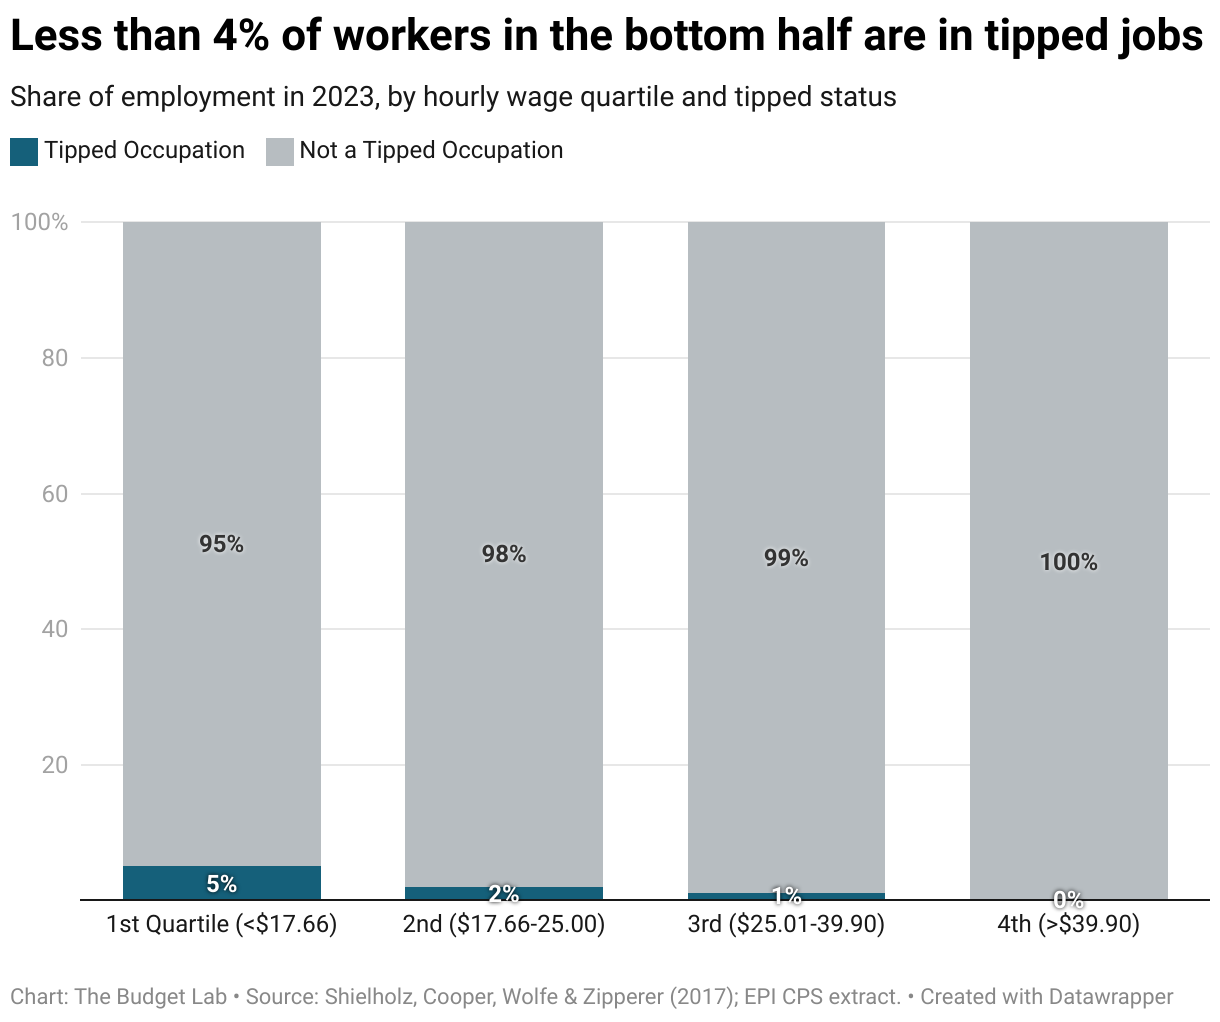
Perhaps surprisingly, this share does not rise substantially when just looking at low wage employment. Among workers in the bottom half of hourly wages—those earning below $25 an hour in 2023—less than 4 percent were in tipped occupations. Among workers in the bottom quarter (<$17.66 an hour), the share was 5 percent.
Tipped workers tend to be younger.
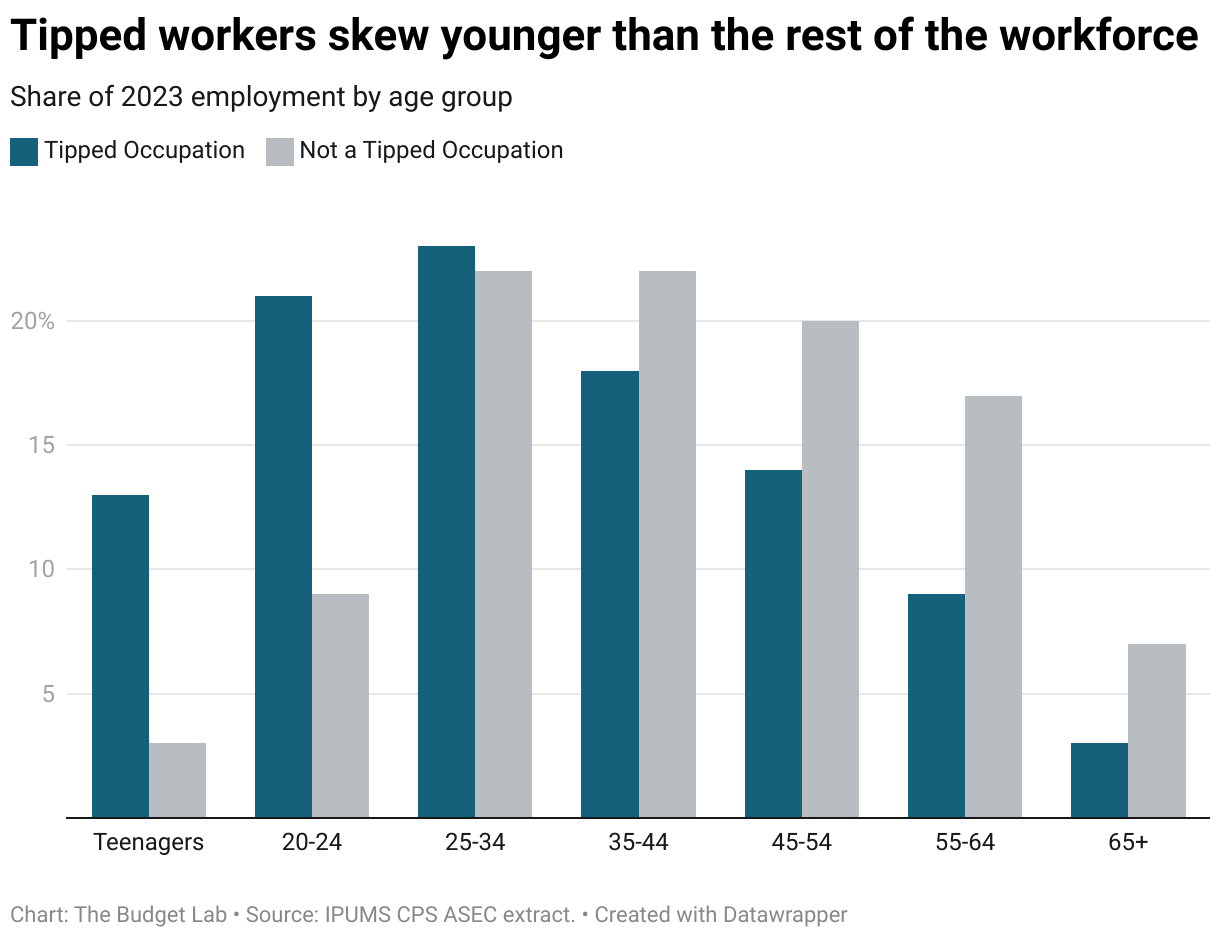
The median non-tipped worker in 2023 was 41 years old. The typical tipped worker in contrast was a full 10 years younger: 31 years old. A third of tipped workers are below 25 (versus 12 percent for non-tipped), with 13 percent being teenagers (3 percent for non-tipped).
A meaningful share of tipped workers already pay zero federal income tax.
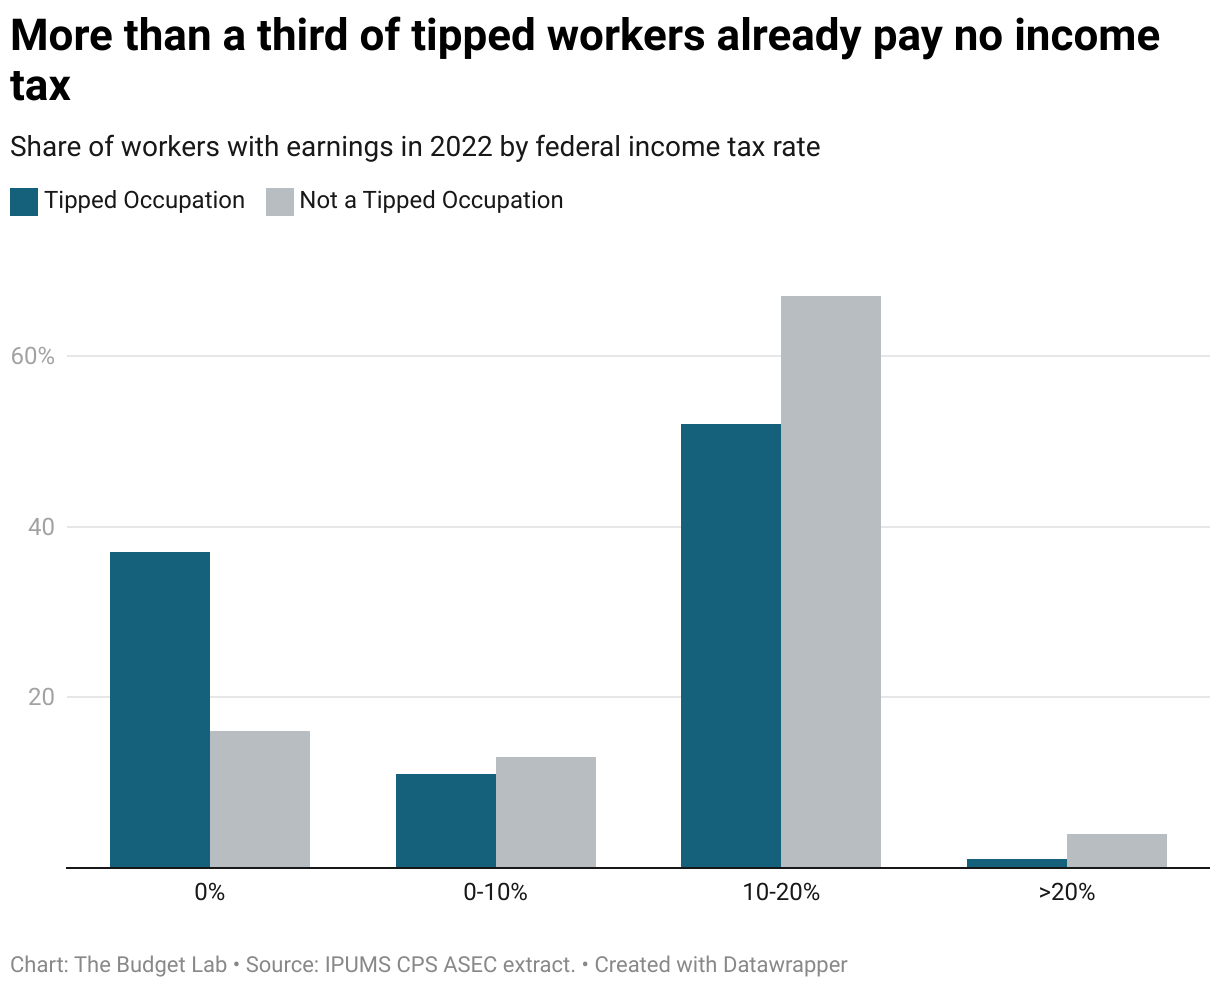
Tipped workers tend to be lower income: the median weekly wage for tipped occupations in 2023 was $538, versus $1,000 for non-tipped workers.2 This also means that tipped workers typically face a lower federal income tax burden, since the federal income tax is progressive. More than a third—37 percent—of tipped workers had incomes low enough that they faced no federal income tax in 2022, even before accounting for tax credits.3 For non-tipped occupations, the equivalent share was only 16 percent.
This suggests that the direct effect of the bill on the workforce as it stands today—before accounting for behavioral changes—would be small. The larger and far more uncertain effect would stem from behavioral changes incentivized by the bill, such as substitution into tipped employment and tipped income, which would increase the bill’s overall cost.
Footnotes
- This analysis uses the occupation list in Shierholz, Cooper, Wolfe, and Zipperer (2017) for defining “tipped occupations” in the Current Population Survey Outgoing Rotation Group. In 2018, after that paper’s publication, Census expanded “miscellaneous personal appearance workers” (Census occupational code 4520) into three new occupation codes: 4521, 4522, and 4525. This analysis treats all three of these new post-2018 codes as tipped occupations.
- These weekly wage numbers are inclusive of tips. Note that the federal tipped minimum wage is $2.13/hour. This is the direct wage an employer is obligated to pay a tipped employee. However, a tipped employee must also make enough in tips to bring total earnings to the overall federal minimum wage of $7.25/hour. If tips fall short of allowing earnings to reach this threshold, the employer must cover the difference. Many states and localities have higher overall minimum and tipped minimum wages than the federal level.
- More precisely: 37 percent of tipped workers in 2022 (as measured in the 2023 CPS ASEC) were in tax units that paid zero federal individual income tax before credits. The Budget Lab included dependents in tipped occupations with positive earnings in this analysis. Note that even when federal income tax liability is zero, tipped workers and their employers pay federal payroll taxes (e.g. FICA taxes).