How Would TCJA Reform Affect Inequality?
Key Takeaways
-
The Full Extension scenario would cut taxes on average for all income groups, with the largest cuts for those in the top 10 percent.
-
The Partial Extension scenario would be nearly identical in its impacts for the bottom 99 percent of the income distribution, with those ranked in the 99th to 99.9th percentile seeing their income mostly unchanged from current law and the top 0.1 percent of tax units seeing a net tax increase.
-
Under the Clausing-Sarin proposal, families in the bottom sixty percent of the income distribution would see a tax cut, while those above the 80th percentile of income would see their taxes increase relative to current law.
In addition to having different effects on the federal budget, each policy reform would affect families differently depending on their economic and demographic characteristics. This section describes the distributional effects of each reform, comparing scenarios across several metrics for across the income distribution.
Measures of Distributional Impact
There are many ways to measure how a tax reform’s impacts vary by type of family. The first consideration is: along which characteristics do we distinguish families from one another? In this report, we focus on income (e.g., do higher-income families pay more than lower-income families?) and age (e.g., do younger workers benefit more than older retirees?).
Second, how is the impact measured? Some possible metrics include:
- Average tax change. In dollars, relative to current law, how much more (or less) on average does a group owe in taxes under the reform?
- Share with a tax cut or tax increase. Relative to current law, what percent of tax units see their tax liability fall? What percent experience a tax increase?
- Average tax change among those with a tax cut or tax increase. Among those whose taxes fall under the reform, what is the average tax cut? Similarly, what is the average tax increase for tax units who owe more?
- Percent change in after-tax income. By how much does a tax unit’s disposable income change under the reform in relative terms?
- Share of total tax change. How much of the total budgetary effect of the reform is allocated to a given group?
Finally, how do we account for taxes not directly levied on individuals? Specifically, who bears the economic burden of the corporate income tax? This question is a matter of ongoing debate in economic research. We present distributional metrics with and without corporate tax changes, allowing the reader to isolate the portion of a change attributable to individual and payroll taxes only.
There is no one dimension, metric, or incidence assumption which fully captures the multifaceted nature of distributional impact. This section highlights a few notable findings.
Income Distribution
Average changes
We begin by looking at average impacts across the income distribution. The figure below shows how each reform option increases or decreases after-tax income in relative terms over the traditional budget window.
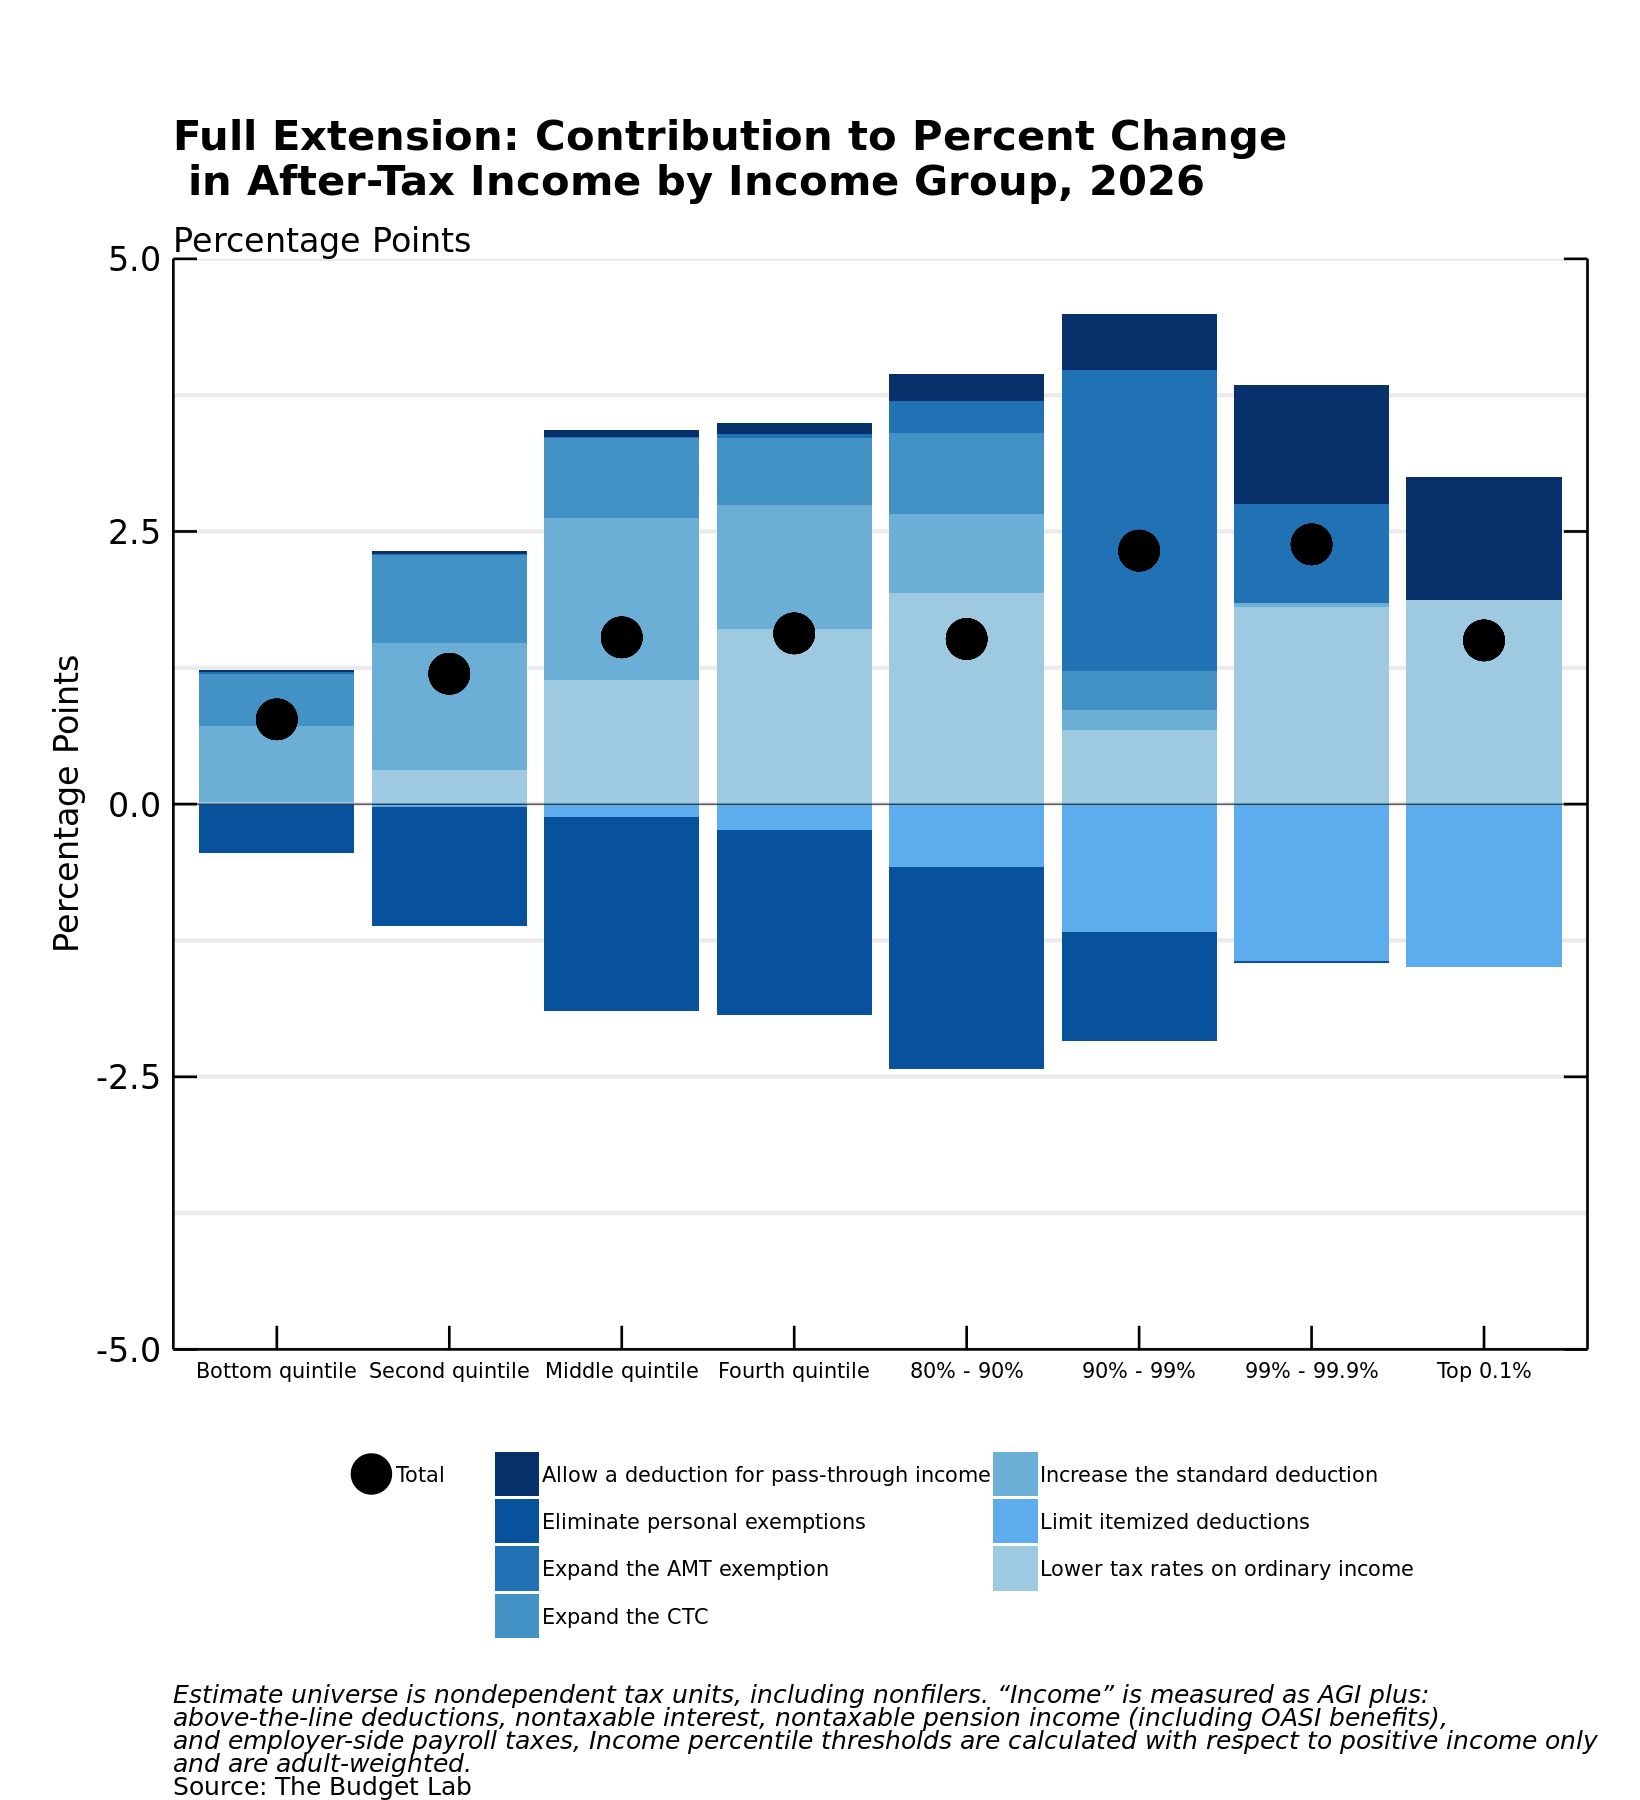
- Full Extension cuts taxes on average for each income group. In relative terms, the tax cut is largest for those in the top 10 percent of the income distribution, increasing after-tax incomes by more than 2 percent. The bottom quintile, a group that includes many tax units who do not have income, sees after-tax incomes rising by less than 1 percent on average.
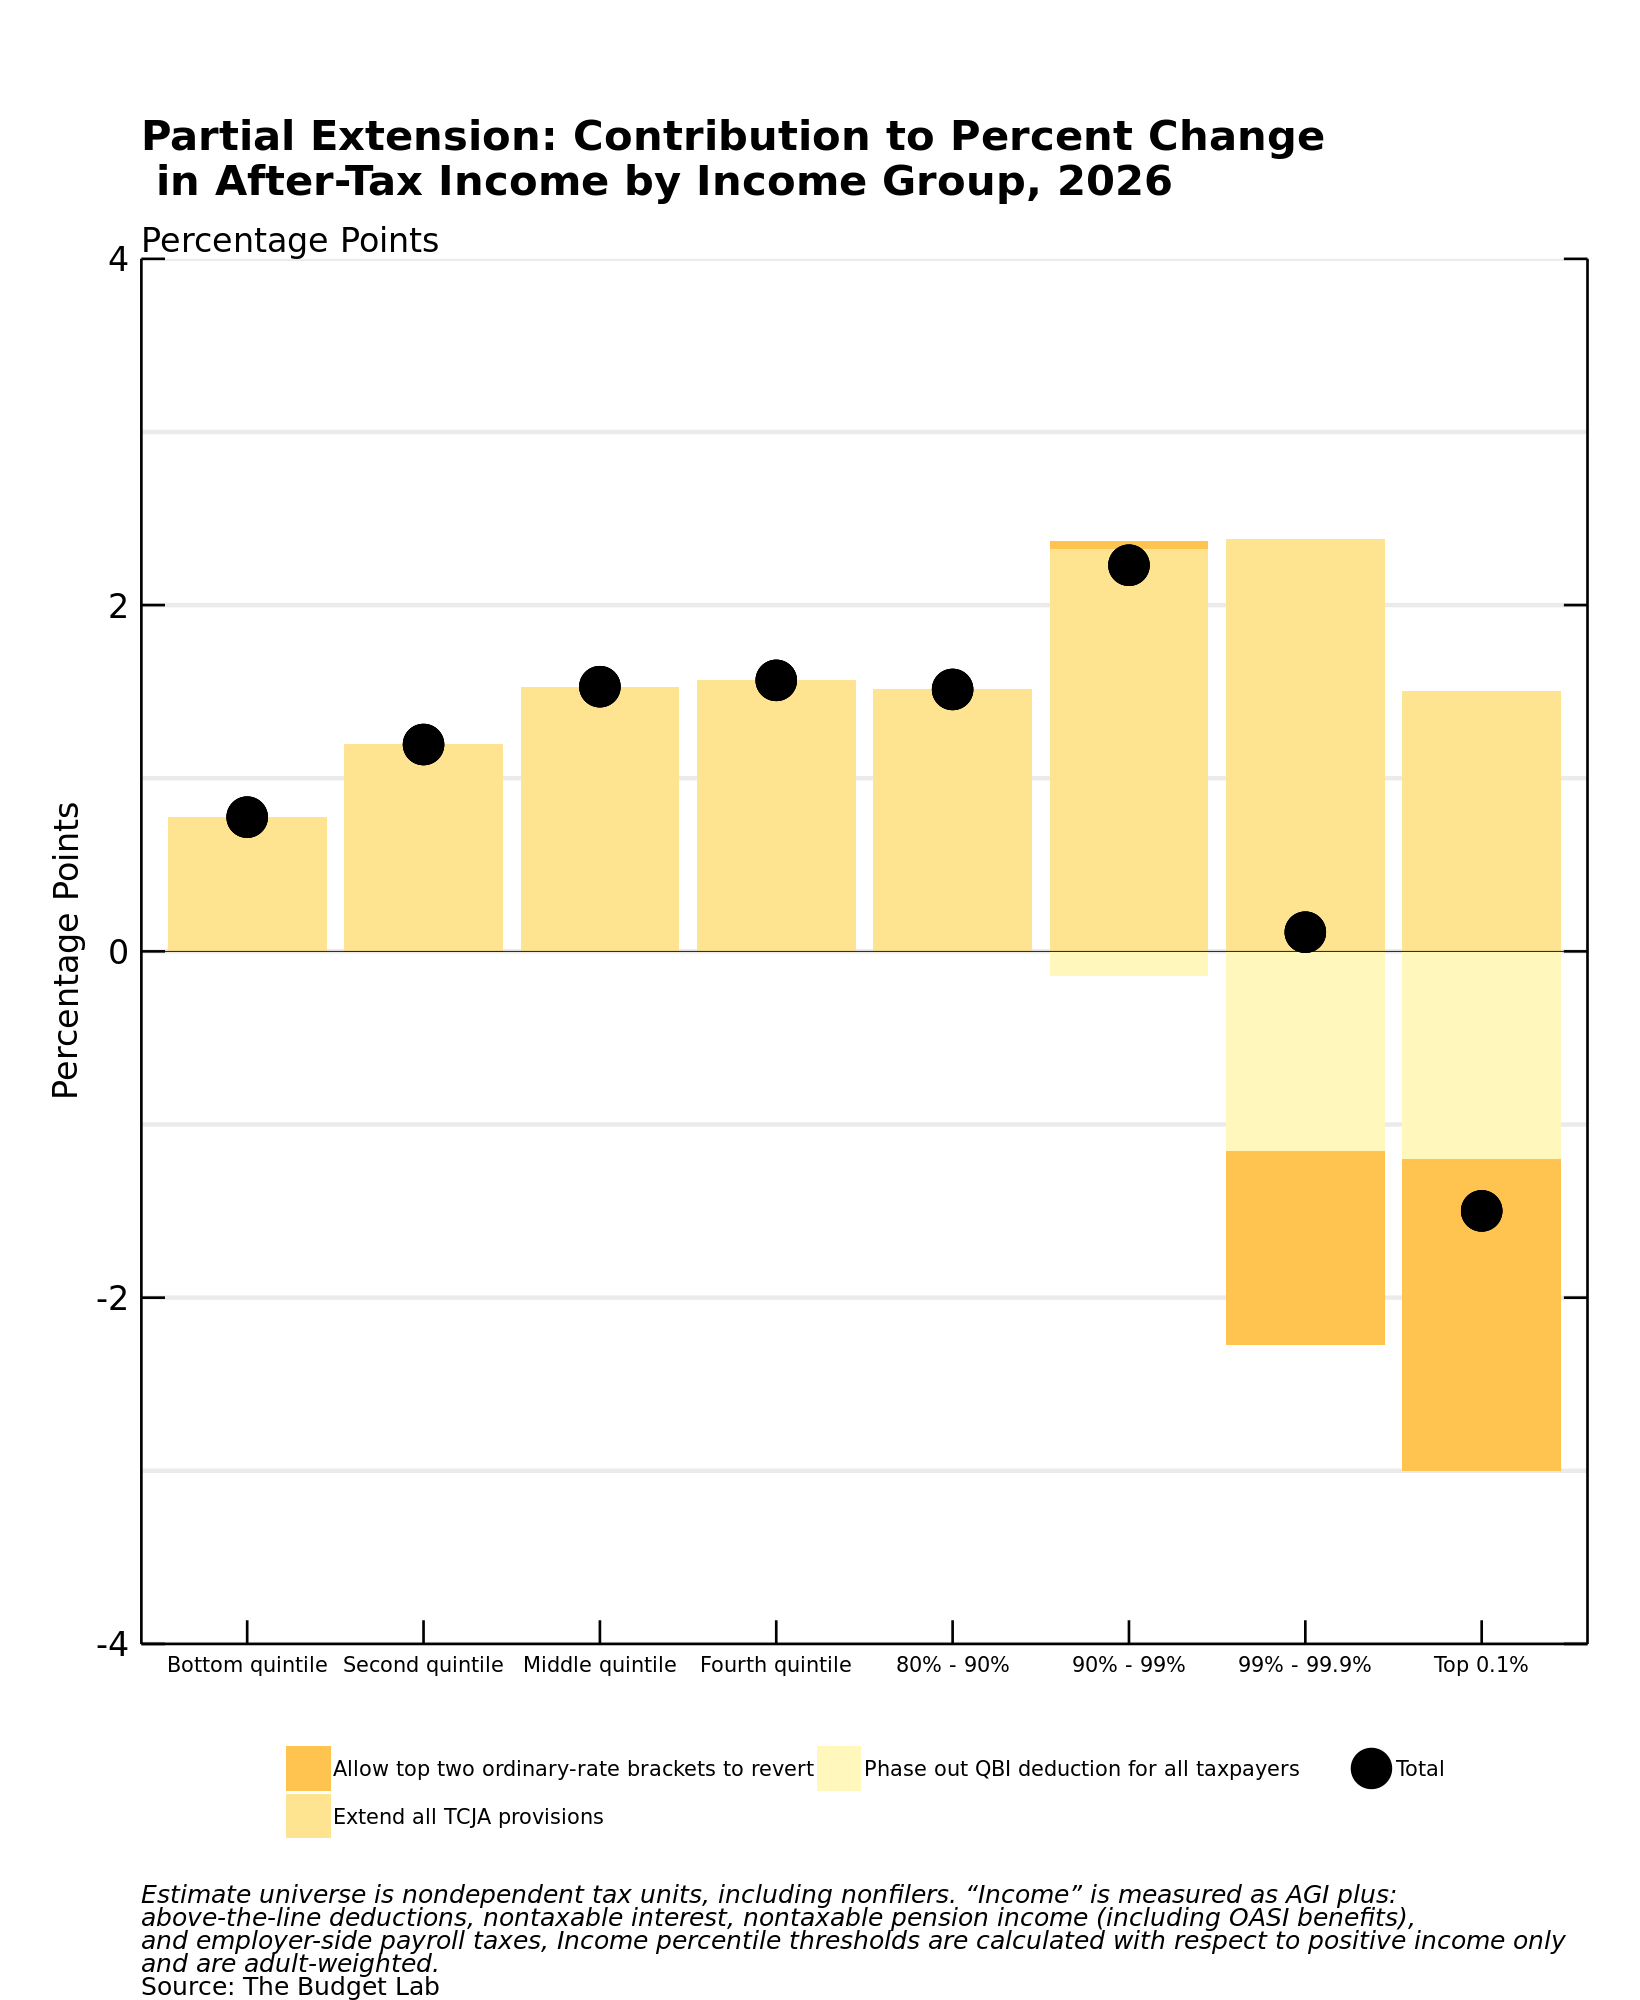
- Partial Extension is, by design, nearly identical in its impacts for the bottom 99 percent of filers. For those ranked in the 99th to 99.9th percentile, the mix of tax changes is a wash, leaving after-tax income mostly unchanged from current law. The top 0.1 percent of tax units see a net tax increase as a group.
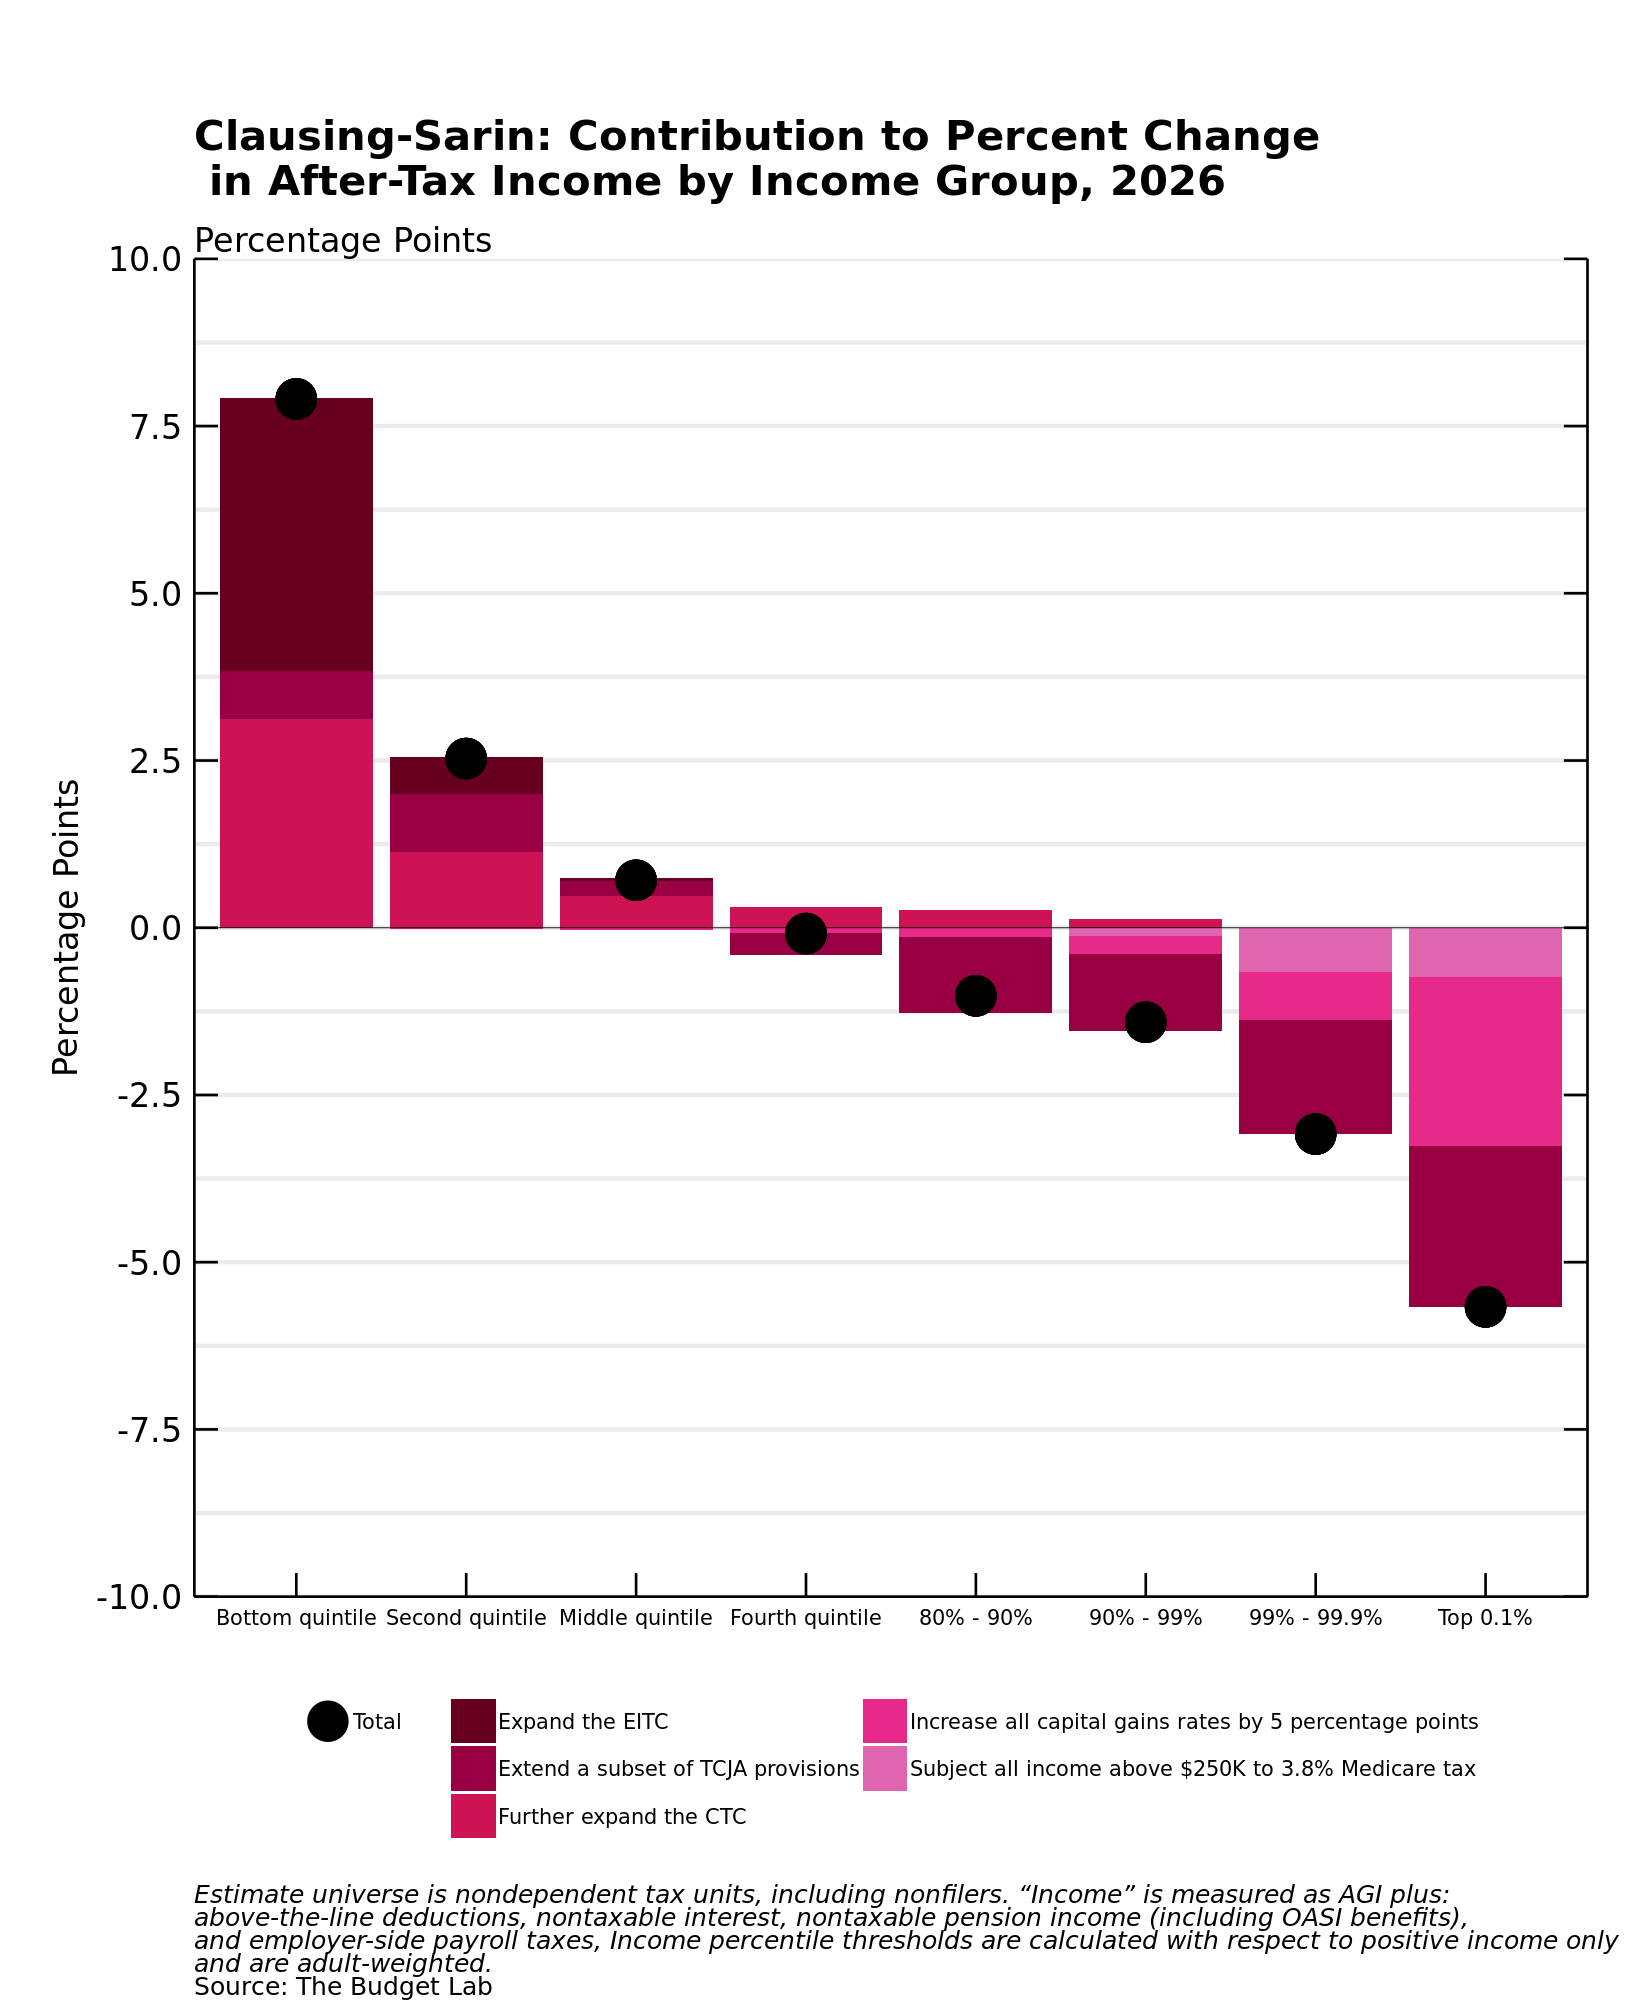
- Under Clausing-Sarin, families in the bottom two quintiles are net beneficiaries due to larger refundable tax credits, which more than offset the lack of tax rate cuts. The middle quintile also remains a net beneficiary under Clausing-Sarin, though less so than under Full Extension. Tax units in the top quintile owe more under the proposal, and those within this group owe more as income rises. Assuming that in the first year of enactment the entire corporate tax burden falls on investors rather than workers, the reform’s corporate tax changes add to the burden of all groups, though only meaningfully so at the top of the income distribution.
The following three figures decompose the total change presented in the figure above by provision, quantifying how each piece of a reform contributes to its overall impact.1
The TCJA reformed individual income taxes through a mix of revenue-losing provisions and revenue-raising provisions. On average, Full Extension generates a net tax cut for all income groups. But how that net tax cut is achieved varies by income group:2
- Lower-income groups receive the most benefit from the larger standard deduction and the CTC expansion. These provisions more than offset the loss of personal exemptions, which are worth less at this income level because these tax units generally face lower statutory marginal rates. For the same reason, lower rates contribute relatively little to lowering their tax burden. Neither restrictions on itemized deductions nor the QBI deduction play a role at this income level, owing to low rates of itemizing and business ownership.
- For middle to upper-middle income groups, the loss of personal exemptions (including dependent exemptions) increases taxes paid substantially, only partially offset by the more generous CTC. The driving force in generating tax cuts for this group is lower tax rates. The negative effect of limiting itemized deductions grows with income, reflecting the correlation between income and itemization under current law. AMT changes help those filers in the 90-99th percentiles who, due to higher-than-average state income tax liabilities but insufficiently high tax rates, are likely to face the AMT under current law.
- Itemizing restrictions bind most stringently for the top 1 percent, but this effect is more than offset by lower tax rates and the QBI deduction (reflecting the concentration of business income at the top). Because the CTC and personal exemptions phase out below this income group, and because very few filers at this level take the standard deduction, these provisions have no effect.

The Partial Extension option is designed so that the tax cuts under Full Extension are preserved for approximately the bottom 99 percent of tax units. Above this threshold, marginal rates are set at current law levels and the QBI deduction is disallowed. These clawbacks precisely offset tax cuts for those in the 99th to 99.9th percentiles. For the top 0.1 percent, these changes generate a net tax increase, with after-tax income falling nearly 2 percent relative to current law.

- The TCJA extension provisions in Clausing-Sarin alone generate a progressive tax change. In other words, removing rate cuts and the QBI deduction from Full Extension raises revenue and cuts taxes (against current law) for the bottom half of the income distribution.
- The bottom quintile benefits substantially from the CTC reforms that allow low-income families to fully claim the larger credit. The expansion of the EITC to younger and childless workers also benefits the bottom quintile.
- Compared with lower-income families, the top 1 percent earns a greater share of income from capital gains, dividends, and pass-through businesses. The Clausing-Sarin reform would tax income from these sources more heavily.
Some provisions in Clausing-Sarin were not included in the distributional analysis due to modeling difficulties. These include international tax reforms, the carbon tax, the financial transactions tax, the PTC provision, carryover basis, and carried interest reform.
Winners and losers
Average tax changes might mask variation within a group. A policy reform that delivers an overall tax cut on average to an income group might nonetheless raise taxes on some families in that group. For instance, even though the Full Extension option would cut taxes on average for all groups, some tax units would owe more compared to current law. In total, the TCJA amounted to a net tax cut, but the package comprised of both revenue-losing provisions (e.g., lower tax rates and the QBI deduction) and revenue-raising provisions (e.g., the SALT cap and the elimination of personal exemptions). Those with tax increases are filers who are disproportionately burdened by one of the revenue-raising provisions while receiving limited benefits from the revenue-losing provisions – for example, a family with a large state income tax liability and professional services business income that does not qualify for the QBI deduction.
- For each group other than the bottom quintile, the Full Extension scenario would deliver tax cuts to a majority of tax units in 2026. For groups between the 40th and 99.9th percentiles, approximately four in five tax units would pay lower taxes under the reform. At the lowest end of the income distribution, a larger share of tax units experience neither a tax cut nor a tax increase, reflecting the presence of many tax units who do not earn enough income to produce any income tax liability under current law.
- Like the results shown above, the Partial Extension scenario delivers a functionally identical distribution of tax cuts and tax increases to the bottom 99 percent. For the top 1 percent, though, a larger share of tax units now sees a tax increase in 2026. The provision responsible for this difference is the SALT cap limitation, no longer offset by lower rates or a QBI deduction as in the Full Extension scenario.
- Compared to Full Extension, the Clausing-Sarin reform results in a higher share of tax units at the bottom end of the distribution whose taxes fall relative to current law. This difference is largely attributable to the plan’s CTC provision, which unlike under current law or the TCJA design, allows even the poorest families with little-to-no earnings to receive the full, larger credit value.
- As income rises past the middle of the distribution, tax cuts become rarer and tax increases more common under the Clausing-Sarin reform. This pattern reflects two factors: one, it is a revenue-raising package, meaning that tax burdens are generally larger than those of current law and TCJA extension, and two, its design is more progressive than current law or TCJA extension.
