
The Fiscal and Economic Effects of the Revised April 9 Tariffs
Key Takeaways
-
The Budget Lab estimated the effects all US tariffs and foreign retaliation implemented in 2025 through April 9, including the revised April 9 tariffs.
-
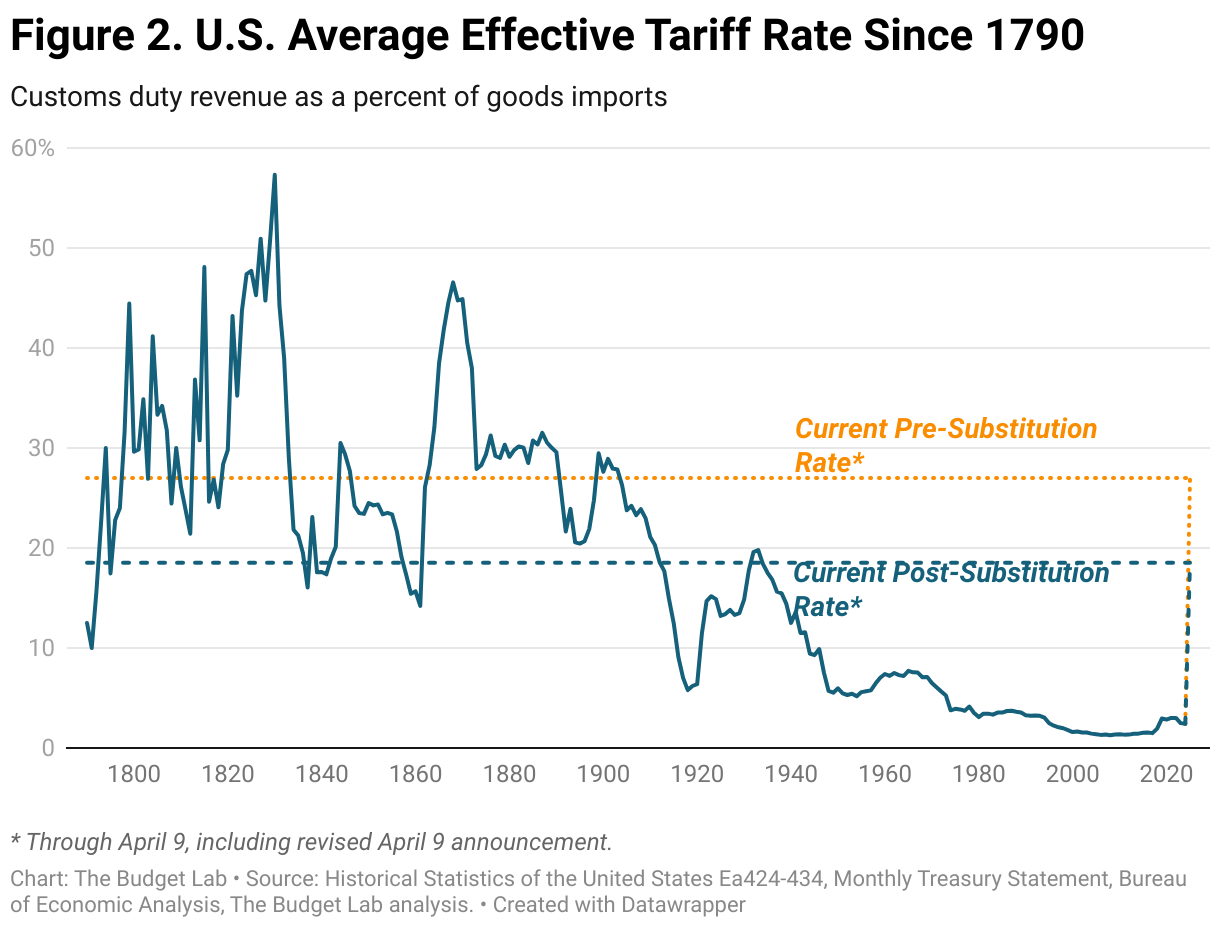
Current Tariff Rate: Consumers face an overall average effective tariff rate of 27%, the highest since 1903. This is only slightly different from where the effective rate was before the late-April 9 announcement. Even after consumption shifts, the average tariff rate will be 18.5%, the highest since 1933.
-
Overall Price Level & Distributional Effects: The price level from all 2025 tariffs rises by 2.9% in the short-run, the equivalent of an average per household consumer loss of $4,700 in 2024$. Annual pre-substitution losses for households at the bottom of the income distribution are $2,100. The post-substitution price increase settles at 1.7%, a $2,700 loss per household.
-
Commodity Prices: The 2025 tariffs disproportionately affect clothing and textiles, with consumers facing 64% higher apparel prices in the short-run. Apparel prices stay 27% higher in the long-run.
-
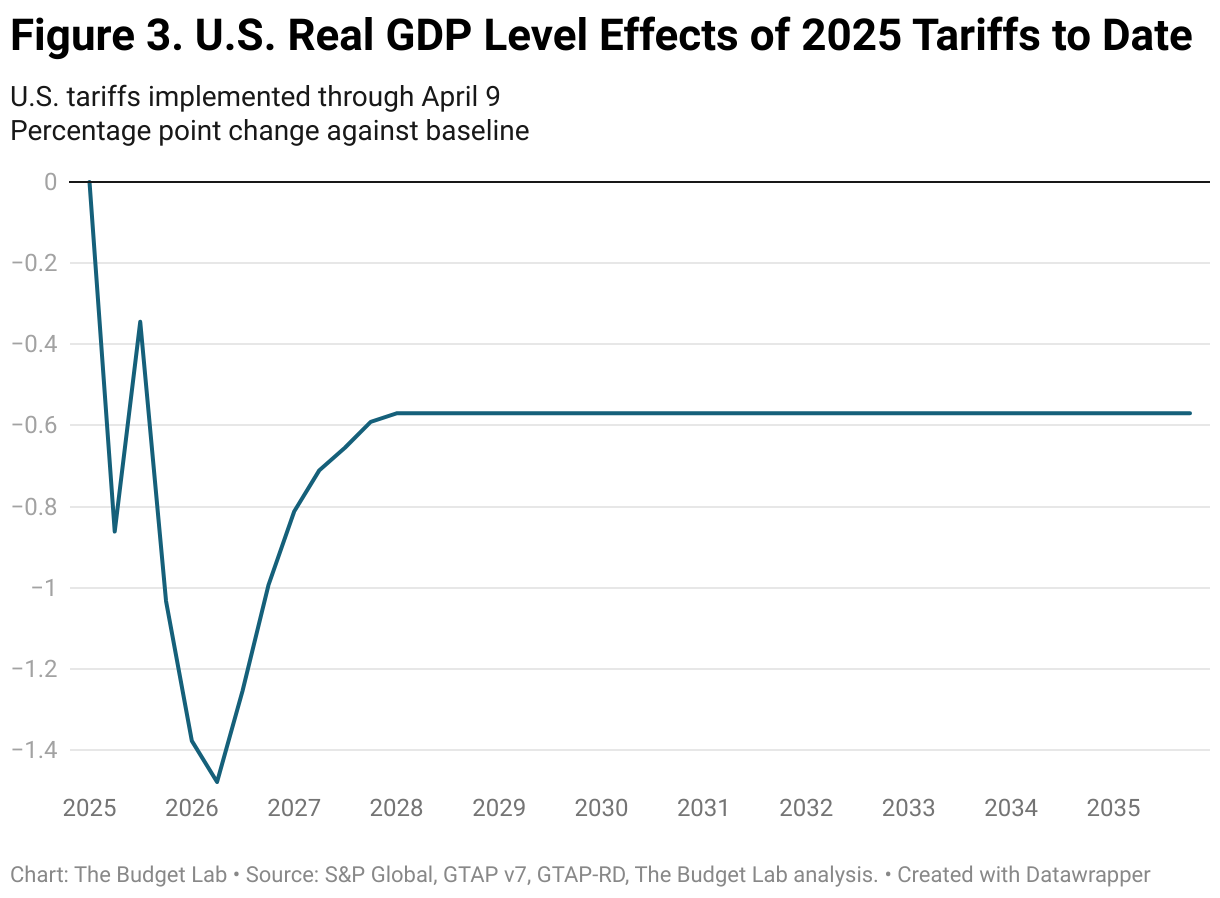
Real GDP Effects: US real GDP growth is -1.1pp lower from all 2025 tariffs. In the long-run, the US economy is persistently -0.6% smaller respectively, the equivalent of $170 billion annually in 2024$.
-
Labor Market Effects: The unemployment rate rises 0.6 percentage point by the end of 2025, and payroll employment is 740,000 lower.
-
Fiscal Effects: All tariffs to date in 2025 raise $2.4 trillion over 2026-35, with $587 billion in negative dynamic revenue effects.
Note: Shortly after the Budget Lab’s original publication, the White House clarified that the 125% China tariffs were on top of, not inclusive of, the 20% IEEPA tariffs already in place, making the maximum rate on Chinese imports 145%. This report revises our numbers to reflect the clarified policy.
Introduction & Current Tariffs
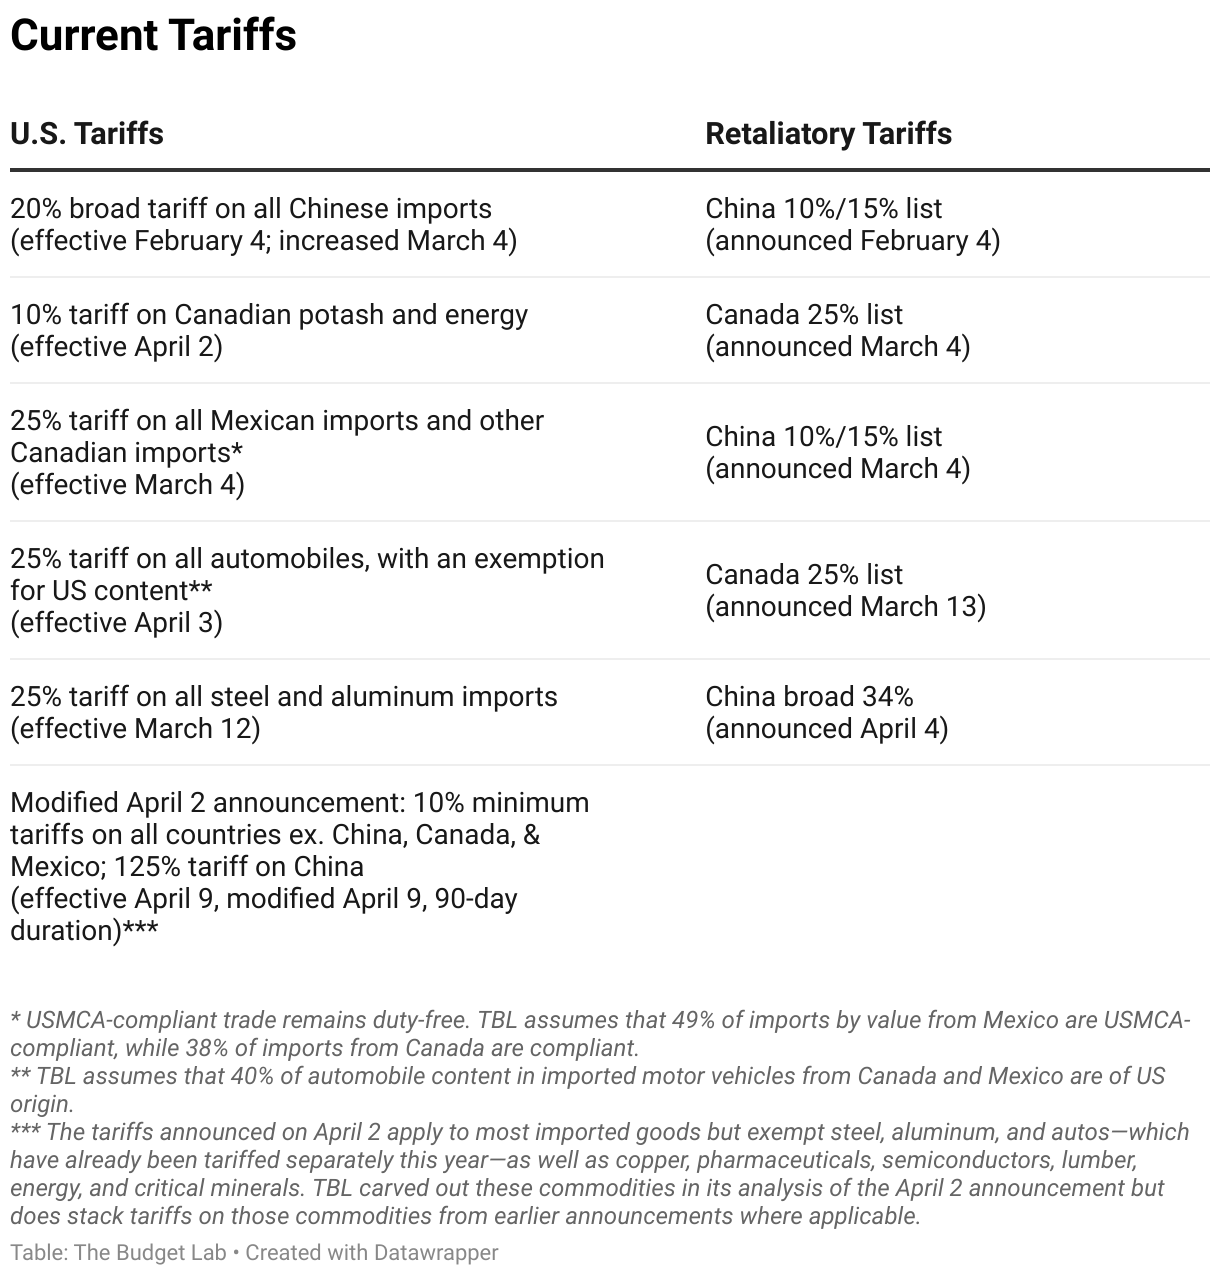
On the afternoon of April 9, the Trump Administration announced a significant revision to US tariff policy:
- The special “reciprocal” tariff rate, announced April 2 and effective April 9, are suspended for 90 days. During that time, the 10% minimum tariff rate applies universally to the same countries and the same base as the April 2 announcement, other than China.
- China’s April 2 “reciprocal” tariff is raised to 125%; in tandem with the 20% IEEPA tariffs, that raises the maximum rate on the April 2 base to 145%. For commodities carved out of the April 2 announcement with separate tariffs already in place (steel, aluminum, automobiles), the rate is 45%. For other April 2 carve-outs (lumber, pharmaceuticals, semiconductors, etc.), the rate is currently 20%.
This leaves 2025 U.S. tariff policy as of the afternoon of April 9 as follows, for the next 90 days:
Results
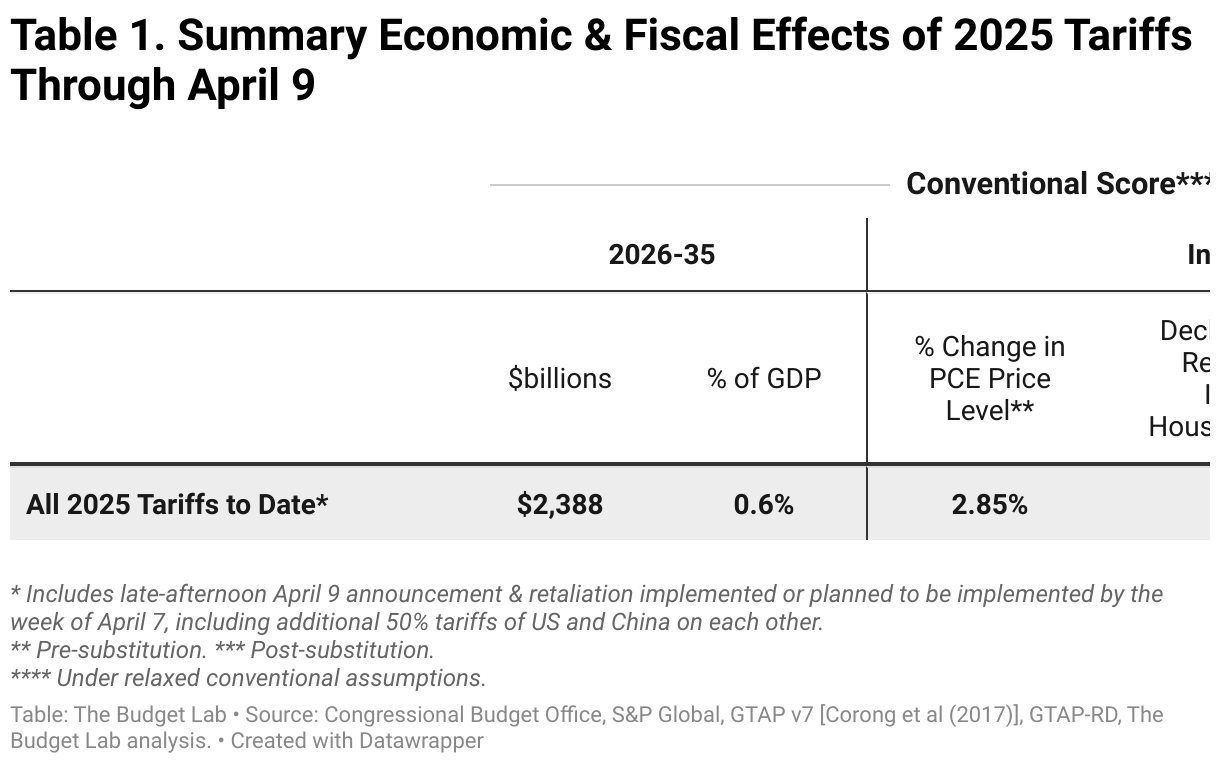
The table below summarizes the effects of the revised April 9 tariffs, assuming they stayed in place indefinitely.
Average effective tariff rate
The sheer size of the proposed tariff on China means that the distinction between pre-substitution (before consumers and businesses shift purchases in response to the tariffs) and post-substitution (after they shift) is a crucial one. One metric where the difference is substantial is the average effective tariff rate.
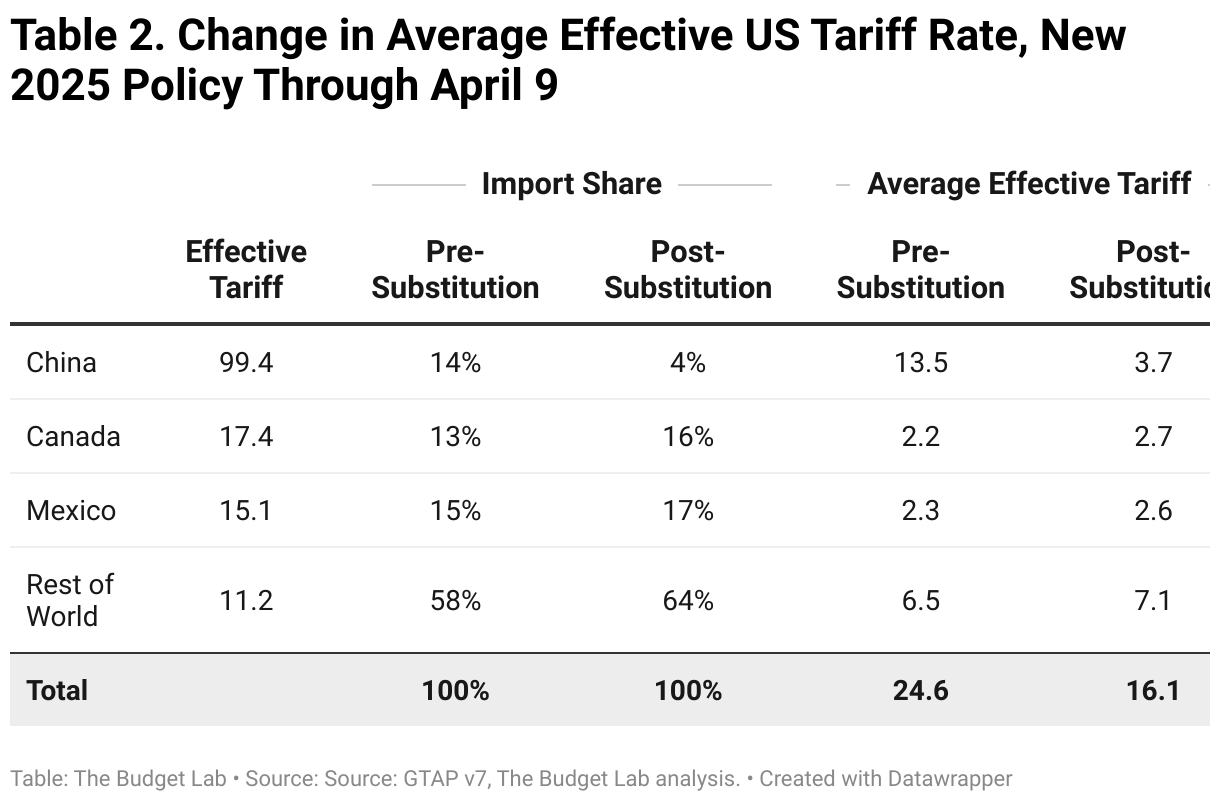
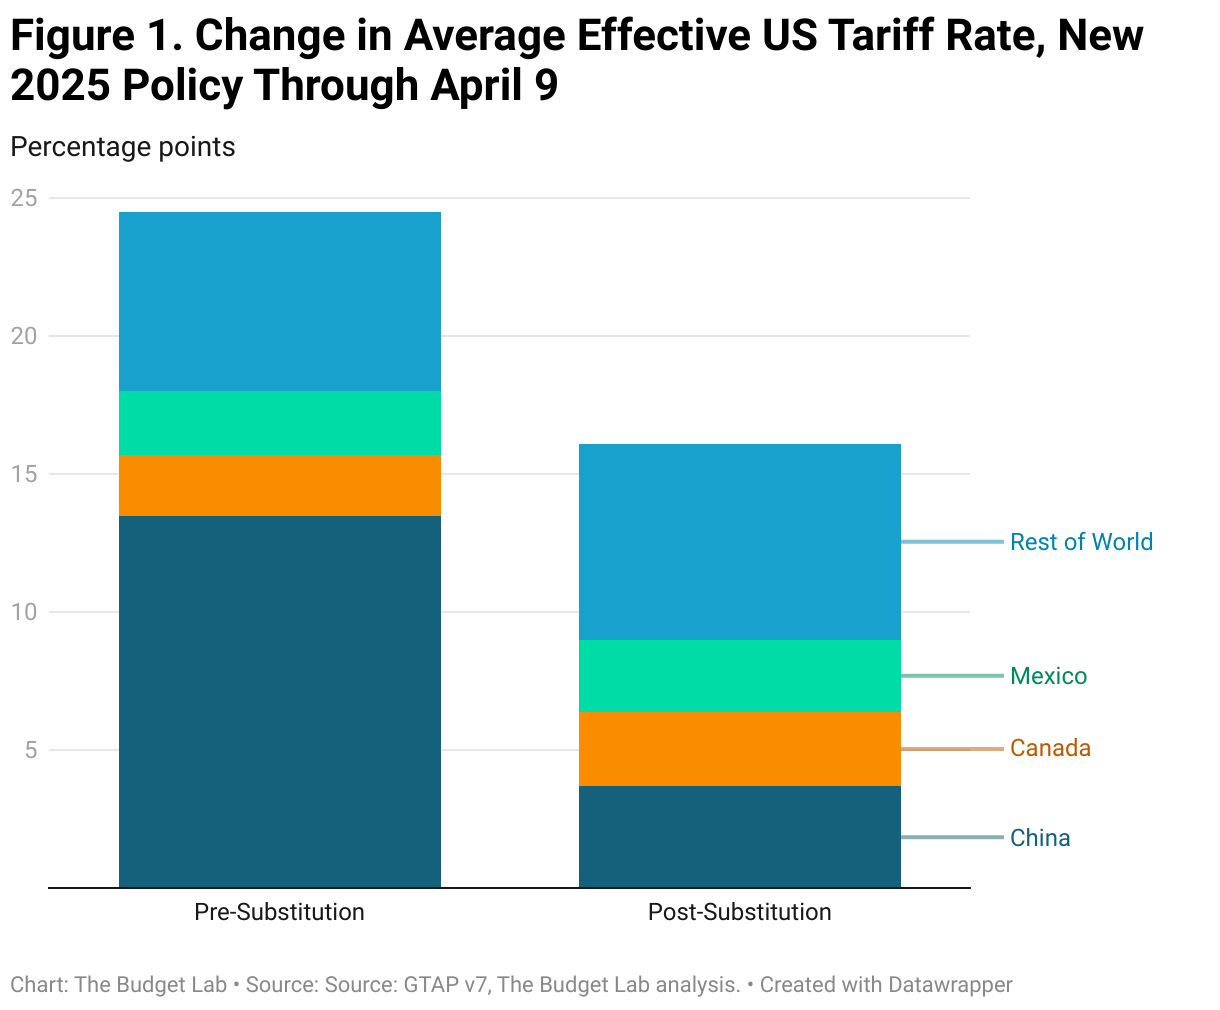
Measured pre-substitution—assuming there are no shifts in the import shares of different countries—the 2025 tariffs to date are the equivalent of a 24.6 percentage point increase in the US average effective tariff rate. That calculation assumes that under the new 125% China tariffs on certain goods, the share of imports from China remains at 14%, where it was in 2024. This is the right way to think about the tariffs from the perspective of consumer welfare, since it reflects the full cost faced by consumers before they start making difficult spending choices. This increase would bring the overall US average effective tariff rate to 27%, the highest since 1903. This is only slightly different from where the effective rate was before the late-April 9 announcement.
Post-substitution—after imports shift in response to the tariffs—the 2025 tariffs are a 16.1 percentage point increase in the US average effective tariff rate, due to the substantial fall in China’s share of US imports as American consumers and businesses find alternatives for Chinese imports. China’s import share goes from 14% to 4% as a result of the tariffs, which, compositionally, means that fewer Americans are paying the China tariffs which means it has less “weight” in the post-substitution average effective tariff rate calculation. The 16.1pp increase brings the overall US effective tariff rate to 18.5%, the highest since 1933.
The timing of the transition from “pre” to “post” substitution is highly uncertain. Some shifts are likely to happen quickly—within days or weeks—while others may take longer.1
Average aggregate price impact
The 2025 tariffs imply an increase in consumer prices of 2.9% in the short-run, assuming no policy reaction from the Federal Reserve. This is a pre-substitution number that captures consumer welfare effects. It is the equivalent of a loss of purchasing power of $4,700 per household on average in 2024 dollars. The post-substitution price increase settles at 1.7%, a $2,700 loss per household.
US real GDP & labor market effects
All 2025 US tariffs plus foreign retaliation lower real GDP growth by -1.1pp over calendar year 2025 (Q4-Q4). The unemployment rate ends 2025 0.55 percentage point higher, and payroll employment is 740,000 lower that same quarter. The level of real GDP remains persistently -0.6% smaller in the long run, the equivalent of $170 billion 2024$ annually, while exports are -16% lower.
Global long-run real GDP effects
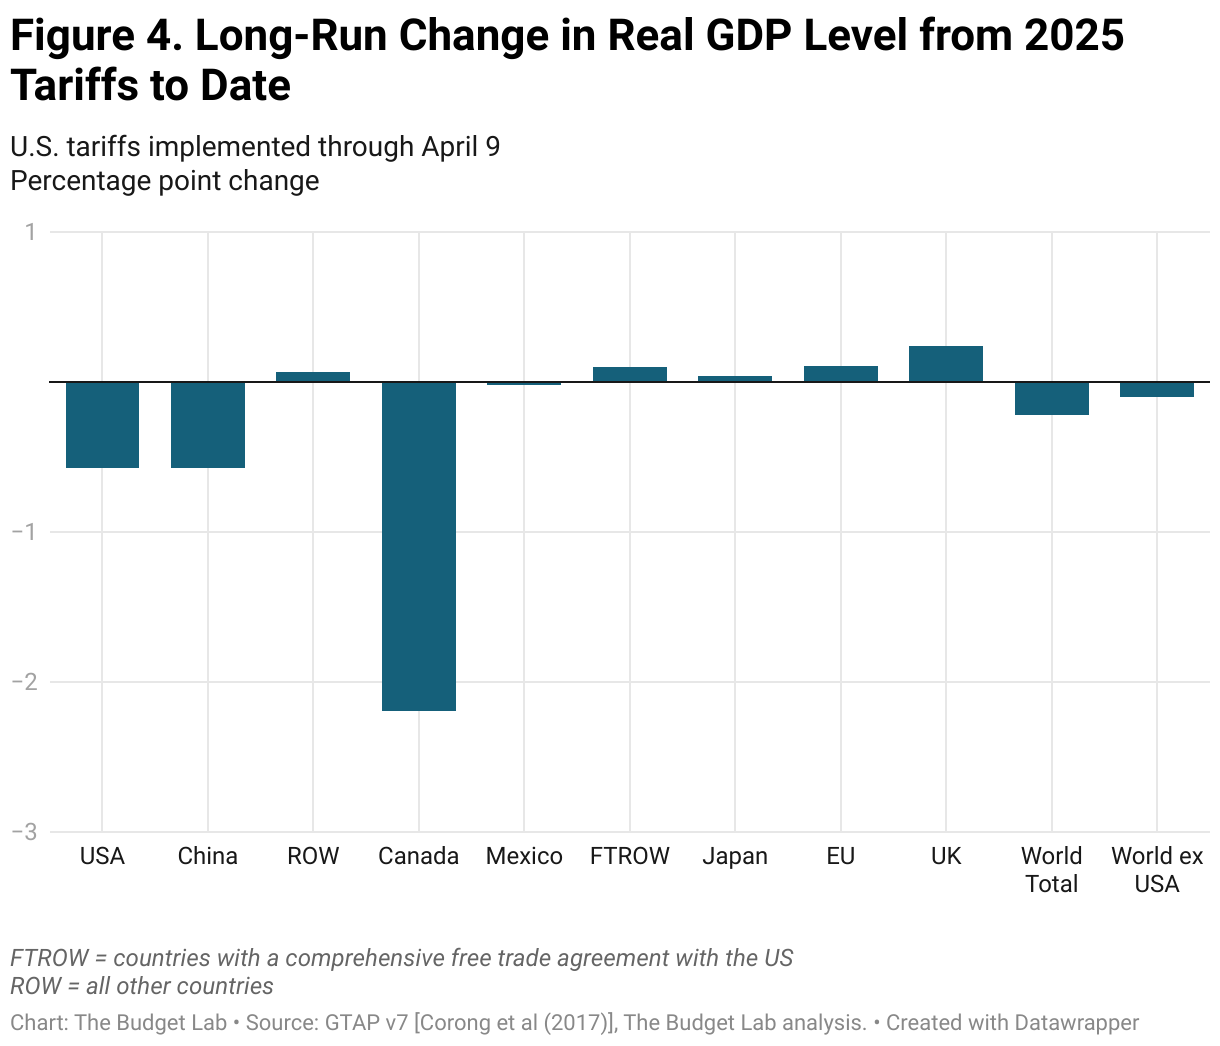
Canada has borne the brunt of the damage from US tariffs so far, with its long-run economy -2.2% smaller in real terms (reflecting both US tariffs and Canadian retaliation to date). China’s economy is -0.6% smaller, identical to the hit to the US. The EU economy is 0.1 percentage point larger in the long-run, while the UK’s is 0.2% bigger.
Fiscal impact & historical context
The 2025 tariffs to date, were they to remain in place (and not expire after 90 days), would raise $2.4 trillion over 2026-35 conventionally-scored.2 Given the negative output effects of the tariffs, there would be additional dynamic reductions in tax revenue as a result. Based on Congressional Budget Office rules-of-thumb, TBL estimates that these effects would total -$587 billion over the decade.
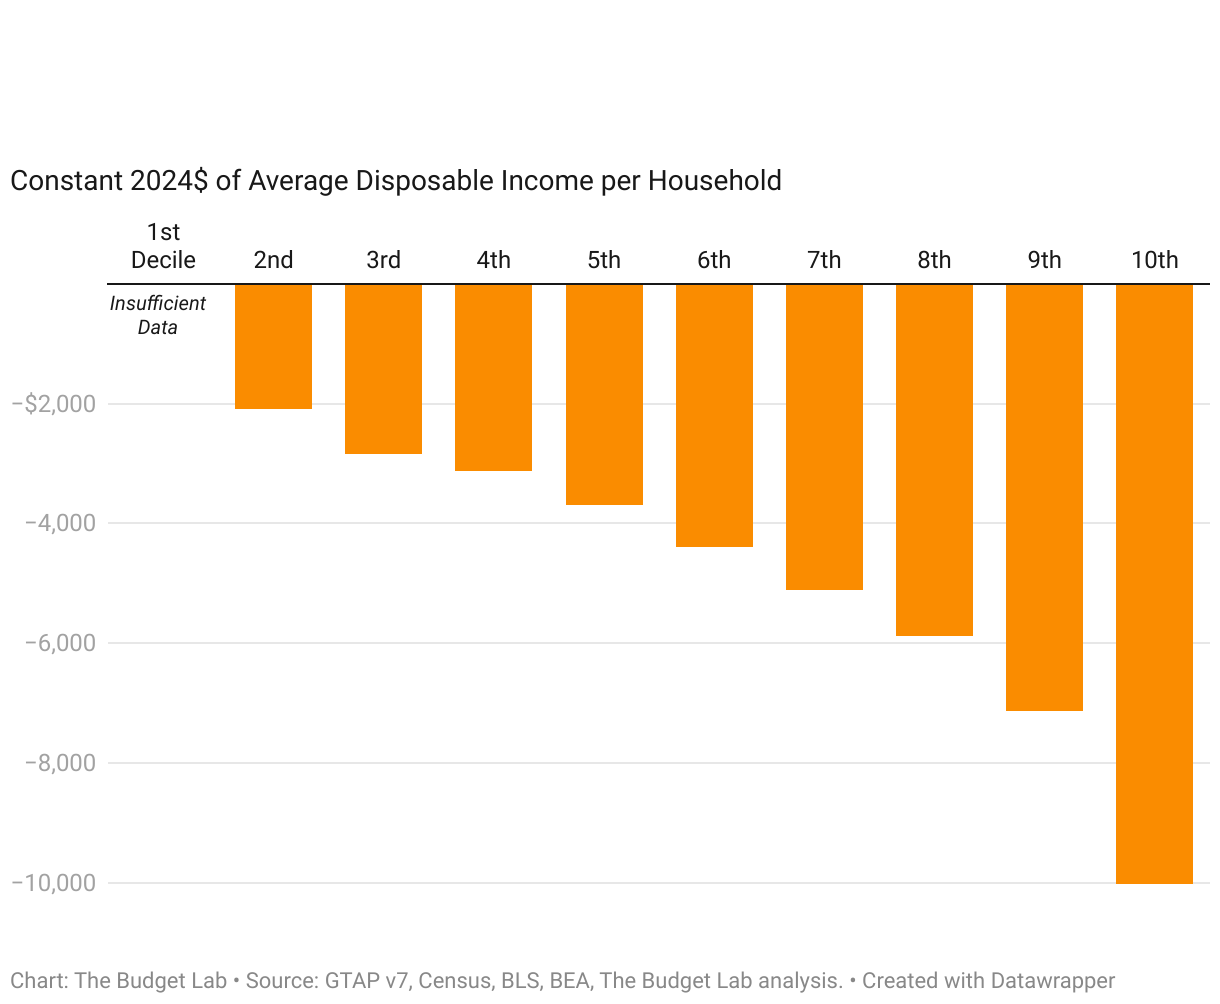
Short-run distributional impact
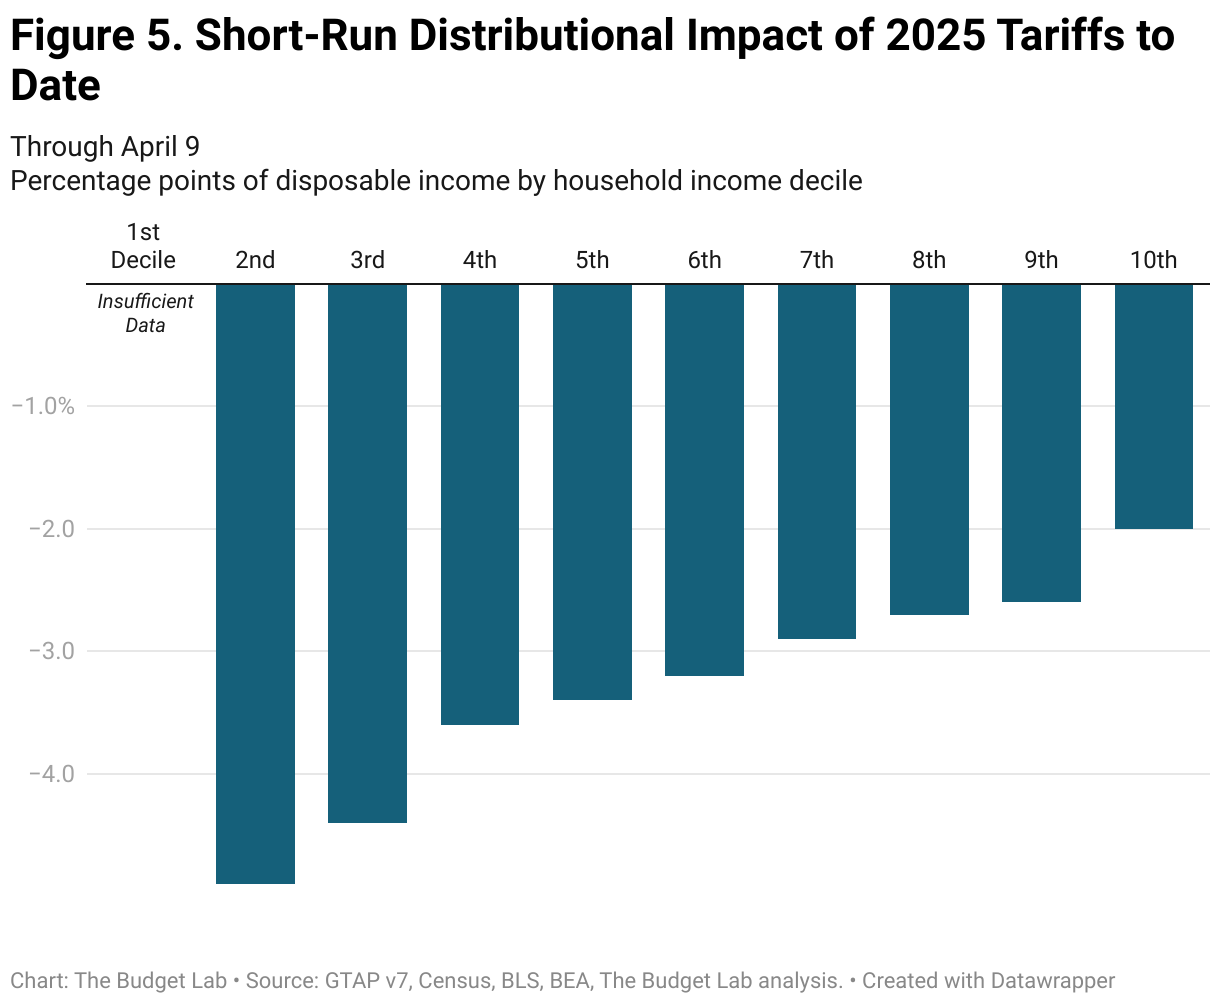
Tariffs are a regressive tax, especially in the short-run. This means that tariffs burden households at the bottom of the income ladder more than those at the top as a share of income. The regressivity is about the same when looking at all 2025 tariffs: the burden on the 2nd decile is 2.5x that of the top decile (-4.9% versus -2.0%). The average annual cost to households in the 2nd, 5th, and top decile rise to $2,100; $3,700; and $10,000 respectively.
Tariffs are more distributionally-ambiguous in the longer-run. Tariffs reduce both labor income and above-normal returns to capital, or rents. We assume that owners of capital hold rents rather than consume them in the short-run, but do consume them over their lifecycle in the long-run. The implication is that the tariff burden is more regressive in the short-run and more evenly-distributed across households in the long-run
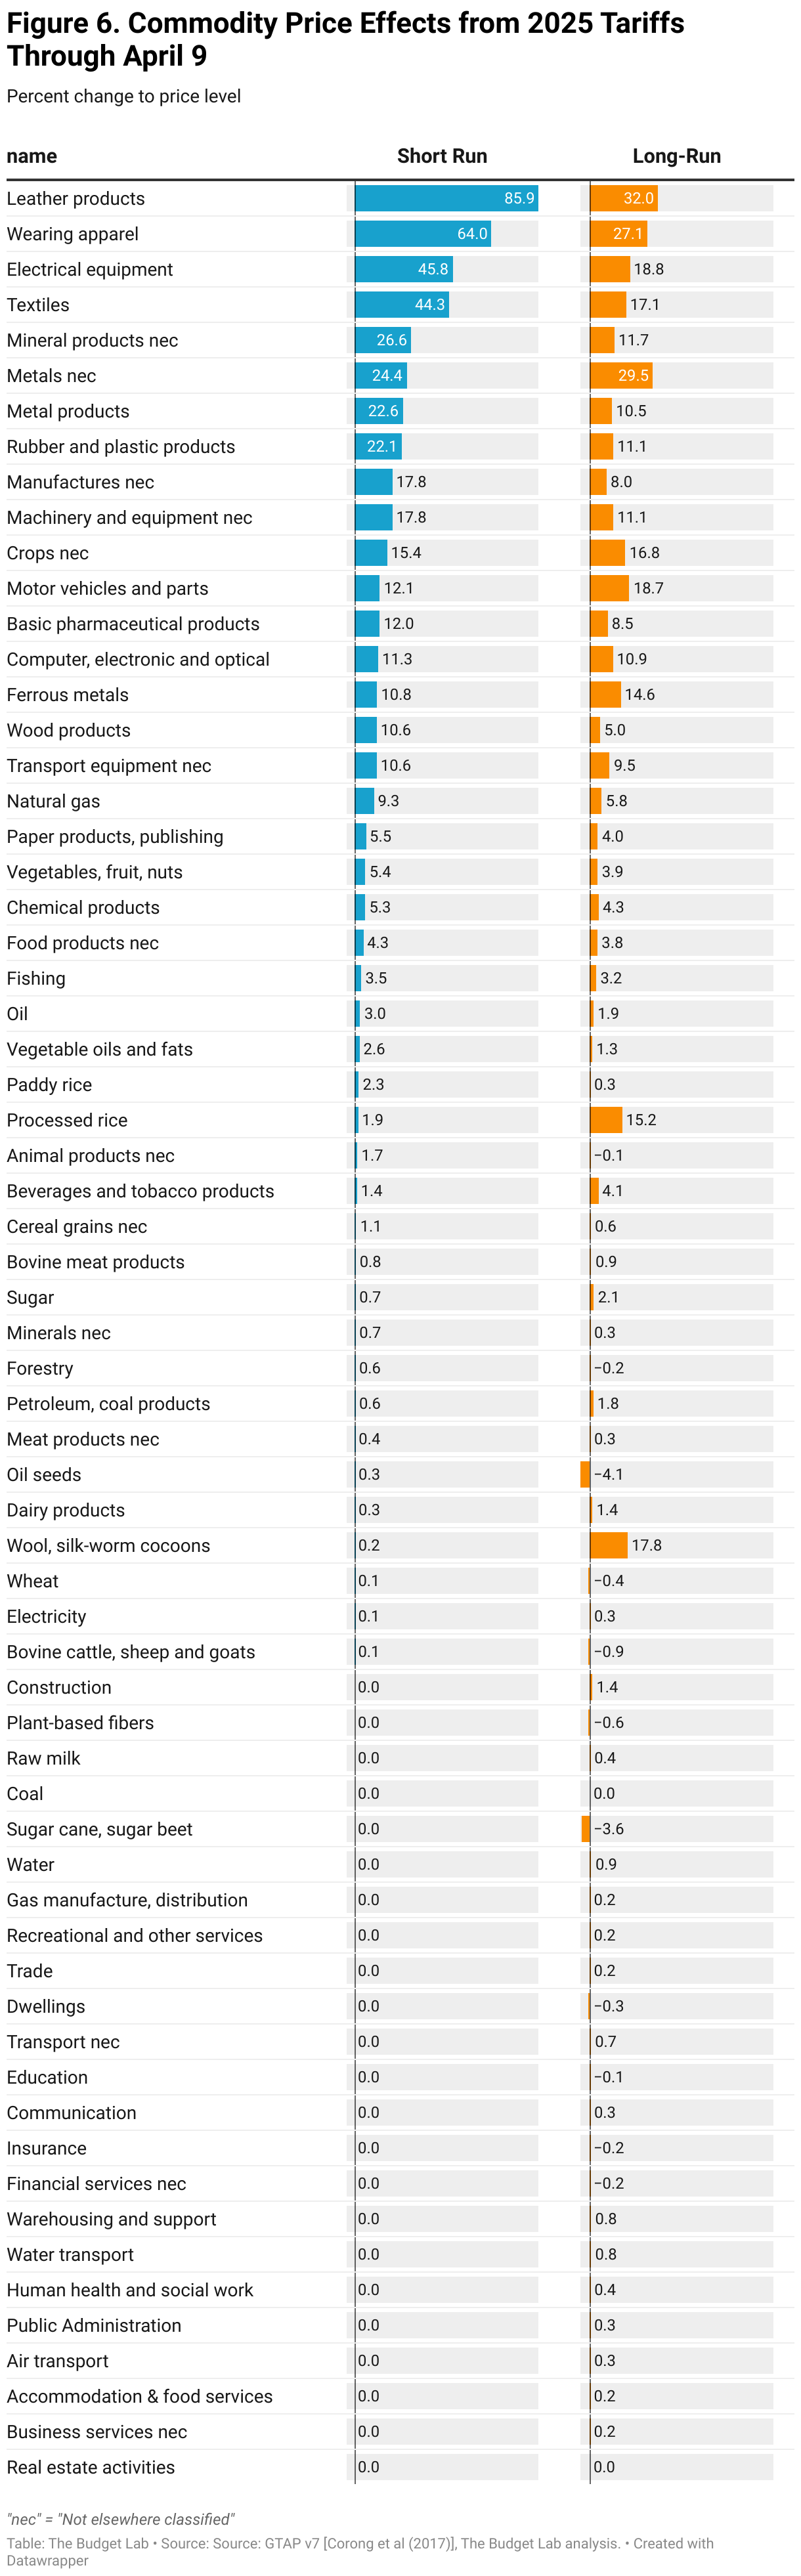
Commodity price effects
The charts below show how the 2.9% price level increase from the 2025 tariffs to date would look across individual commodities in the short-run (pre-substitution), as well as the 1.7% long-run price increase (post-substitution). Some high level takeaways:
- Consumers face high increases in clothing and textile prices in the short-run: prices increase 64% for apparel and 44% for textiles. After substituting towards cheaper alternatives in the long-run, prices remain 27% and 17% higher, respectively.
- Food prices rise 2.6% in the short-run and stay 3% higher in the long-run. Fresh produce is initially 5.4% more expensive while stabilizing at 3.9% higher.
- Motor vehicle prices rise 12% in the short-run and 19% in the long-run, the latter the equivalent of an additional $9,000 to the price of an average 2024 new car.
Footnotes
- TBL assumes throughout its tariff analysis that the transition to longer-run GTAP equilibria occurs after three years.
- TBL employs a “relaxed conventional” assumption for the retaliation scenario, whereby foreign income is permitted to fall but US income remains fixed.