
The Fiscal, Economic, and Distributional Effects of Automobile, Semiconductor, and Pharmaceutical Tariffs
Key Takeaways
-
The Budget Lab modeled a 25% tariff on all automotive, pharmaceutical, and semiconductor imports.
-
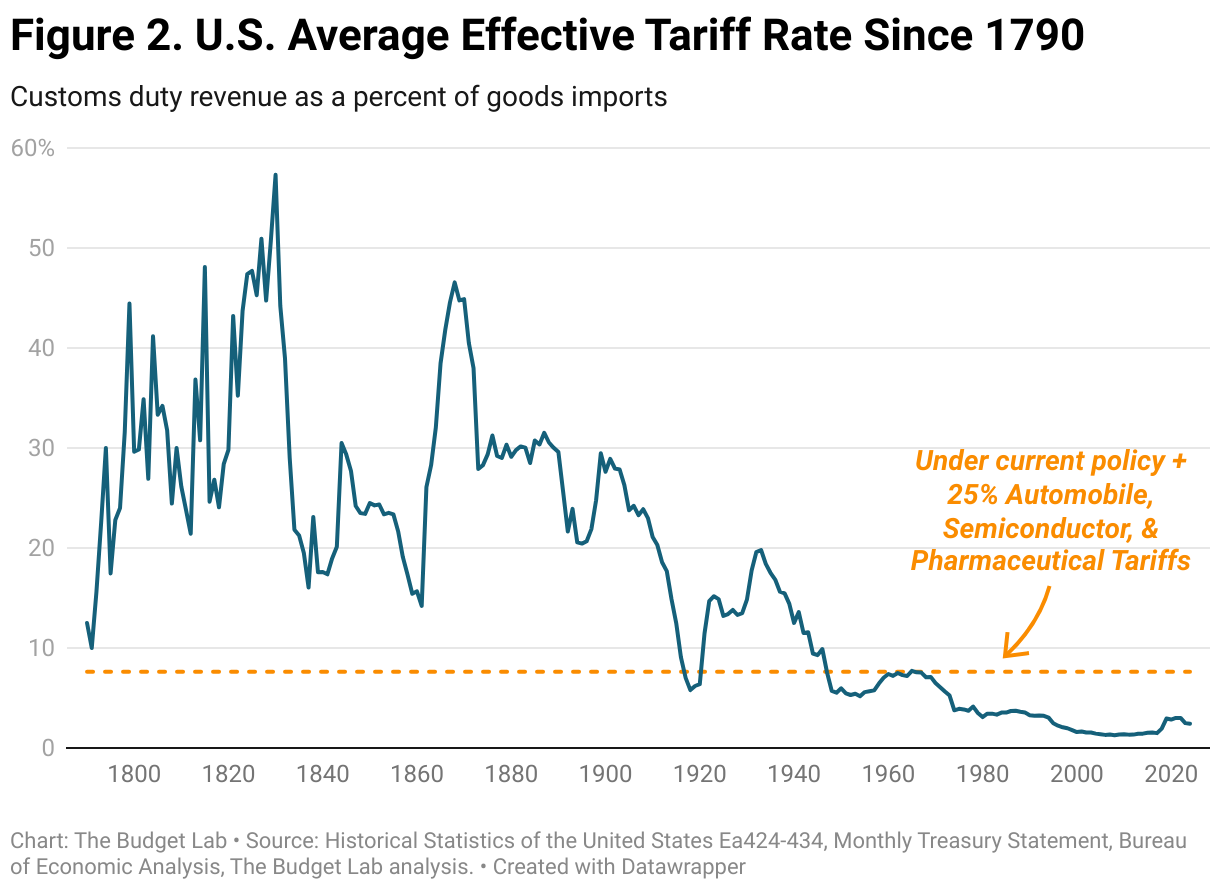
The policy is the equivalent of a 5.2 percentage point hike in the overall US effective tariff rate, raising it to the highest since 1965.
-
The average price level rises by 0.5-0.6% pre-substitution, the equivalent of an average per household consumer loss of $900-1,100 in 2024$.
-
Average automobile and pharmaceutical prices would rise 8.5-10.5%, accounting for the tariffs themselves, potential dollar appreciation, and domestic price hikes.
-
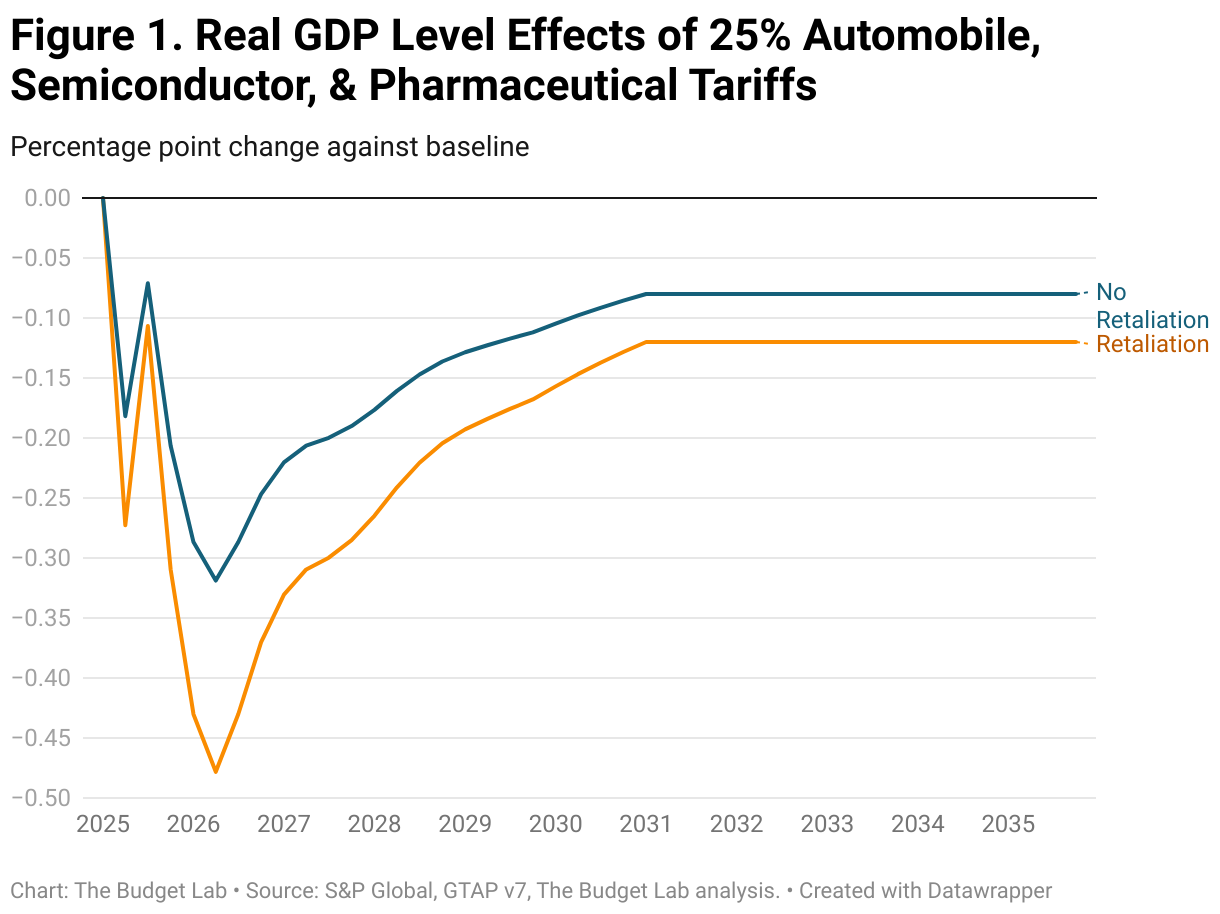
Real GDP growth over 2025 is 0.2-0.3 percentage point lower.
-
In the long-run, the US economy is persistently 0.1% smaller, the equivalent of a $20-30 billion permanent annual reduction in real GDP in 2024 dollars.
-
The illustrative proposal raises $900-1,100 billion over 2026-35 conventionally-scored, and $110-170 billion less if dynamic revenue effects are taken into account.
-
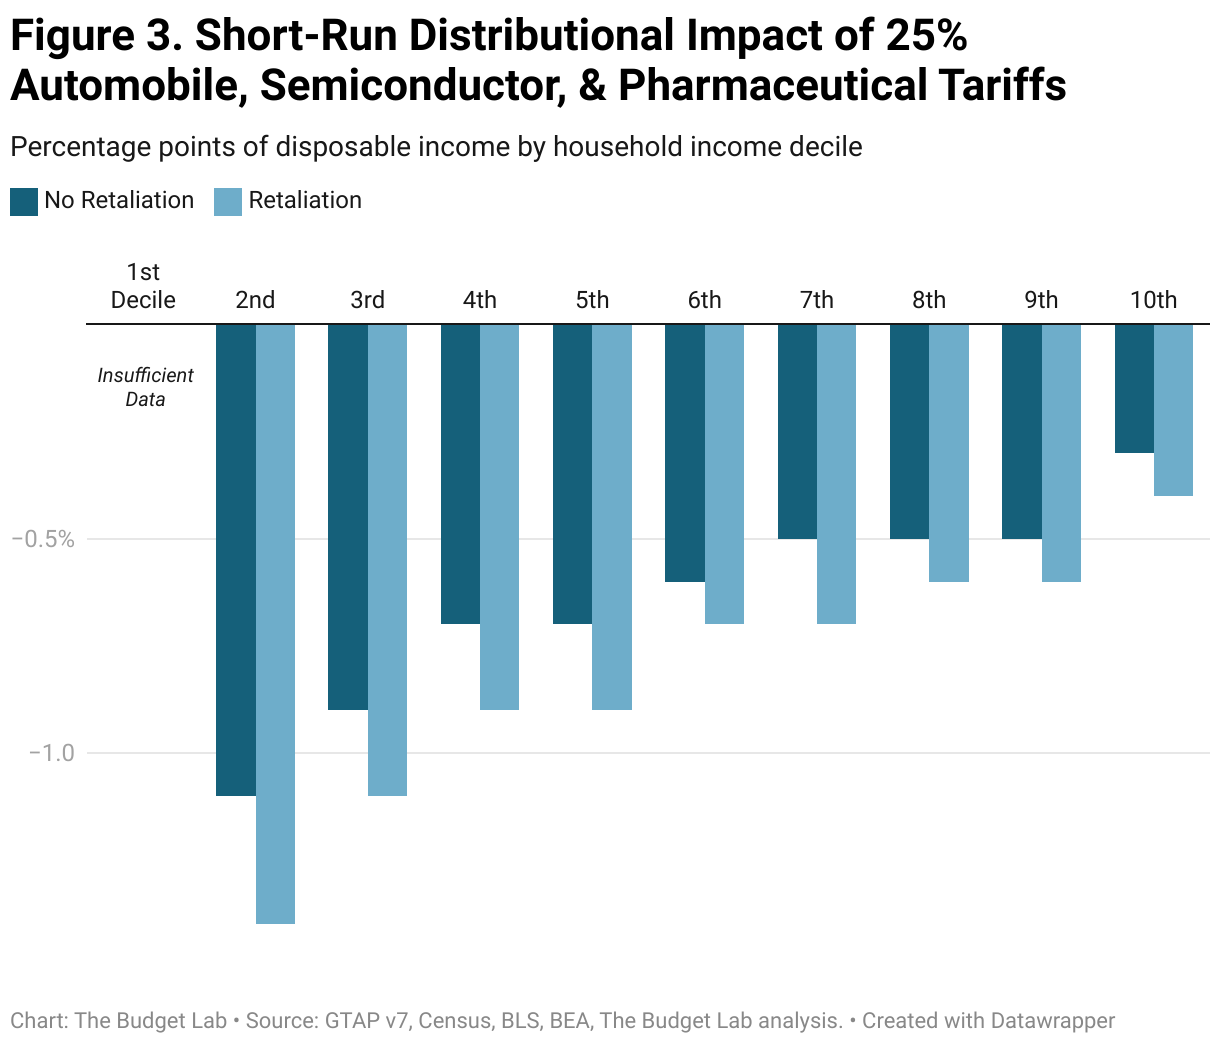
Tariffs are regressive taxes. Losses for households at the bottom of the income distribution would range between $470-590. As a share of income, the impact at the bottom is 3x that at the top.
Introduction
On February 18, the Trump Administration announced plans to levy tariffs on automobile, semiconductor, and pharmaceutical imports into the United States “in the neighborhood of 25%”. He indicated April 2 as the likely date of an announcement. The Budget Lab (TBL) modeled the fiscal and economic effects of the package.1 Under TBL’s standard methodology, we model two variations: one without any retaliation from other countries, and one with tit-for-tat commodity-by-commodity retaliation by the full tariff amount. TBL followed broadly the same methodology as its prior tariff analyses; the methodology is briefly summarized in the appendix.
Results
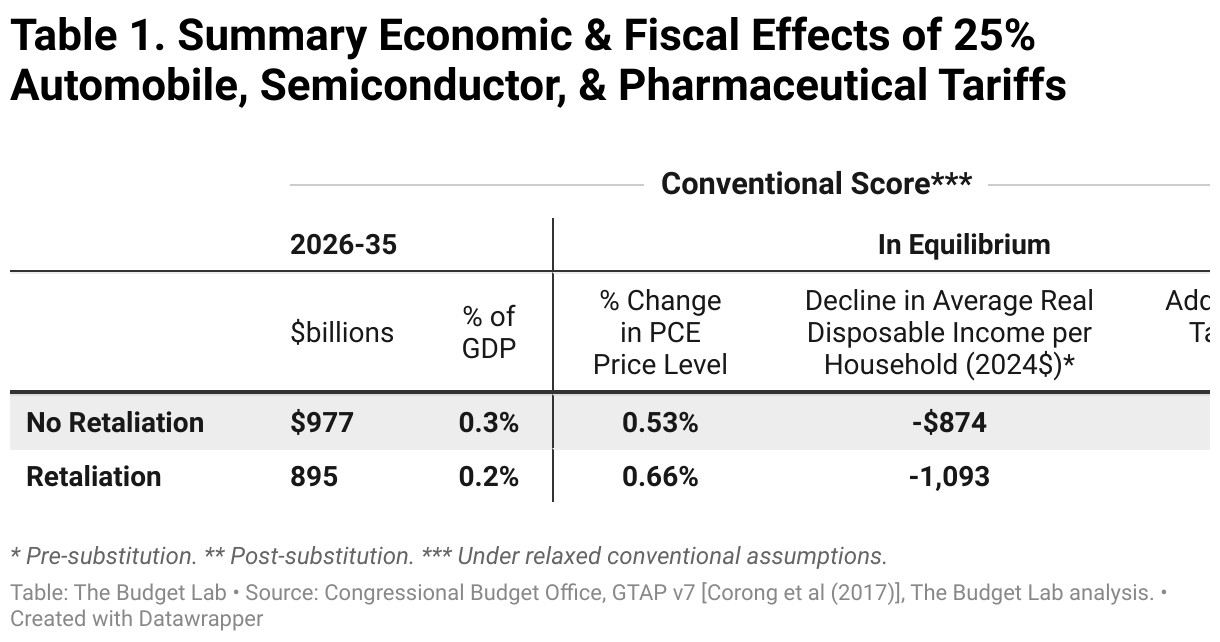
The table below summarizes TBL’s fiscal and economic results.
Aggregate price impact
Under the policy, PCE prices rise by 0.5% in the short-term if other countries do not retaliate and by 0.7% if they do, assuming the Federal Reserve does not respond (in either direction) to the tariffs’ economic effects. This is equivalent to an annual consumer loss of $900-$1,100 per household on average in 2024 dollars. These are short-run, pre-substitution effects—before consumers make the difficult choices about how to shift spending habits—which is the best way to measure the effect on consumer welfare. Post-substitution, the effect on prices settles somewhat to 0.4-0.5%, a $600 -$700 average consumer loss per household.
Commodity price effects
All told, both automobile and pharmaceutical prices rise 8.5% on average without retaliation and 10.5% with retaliation (the difference is primarily due to TBL’s assumption that without retaliation, the dollar appreciates to offset some of the tariff’s cost). Since semiconductors are only a subset of computers and electronics, categorically that commodity group’s average price increase is far less: 1.2% without retaliation and 1.5% with.
Output effects
The proposal reduces the short- and long-run level of US real GDP. In calendar year 2025, real GDP growth is 0.2 percentage point lower without retaliation and 0.3 percentage point with. In the long-run, US output is still -0.8 to -0.12% lower without retaliation and almost twice as much with. That’s the equivalent of the US economy being permanently smaller by $23-$35 billion annually in 2024 dollars.
Fiscal impact
The illustrative proposal is the equivalent of a rise in the average effective tariff rate of 5.2 percentage points, bringing it to its highest level since 1965 (see chart below). Were it to remain in place, the policy would raise $980 billion over 2026-35 conventionally-scored without retaliation (0.3% of GDP on average over 10 years), and $900 billion with retaliation (0.2% of GDP).2
Given the negative output effects of the illustrative policy, there would be additional dynamic reductions in tax revenue as a result. Based on Congressional Budget Office rules-of-thumb, TBL estimates that these effects would range between $110 billion without retaliation to $170 billion with.
Short-run distributional impact
Tariffs are a regressive tax, especially in the short-run. This means that tariffs in general burden households at the bottom of the income ladder more than those at the top as a share of income. These tariffs will also burden households who spend a greater share of their budgets on autos and out-of-pocket pharmaceutical expenses, as well as any electronics downstream from imported semiconductors. In this case, the percent change in disposable income resulting from the tariffs is roughly 3x as much for households in the second decile by income as it is for households in the top decile— -1.4% versus -0.4% in the case of tariffs with retaliation (see top panel of chart below).
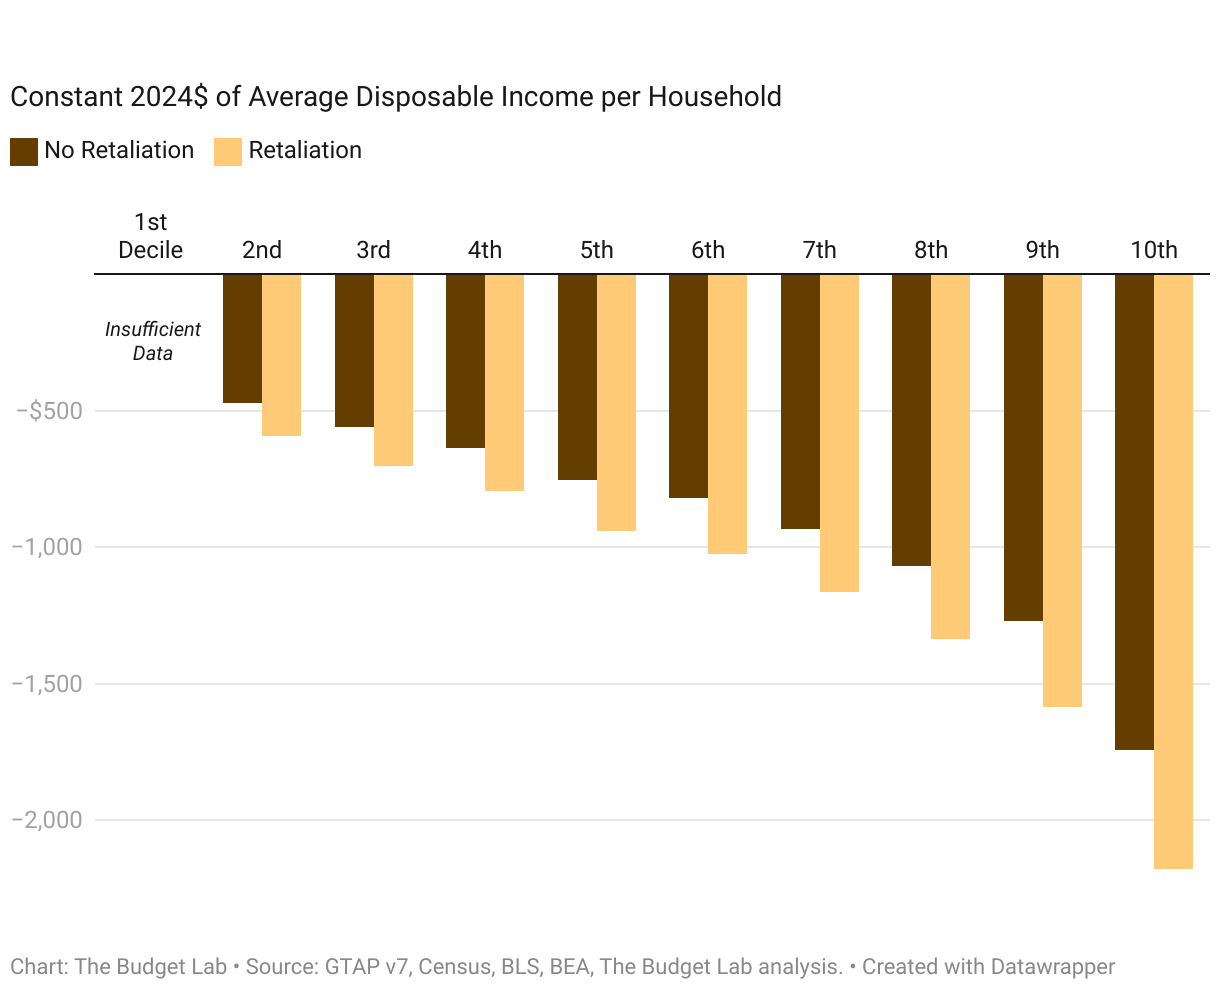
Because income rises across the distribution more steeply than the tariff burden falls, the tariff burden in dollar terms is higher at higher incomes (bottom panel). For a household in the second lowest income decile, the tariff proposal leads to consumer loss of roughly $600 per household on average when countries retaliate. For households in the middle, the burden rises to about $940 per household on average, and for those in the top tenth, it averages $2,200 per household.
Tariffs are more distributionally-ambiguous in the longer-run. Tariffs reduce both labor income and above-normal returns to capital, or rents. We assume that owners of capital hold rents rather than consume them in the short-run but consume them over their lifecycle in the long-run. The implication is that the tariff burden is more regressive in the short-run and more evenly distributed across households in the long-run.
Footnotes
- TBL assumed that the automobile tariffs applied to all motor vehicles and parts.
- TBL employs a “relaxed conventional” assumption for the retaliation scenario, whereby foreign income is permitted to fall but US income remains fixed.