
The Revenue and Distributional Effects of IRS Funding
Tables 2 and 3 have been updated from initial publication to add add additional estimates.
Introduction
There is substantial focus in Washington policy debates on cutting government spending in the putative pursuit of fiscal sustainability. However, when spending is discussed, it is imperative to think both about the direct costs of the government spending (taxpayer dollars that support different agency missions) and the benefits that society reaps from that spending.
A timely example of the importance of looking at both sides of the government’s ledger is investment in the Internal Revenue Service (IRS), which has been a recent focus. The IRS is responsible for collecting 96% of federal revenue.1 In the last Administration, the agency received a significant influx of funding from the Inflation Reduction Act, which was geared toward modernization and improved compliance and service efforts. Some of those funds have been rescinded, and so far in this Administration, there have been further efforts to decrease the IRS’s footprint by cuts to its workforce.
The Budget Lab estimates that the expansion of funding ($80 billion) for the IRS in the Inflation Reduction Act (IRA) would have led to a net revenue increase of $637 billion over the full 10-year budget window.2 If the IRS shrinks by 50% (a workforce decrease of about 50,000 people),3 we estimate that this significant reduction in IRS staffing and resulting IRS capacity to collect revenues would result in $395 billion ($350 billion net) forgone revenue over the 10-year budget window.4 If the lack of IRS resources leads to a substantial increase in noncompliance, net forgone revenue could rise by $2.4 trillion over 10-years.
Revenue returns to funding the IRS are significant
Additional revenue for the IRS generally generates more revenue than it costs through improved enforcement, particularly focusing on high-income individuals and corporations. The additional funding increases revenue by increasing the efficiency of the service and helping to close the "tax gap” - the difference between taxes legally owed and taxes collected, which currently totals around $700 billion per year.
The revenue increase depends on when those additional funds are spent, what they are spent on, and the return to those investments. Our estimate utilizes the pattern of spending assumed by CBO and the allocation of funds to activities outlined in the IRA.5 The return to investment we use comes from several sources. We rely on Holtzblatt and McGuire (2016), CBO, Boning et al (2020), Sarin and Summers (2020) and Debacker et al (2018) for our return to investments estimates (ROI).6 The ROI varies from 2:1 for service and IT to 7.1:1 for audits.7
Our base estimate also includes an indirect benefit through deterrence. When taxpayers know there's a higher chance of audit, voluntary compliance tends to improve. Economists estimate these indirect effects could multiply the revenue impact by 2-3 times.8 We use the midpoint of 2.5. The main constraint on returns isn't the lack of recoverable taxes, but rather the IRS's capacity to conduct thorough audits, even with significantly increased resources. With lower resources, collections will suffer.
Returns to IRS funding are not evenly distributed
Not all categories of taxable income afford the same evasion opportunities. For certain categories of income—like wages and salaries—compliance is essentially 100 percent, because taxes are automatically withheld. For the most opaque categories of income—like proprietorship and rental income—where the IRS has little information available from third party reporting to cross-check the veracity of tax filings, misreporting rates exceeds 50 percent.9
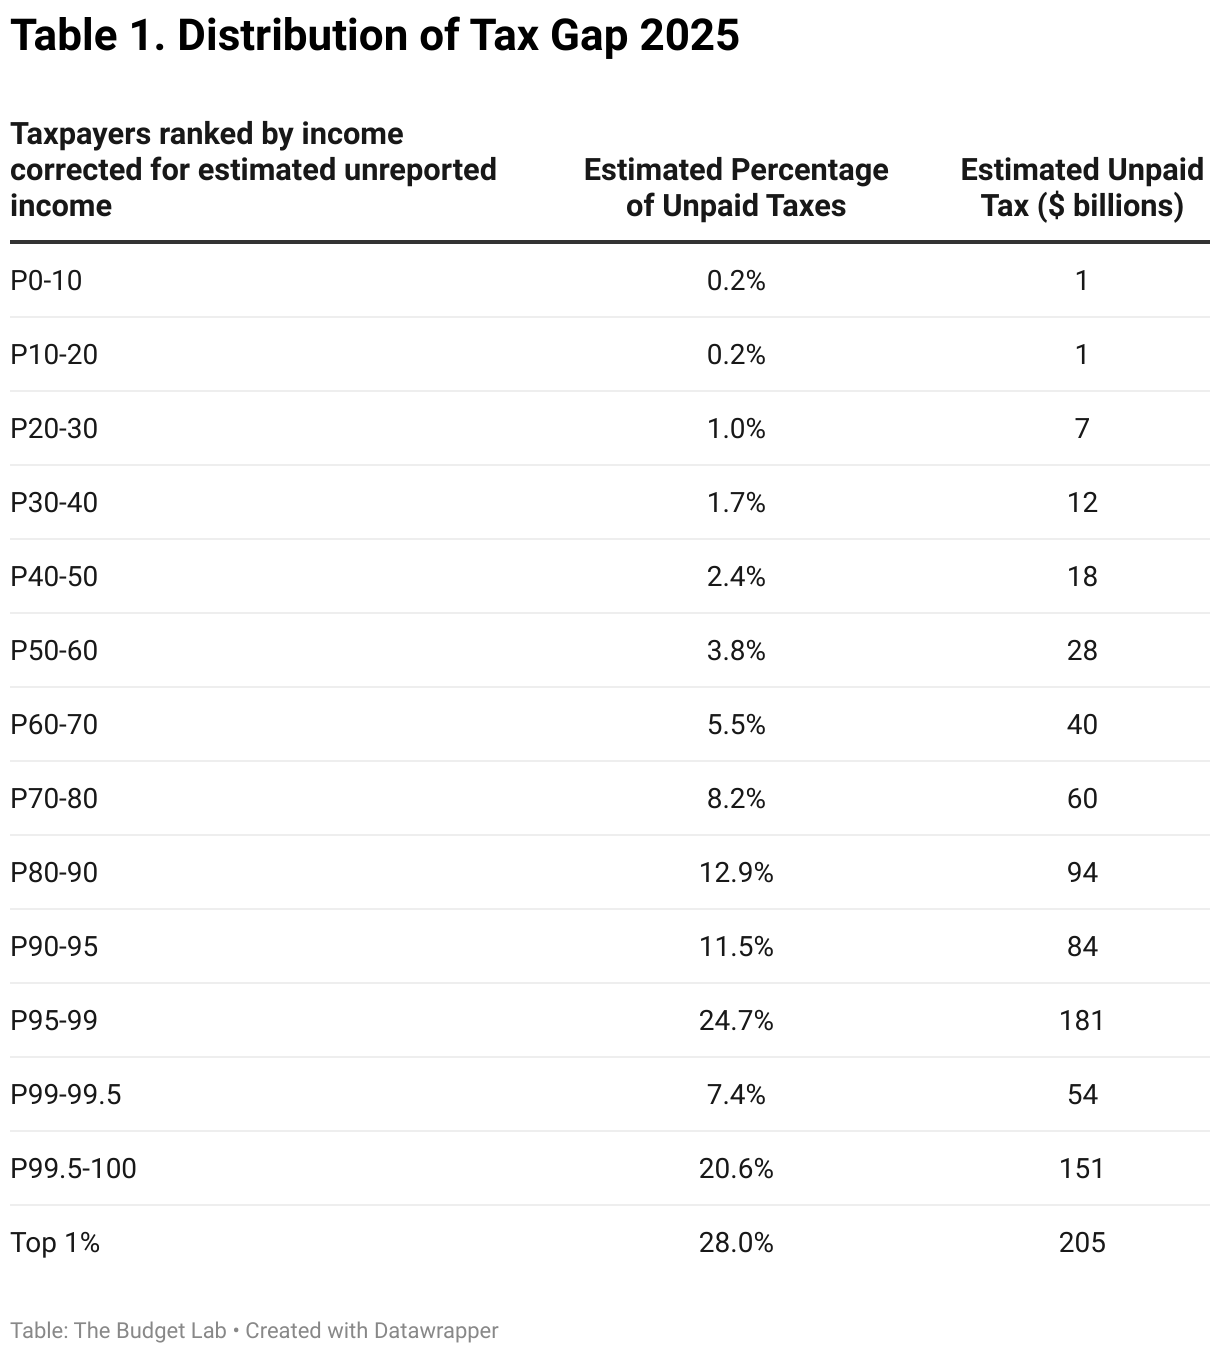
Noncompliance is also not evenly distributed across the income distribution. Because the highest earners have the largest tax obligations and tend to accrue income in more opaque ways, their rates of noncompliance are higher. One paper estimates that the top 1% of earners are responsible for nearly 30% of unpaid taxes – according to Budget Lab calculations (Table 1 below) and projection of the latest tax gap numbers that would total about $205 billion annually. The bottom two quintiles are responsible for just over 20 billion annually (less than 5%).10
Reductions in IRS workforce are costly
Since the provision of a stream of mandatory funding to the IRS in the Inflation Reduction Act, critics of increased enforcement efforts have pushed to rescind these new funds. Most recently, the Trump Administration has pursued a strategy of dramatic “reductions in force” (RIF) at the IRS.
These reductions in force would save the government resources in that the budget of the agency could shrink if it needed to fund fewer employees. However, these reductions would come with dramatic increases in noncompliance which would outstrip any budgetary savings several times over.
We consider two different RIFs:11
- First, as of February 20, 2025, the IRS has announced around 7,000 layoffs, more than 5,000 of whom reportedly worked in compliance efforts.12
- Second, last week, reports suggested that the Trump Administration was pushing to slash the IRS workforce in half. We assume that these cuts come from across the agency’s functions and are on top of the initial reduction in force, such that if these changes are implemented, the IRS workforce will total around 50,000, down from around 100,000 in January.
Table 2 reports our estimates. We conclude that the aggregate effect of these two RIFs would decrease gross tax collections by about $395 billion over the course of the next decade, which includes a rough estimate of the delays to technology improvements and enhancements that would be the consequence of halving the agency’s workforce. When we account for the fact that salary costs at the IRS will fall as a result of this workforce reduction, we conclude that the cost of cutting the workforce by 50% would be about $350 billion net in lower revenues over the course of the budget window and around $560 billion net in the second decade.13
Behavioral estimates are always uncertain, here even more so
It is generally understood that tax enforcement efforts have direct and indirect effects. Direct effects are direct: more dollars spent on audits means more revenue is collected for the fisc from taxpayers who are audited. Indirect effects have two variants: specific deterrence (a taxpayer who is audited and found to have misstated taxes owed is more careful in the future) and group deterrence (a taxpayer who sees others audited is more careful in filing her own returns).
There are a wide range of estimates of deterrent effects, as Sarin and Mazur (2024) detail. These studies tend to be based on marginal changes, for example Boning et al (2020) use a field experiment to examine the effect of an IRS audit on a tax preparer’s other client’s returns. The authors find that this network deterrence effect raises 1.2 times the revenue of the direct audit. And Boning et al (2023) find a return of $12 for each dollar spent on audits of high-income individuals and a return of $5 for every dollar spent on audits of below median income individuals.
However, the literature has not explored how a change in spending on audits as large as the ones this Administration has proposed would impact revenue collection.14
It is massively difficult to extrapolate from these estimates to understand what such a sizable RIF would do to taxpayer behavior. Returning the IRS to a 1960s-level workforce in an environment when tax entities have become much more complex and its capacity is already so depleted could potentially meaningfully shift taxpayer behavior, more so than our midpoint deterrence estimate assumes.
To try and guess how taxpayer behavior could adjust, we offer a back-of-the-envelope calculation for illustrative purposes. Here, we rely on the IRS’s tax gap estimates, which document the substantial difference in compliance rates between categories of individual income depending on the nature of third-party reporting that helps the IRS cross-check the veracity of tax filings. Categories of income without any third-party reporting are highly likely to be misreported, as discussed above. Figure 1 is taken from the most recent IRS Tax Gap report and is the basis for this calculation.
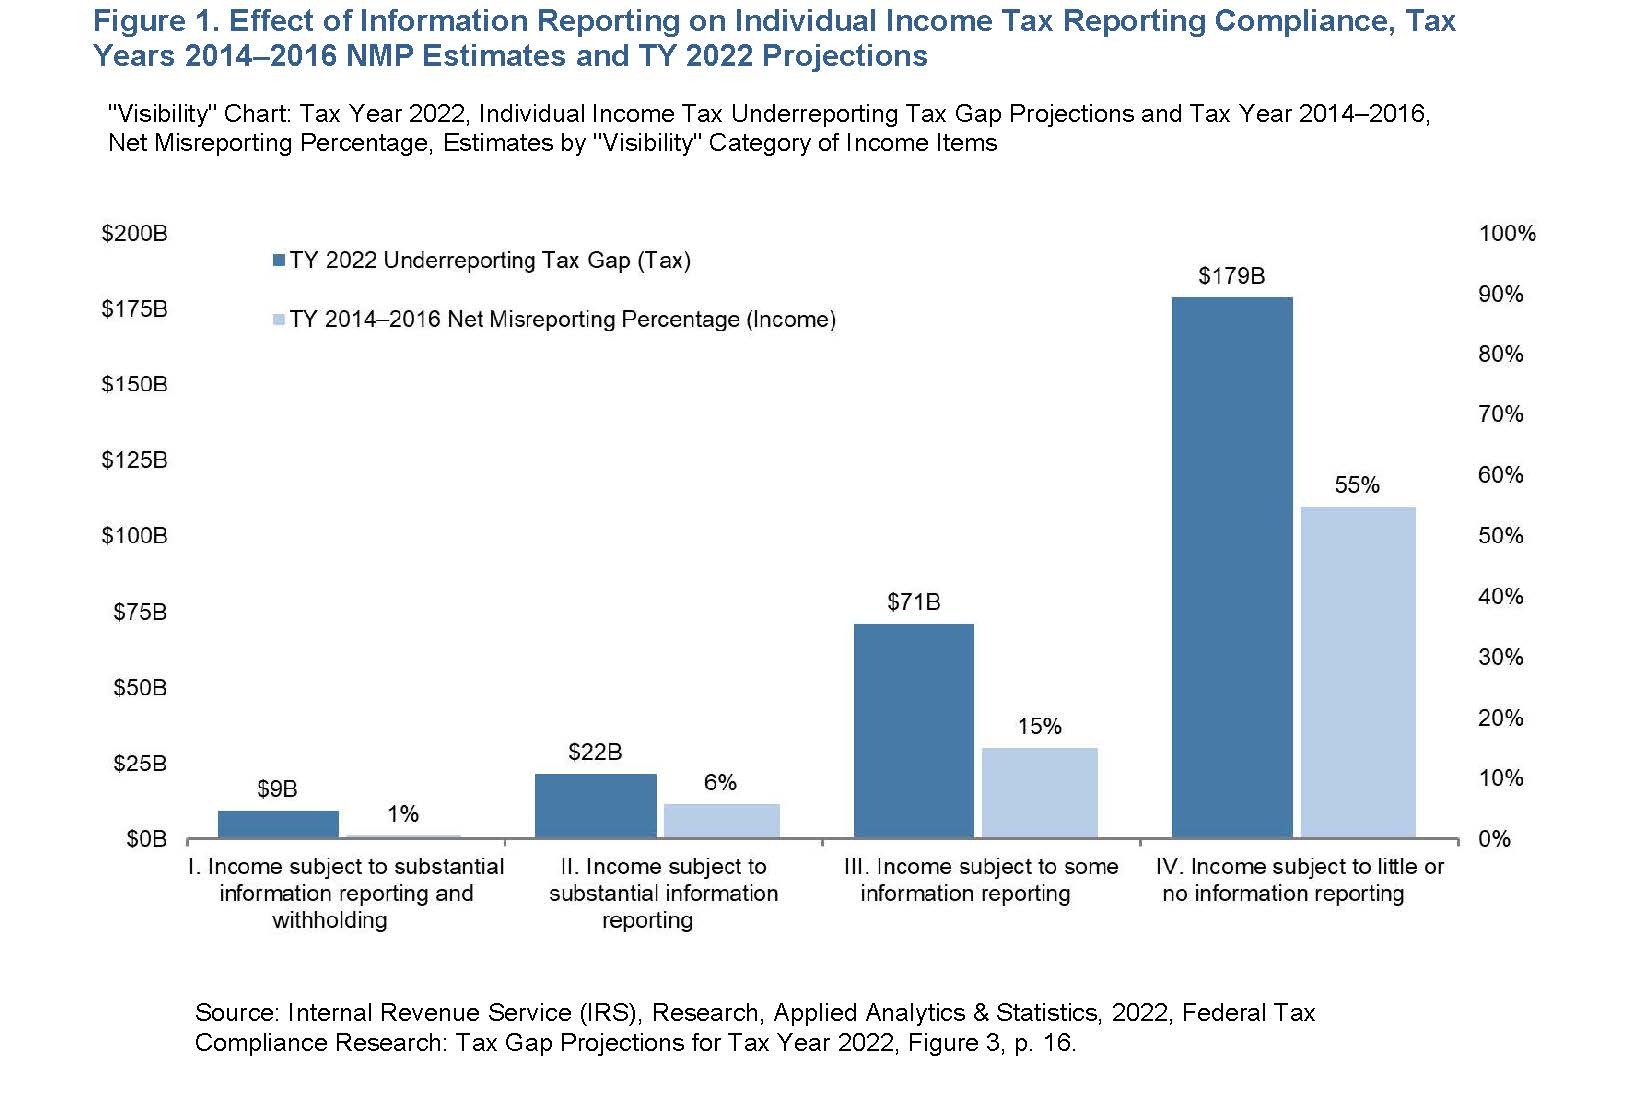
If we assume that taxpayer behavior adjusts such that low-compliance taxpayers become somewhat lower compliance, medium-compliance taxpayers become low-compliance taxpayers, etc., we arrive at a much larger impact of the RIF on compliance.15
Specifically, a 50% cut of the agency workforce would cost $2.4 trillion over the course of the decade, and it would result in around a 25% increase in the tax gap over this period. Note that this adjustment is in some sense also understated because it assumes that the only category of income where taxpayer behavior adjusts is individual misreported income (where the tax gap breaks out income types by compliance rates), whereas other categories of the tax gap, like corporate income and non-filing, are assumed to stay fixed in the new world with a substantially diminished IRS.
Conclusion
These cost estimates are of course highly uncertain, partly because our calculations are relying on contemporary reporting of what is happening at the IRS. In addition, there is no modern historical precedent for this level of cuts to IRS staffing: It is unclear how the IRS would be able to actually function given the scale of what has been reported. Our estimates are thus meant to reflect reasonable behavioral reactions to a hollowed-out IRS and to what this substantial hit to IRS functionality could potentially mean for revenue.
Footnotes
- IRS 2023 Data Book.
- The Congressional Budget Office (CBO) estimated just over $200 billion in additional revenue.
- This is based on recent IRS staffing of 100,000 and assuming 50 percent layoffs.
- For additional context, our model suggests that the $20 billion rescission in IRS funding in a recent government funding bill is estimated to result in $180 billion in net forgone revenue over the next five years.
- See IRS-Related Funding in the Inflation Reduction Act by Congressional Research Service.
- Janet Holtzblatt and Jamie McGuire, “Factors Affecting Revenue Estimates of Tax Compliance Proposals,” CBO Working Paper 2016-05, JCX-90-16, November 2016.Jason DeBacker, Bradley T. Heim, Anh Tran, and Alexander Yuskavag, “Once Bitten, Twice Shy? The Lasting Impact of Enforcement on Tax Compliance,” 61 J. Law & Econ. 1 (2018). William C. Boning, John Guyton “Heard It Through the Grapevine: The Direct and Network Effects of a Tax Enforcement Field Experiment on Firms,” 190 J. Pub. Econ., article 104261 (2020). How Changes in Funding for the IRS Affect Revenues, Congressional Budget Office, February 2024.
- Boning et al find a 12 to 1 return. Boning, William C and Hendren, Nathaniel and Sprung-Keyser, Ben and Stuart, Ellen, "A Welfare Analysis of Tax Audits Across the Income Distribution", National Bureau of Economic Research, Working Paper, 31376, 2023, June. Sarin, Natasha and Summers, Lawrence H., "Understanding the Revenue Potential of Tax Compliance Investment" (2020). All Faculty Scholarship. 2217.
- See Jason DeBacker, Bradley T. Heim, Anh Tran, and Alexander Yuskavage, “Once Bitten, Twice Shy? The Lasting Impact of Enforcement on Tax Compliance,” 61 J. Law & Econ. 1 (2018), William C. Boning, John Guyton “Heard It Through the Grapevine: The Direct and Network Effects of a Tax Enforcement Field Experiment on Firms,” 190 J. Pub. Econ., article 104261 (2020). and Internal Revenue Service. 2019. “Program Summary by Budget Activity
- See Figure 3 in the IRS Federal Tax Compliance Research: Tax Gap Projection for Tax Year 2022. It is reproduced as Figure 1 below.
- See Debacker, Jason, Bradley Heim, Anh Tran, and Alex Yuskavage, “Tax Noncompliance and Measures of Income Inequality,” Tax Notes,166(7), February 2020, pp. 1103-1118.
- For the purposes of illustration, we assume that these cuts would come from across the agency’s functionalities. We distribute the cuts proportionally across the agency’s activities. We naively assume the same distribution of employees across GS-levels as for the smaller RIF: 25,000 of these layoffs are for employees earning between $42,679 (GS level 7 step 1) and $74,733 (GS level 10 Step 10) and about the remaining 25,000 layoffs are employees earning between $57,396 and $117,034. The IRS announced that hiring under the IRA would include a number of individuals at a mid-career level approximately equal to a GS-13 level ($117,034). Our estimate of the savings on salaries is potentially low. These salaries are assumed to grow at the rate of GDP growth and the reduction continues beyond the budget window.
- While details about laid off employees are not known, we assume that 5,000 of these layoffs are for employees earning between $42,679 (GS level 7 Step1) and $74,733 (GS level 10 Step 10) and about the remaining 2,000 layoffs are employees earning between $63,163 (GS level 11 Step 1) and $117,034 (GS 13 Step 10). These salaries are assumed to grow at the rate of GDP growth and the reduction continues beyond the budget window. For each of the two groups we use an average salary in the GS range. For the first group, the salary is $57,396 and $87,743 for the second group. This reduction in funding for revenue agents and auditors leads to forgone net revenue of about $64 billion over the budget window.
- The initial 7,000 layoffs are assumed to be mostly (70%) in enforcement and collections capacity. These functions have larger ROI than other IRS functions. Of the remaining 43,000 layoffs, only 42% are assumed to be in this capacity. Therefore, the layoffs do not scale linearly in our estimates.
- Sarin, Natasha and Mark Mazur. “The Inflation Reduction Act’s Impact on Tax Compliance and Fiscal Sustainability,” Tax Notes Fe. 19, 2024. Boning, William C. and John Guyton, Ronald Hodge, Joel Slemrod, “Heard it through the grapevine: The direct and network effects of a tax enforcement field experiment on firms,” Journal of Public Economics, Volume 190, 2020, 104261. Boning, William C and Hendren, Nathaniel and Sprung-Keyser, Ben and Stuart, Ellen, "A Welfare Analysis of Tax Audits Across the Income Distribution", National Bureau of Economic Research, Working Paper, 31376, 2023, June.
- We assume different behavioral changes for each group of taxpayers defined by reporting requirements. For the group with the highest reporting requirements, we leave their misreporting as unchanged at 1%. For the group with substantial reporting (but no withholding) we adjust their misreporting from 6% to 15%. The next group that has “some” reporting, we move them from 15% misreporting to 55% misreporting. For the group with the lowest amount of reporting, we move them from 55% to 65% misreporting. Essentially, we assume that each group acts like the group with less reporting than their group.