
Illustrative Distributional Effects of Policies Consistent with the House Concurrent Budget Resolution for Fiscal Year 2025
On February 25, 2025, the House of Representatives passed its Concurrent Budget Resolution for Fiscal Year 2025 (H. Con. Res. 14), which lays out topline spending and revenue goals for the Federal budget between Fiscal Year (FY) 2025 and FY2034.
The Resolution contains reconciliation instructions for various House committees to recommend policy changes for programs under their respective jurisdictions in order to meet specific targets for either deficit reduction or expansion over the ten-year budget window. (The Senate is moving forward with a similar resolution, after which the two chambers will need to find agreement before following any reconciliation instructions.) Together, the House committee instructions total $1.5 trillion in gross spending cuts and $4.5 trillion in revenue reductions over the budget window. The Resolution also contains provisions for an additional $500 billion in unspecified deficit reduction.
Three committees tasked with some of the largest changes to the Federal deficit in the Resolution are:
- The Committee on Agriculture, which oversees Federal farm programs and the Supplemental Nutrition Assistance Program (SNAP, also known as food stamps), which is instructed to propose deficit-reducing changes of at least $230 billion over ten years;
- The Committee on Energy and Commerce, whose Subcommittee on Health oversees significant portions of Medicare and all of Medicaid, which is instructed to propose deficit-reducing changes of at least $880 billion over ten years; and
- The Committee on Ways and Means, the House’s chief tax-writing committee, which is instructed to propose changes that would increase the deficit by no more than $4.5 trillion over ten years.
While the Budget Resolution does not specify precisely how each of these three committees is to meet its targets, reporting on internal discussions among House members has highlighted (among other proposals) changes to SNAP, changes to Medicaid, and renewal of expiring provisions of the Tax Cuts and Jobs Act of 2017 (TCJA) as key elements for policymakers to consider.
To illustrate how the Budget Resolution could affect the distribution of after-tax-and-transfer income, The Budget Lab analyzed the effects of four policies consistent with the text of the Resolution as passed by the House on February 25. Two of these policies represent changes to Federal spending over the FY2026-FY2034 period:1
- An across-the-board reduction of 30 percent in Federal spending on SNAP; and
- An across-the-board reduction of 15 percent in Federal spending on Medicaid.
The remaining two represent changes to Federal tax policy:
- Permanently extending the individual and estate tax provisions of the TCJA that are set to expire at the end of 2025; and
- Permanently extending three business tax provisions that have recently expired or are phasing out under current law: 100% bonus depreciation, expensing of R&D expenditures, and a looser limitation on net interest deductions.
(Press reports have noted interest by some policymakers in a range of changes to SNAP and Medicaid that would have the effect of reducing outlays, benefits received per beneficiary, or number of beneficiaries. While the Budget Lab does not analyze specific proposals here, we assume that the ultimate legislation will be consistent with the reconciliation instructions: outlay reductions in SNAP and Medicaid will achieve the target for deficit reduction in the Committee on Agriculture and the Committee on Energy and Commerce, respectively.)
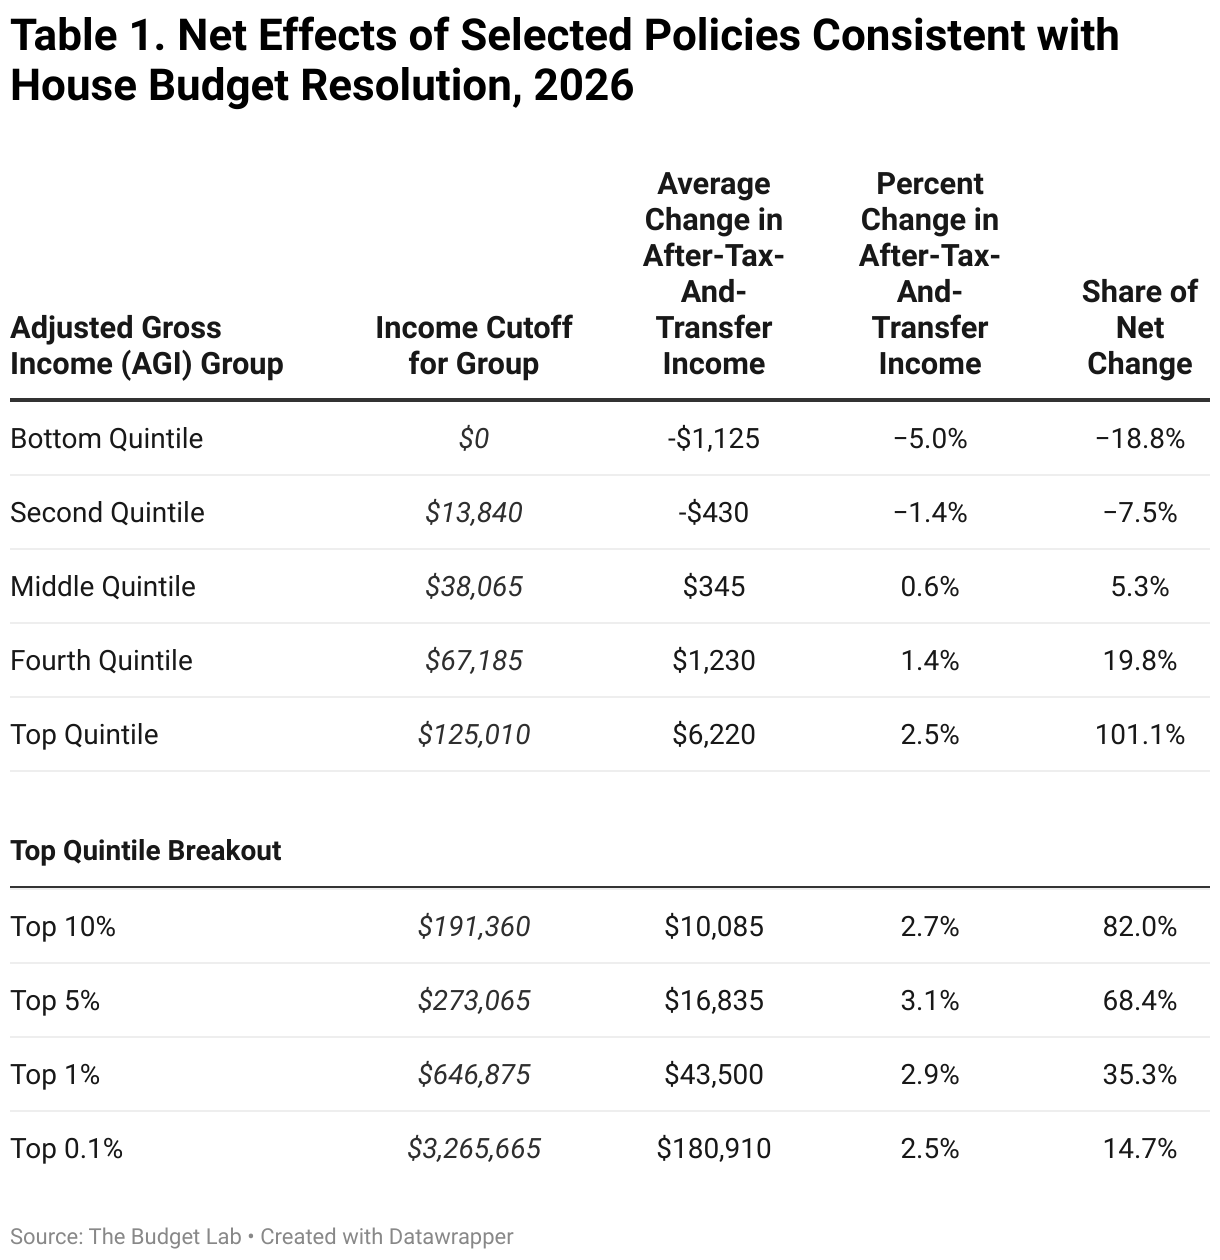
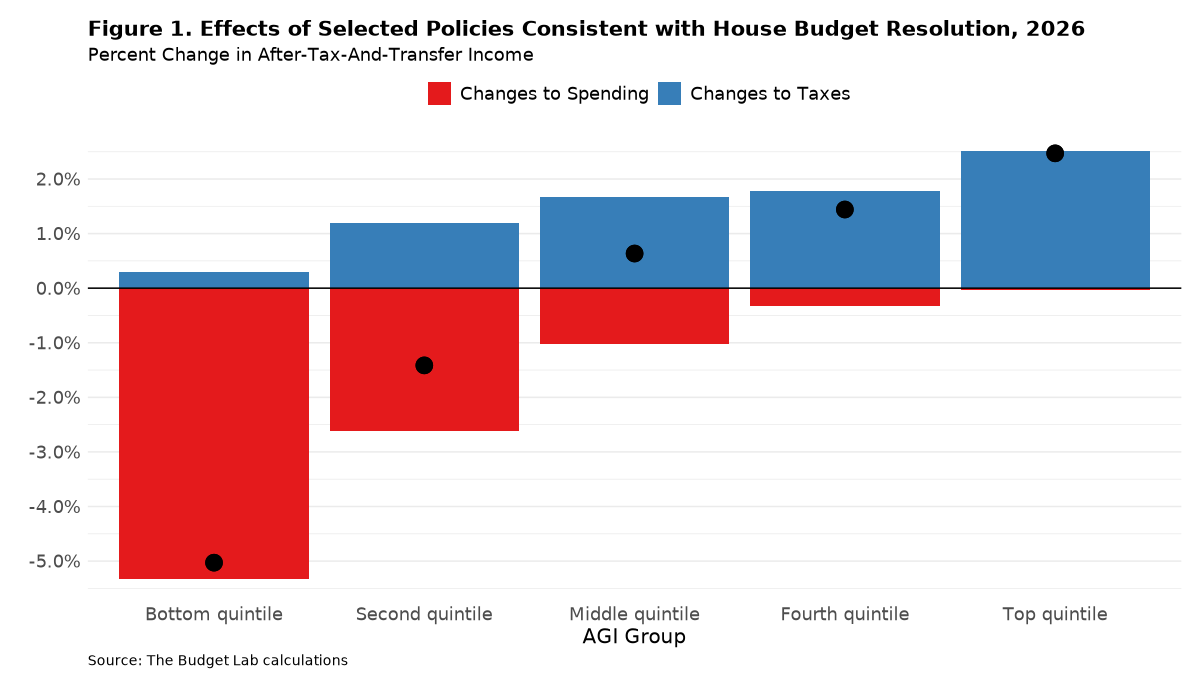
The results of this exercise are shown in the table and figure below, which displays changes to after-tax-and-transfer income in calendar year 2026. (For the purposes of this exercise, after-tax-and-transfer income includes (a) Adjusted Gross Income (AGI), plus above-the-line deductions, nontaxable interest, nontaxable pension income (including Social Security benefits), and employer-side payroll taxes; (b) SNAP benefits; and (c) Federal spending on Medicaid.)
The overall effect of these three policy changes would be regressive, shifting after-tax-and-transfer resources away from tax units (members of a household filing a tax return together) at the bottom of the distribution towards those at the top. Tax units at the bottom of the income distribution would see a reduction in after-tax-and-transfer income of 5%, those in the middle of the distribution would see a modest increase of 0.6%, and those in the top five percent of tax units would see an increase of 3%. More than 100% of the net fiscal benefit would accrue to the top quintile.
For the first two policy changes, we assume that total cuts to Federal spending on the programs are equal to the amounts specified for their respective committees, along with additional proportional cuts to account for the $500 billion of unspecified deficit reduction included in the Resolution. We assume that cuts are spread equally across the ten years of the budget window, and that spending on each subcomponent of the programs—in particular, benefits for recipients—is reduced proportional to its share of program spending in the most recent baseline projections from the Congressional Budget Office (CBO).
It is important to note the following caveats:
- The Budget Lab’s analysis of Medicaid uses the Current Population Survey Annual Social and Economic Supplement (ASEC) as its basis. Because the CPS excludes individuals living in institutional settings, the Medicaid figures in the table do not account for effects on beneficiaries living in nursing homes or other long-term care facilities. (Benefits for this group are projected to make up approximately 10% of Medicaid spending in FY2026.) Since members of this group typically have lower incomes than the noninstitutional Medicaid population included in the CPS, accounting for cuts to their benefits would increase the regressivity of the cuts we consider.
- In the ASEC, some higher-income households include individuals who report receiving SNAP or Medicaid, both of which are means-tested. Following CBO’s practice, we do not assume that these observations represent erroneous reports of receipt.2 As CBO notes:
Higher-income units may report receipt of transfer income for several reasons. Their income may vary during the year, allowing them to qualify for benefits in some months when their monthly income is low despite high annual income. In addition, some people qualify for benefits on the basis of their own income, despite living in higher-income families or households.
For example, if a disabled adult lives with their parents, the adult may qualify for Medicaid even if the parents have middle or higher incomes. Because this analysis is conducted at the tax-unit level, benefits of a low-income disabled adult who lives with their parents are assigned to an income group based on the total income of their full family in many cases. - The Budget Resolution calls for up to $4.5 trillion in tax cuts which is close to the estimated ten-year cost of extending TCJA’s expiring individual, estate, and business tax provisions. However, press reports indicate that some members of Congress are also interested in additional tax cuts like a SALT cap increase or President Trump’s “no tax on ...” campaign promises. We do not include the effects of these potential provisions.
As noted above, the Resolution passed by the House on February 25 does not specify how each committee is to meet its specified target. As such, the committees may ultimately endorse policy changes that substantially differ from those analyzed in this blog post. As the FY2025 Budget process continues in the coming months, the Budget Lab plans to analyze the distributional effects of these proposals, as well as the overall effects of the FY2025-FY2034 Budget on the distribution of income in the United States.
Detailed Methodology
Changes to Spending
For SNAP and Medicaid, we use self-reported program receipt in the 2024 Current Population Survey Annual Social and Economic Supplement (ASEC) as the basis for our illustrative estimates. While the value of SNAP benefits received is reported in the ASEC, Medicaid spending is not; as such, we impute Medicaid spending for each individual in the ASEC reporting Medicaid receipt using CBO’s baseline projections of average Federal spending on benefit payments per enrollee.
After individuals’ SNAP and Medicaid benefits are computed, we group individuals within each household into tax units using the Census Bureau’s imputed tax-unit ID and sort them by Adjusted Gross Income (AGI) as imputed by Census.
We adjust reported SNAP and Medicaid benefit receipt to account for the well-known phenomenon of underreporting of in-kind benefits by households in the ASEC. To do so, we scale up each income group’s aggregate benefits received so that total benefits match CBO’s baseline projections. (This is equivalent to assuming that individuals who receive benefits but do not report them in the ASEC have the same distribution of income as individuals who receive benefits and do report them.)
The script used to generate the figures in this analysis can be found here.
Changes to Taxes
Our estimates reflect the following expiring individual and estate tax provisions: lower tax rates on ordinary income, the expanded Child Tax Credit, the increase in the Alternative Minimum Tax exemption, the larger standard deduction, various limitations on itemized deductions, the elimination of personal exemptions, the deduction for pass-through income, and the increase in the estate tax exemption. On the business tax side, we include the effects of permanent 100% bonus depreciation, permanent expensing of R&D expenses, and an EBITDA-based net interest deduction limitation.
Our open-source microsimulation model Tax-Simulator is the basis for our tax estimates. The script used to generate the figures in this analysis can be found here. For this analysis, we sort tax units by AGI rather than a broader measure of income due to data limitations in the ASEC.
For more information on the model and how we calculate distributional effects, including assumptions about incidence by type of tax change, please refer to the following documentation pages:
Footnotes
- While the Resolution covers all of FY2025 through FY2034, we assume these cuts will be implemented over nine years rather than ten because of the limited remaining time in FY2025 for the budget process to conclude.
- Our results are robust to excluding observations where Medicaid and SNAP receipt is imputed in the ASEC due to non-response (results available upon request).