
“No Tax on Tips”: Budgetary, Distributional, and Tax Avoidance Considerations
Key Takeaways
-
While both presidential candidates have expressed support for some form a tax exemption on tips, the effects of such a policy would depend on how it’s designed and implemented. Design questions include whether eligibility would be limited based on industry or income, as Vice President Harris has suggested, and whether the exemption would apply to payroll tax.
-
About 4 percent of families report tips to the IRS, and those who do are disproportionately young, unmarried, and lower-income. This means that many tipped workers do not pay income tax to begin with and would not benefit from a new deduction.
-
We estimate that less than 3 percent of families would benefit from a broad-based income tax deduction for tips in 2026. The average tax cut for families who benefit would be roughly $1,700, though for bottom-quintile families that number is just $200.
-
Before considering behavioral feedback, an income tax deduction for tips would cost more than $100 billion over the next decade. Restricting eligibility to workers in the leisure and hospitality industries would reduce the cost by more than 40 percent.
-
A tax break that favors one form of income over others creates opportunities for tax avoidance. Back-of-the-envelope calculations suggest that the true cost of the proposal would be larger than the static cost, though the exact amount depends on the willingness of customers to trade lower prices for higher tips.
Note: links to the code used to produce the calculations in this report can be found in the Appendix.
Both candidates in the 2024 presidential election have expressed support for a tax exemption on tips. Former President Trump initially floated the idea at a Nevada campaign rally in June, after which several members of Congress have offered legislative interpretations: two bills would exempt tips only from individual income tax and another would additionally exempt tips from payroll taxes. Then, at a campaign rally in early August, Vice President Harris expressed support for the idea, specifying that the exemption would apply to “service and hospitality workers”. The Harris campaign later suggested that the tax break would include some form of limit based on overall income.
Many tax policy and budget experts have weighed in on the idea. Some have ballparked costs based on aggregate data from the IRS. Others have commented on how this kind of tax break is horizontally inequitable and would encourage inefficient tax avoidance behavior. And an earlier piece for the Budget Lab looks at the economic and demographic characteristics of workers in tipped occupations, emphasizing the large share of tipped workers who pay no income tax to begin with.
This report adds to the ongoing policy conversation by offering a quantitative look at the idea of “no tax on tips”. First, we analyze survey data to understand the economic, demographic, and industry characteristics of tipped workers. Next, we use that data as a basis for estimating the static budgetary and distributional effects of several interpretations of the proposal, including one with an industry-specific limitation. Finally, we highlight potential avenues for tax avoidance under the proposed exemption, ballparking the size of these effects and using this setting an instructive example of how budget analysts try to account for behavioral feedback in scores.
Characteristics of Tipped Workers
The budgetary and distributional effects of exempting tips from tax depend on who earns tips and how much tax they pay under current law. For example, if tips are disproportionately earned by those with low taxable income and marginal tax rates, the tax relief and associated revenue costs will be lower, all else equal. But data on this topic is limited. While the IRS reports certain aggregated datapoints on the tip income of W2 employees, the IRS microdata underlying our tax model contains no information on this topic.
That means we must look to other surveys for information on the characteristics of tipped workers. To include tips in our model, we start with microdata from the Survey of Income and Program Participation (SIPP), an economic survey conducted by the Census Bureau which asks respondents about various sources of income including tips. We use the SIPP microdata to estimate statistical relationships between tips, industry, wages, and demographic characteristics. Then, we use this model to impute tips for each worker in our simulation, making sure that the implied totals are consistent with what we know from aggregate IRS data. Please refer to the Appendix for further detail on our statistical model of tips.
The SIPP reveals four tax-relevant facts about tipped workers—all of which are consistent with previous Budget Lab findings from a separate survey data source:
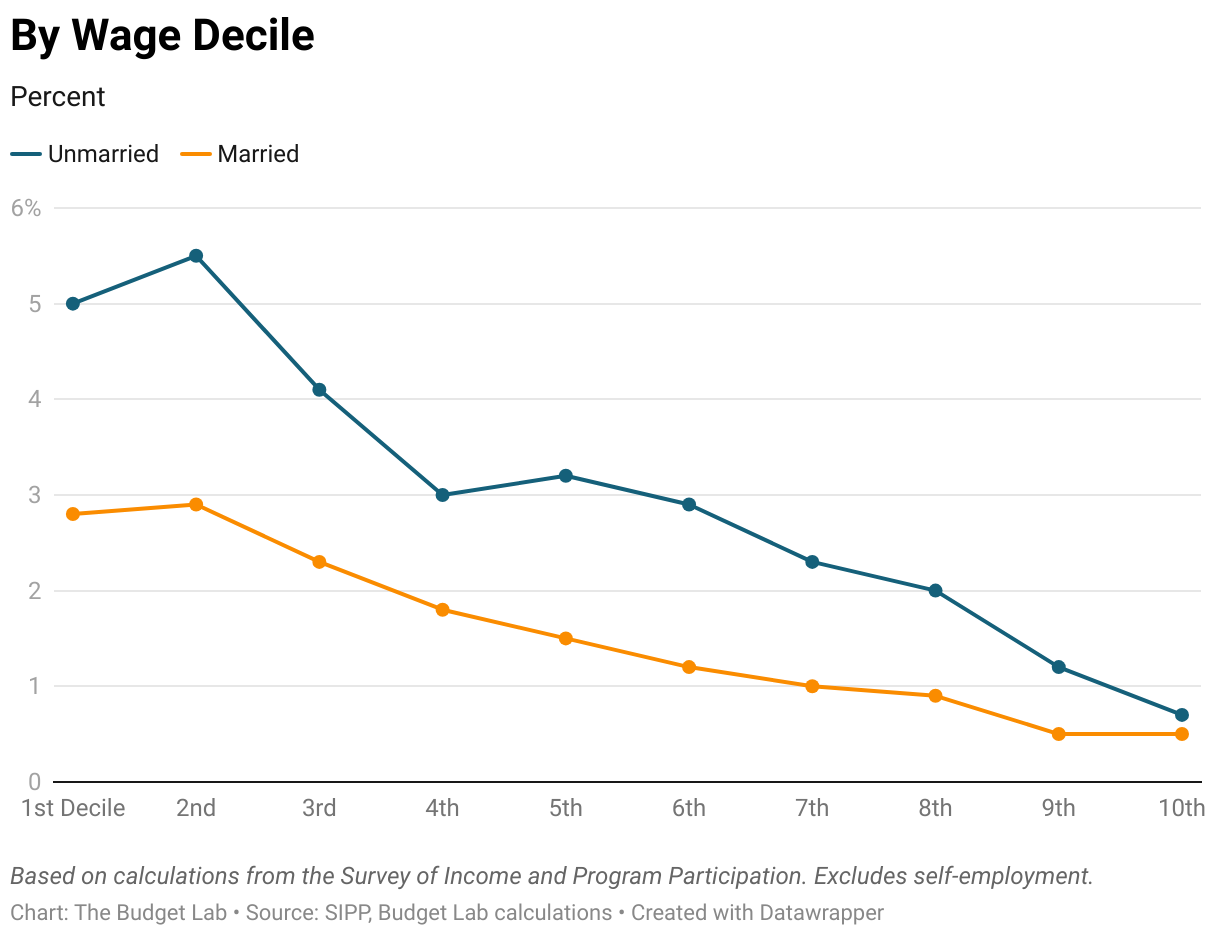
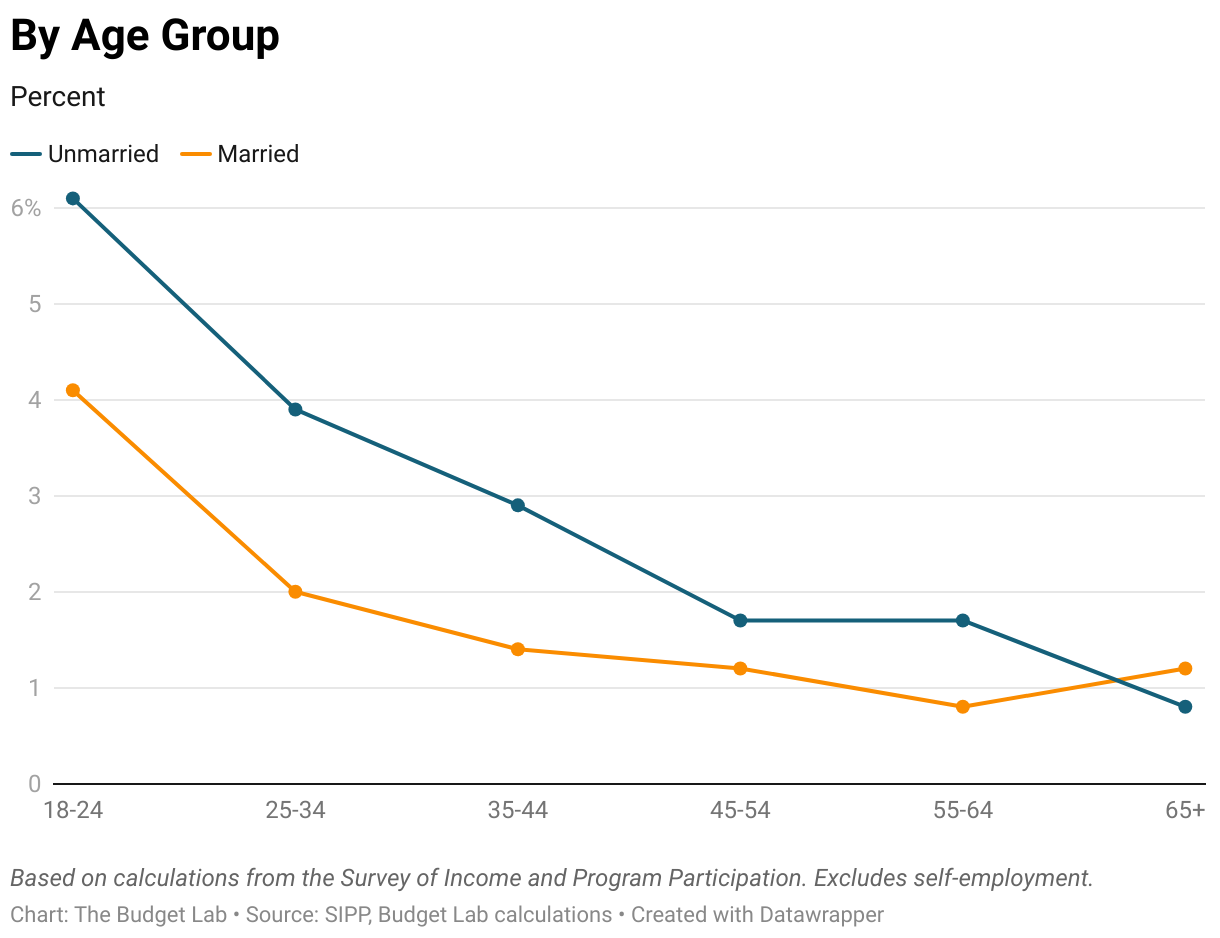
1. Younger, unmarried, and lower-earning workers are more likely to earn tips.
Tipped income is more common among younger workers, with those under age 25 about twice as likely to report tips as those in the 35-44 age range. Similarly, the fraction of workers who earn tips is highest at the low end of the wage distribution. Even after accounting for these factors, unmarried workers are more likely than married workers to earn tips. Figure 1 highlights these dynamics. Notably, we find no evidence that the propensity to earn tips varies by parent status conditional on these other factors.
Figure 1. Share of Workers with Tipped Income by Wages, Age, and Marital Status, 2017-2022
2. Most tipped workers earn a majority of income from sources other than tips.
SIPP data suggests that tips are not the dominant source of earnings for most tipped workers (defined as wage employees who earn nonzero tips). The median tipped worker earns about one-fifth of their earnings from tips, and only 24 percent of tipped workers earn a majority of their income in the form of tips. This pattern holds true even when we exclude those who worked multiple jobs over the course of a year.1 To be sure, these figures are somewhat higher for certain occupations (e.g. the median tip share for tipped bartenders is about half) and levels of income (e.g. the median tip share for bottom-quintile wage earners is 25 percent). And it’s possible that SIPP respondents may be underreporting tips relative to non-tip wages when they answer the survey. But overall, the data suggests that tips are not the most important form of compensation across all tipped workers.
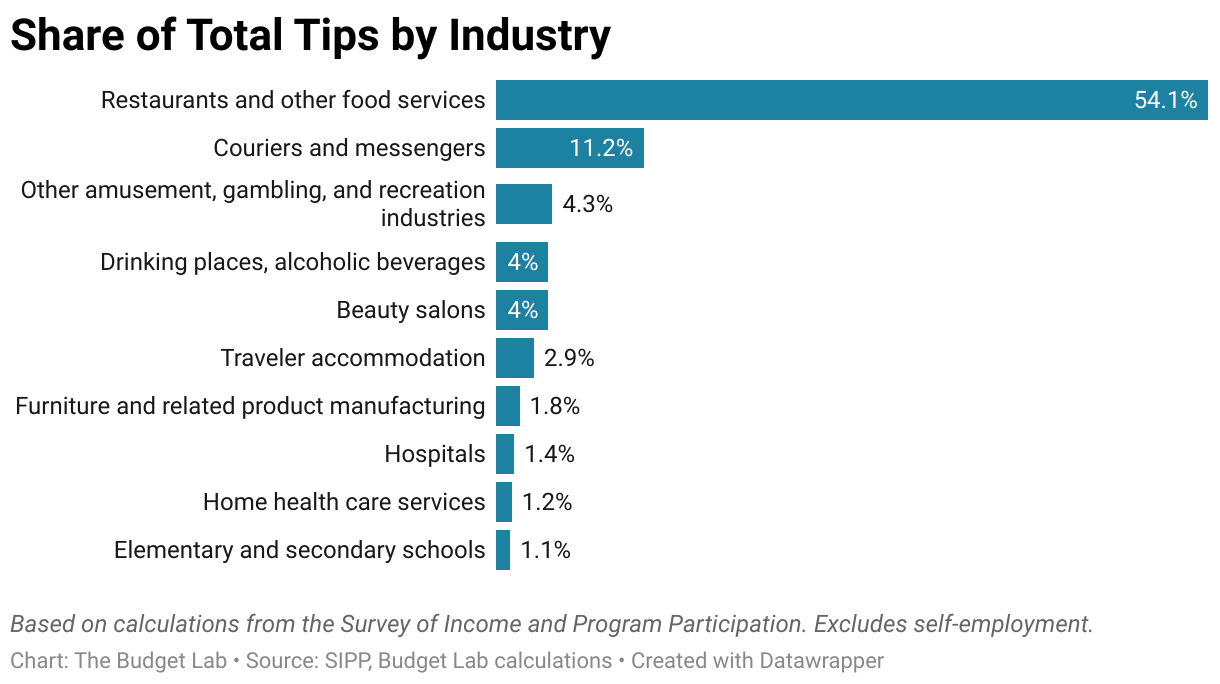
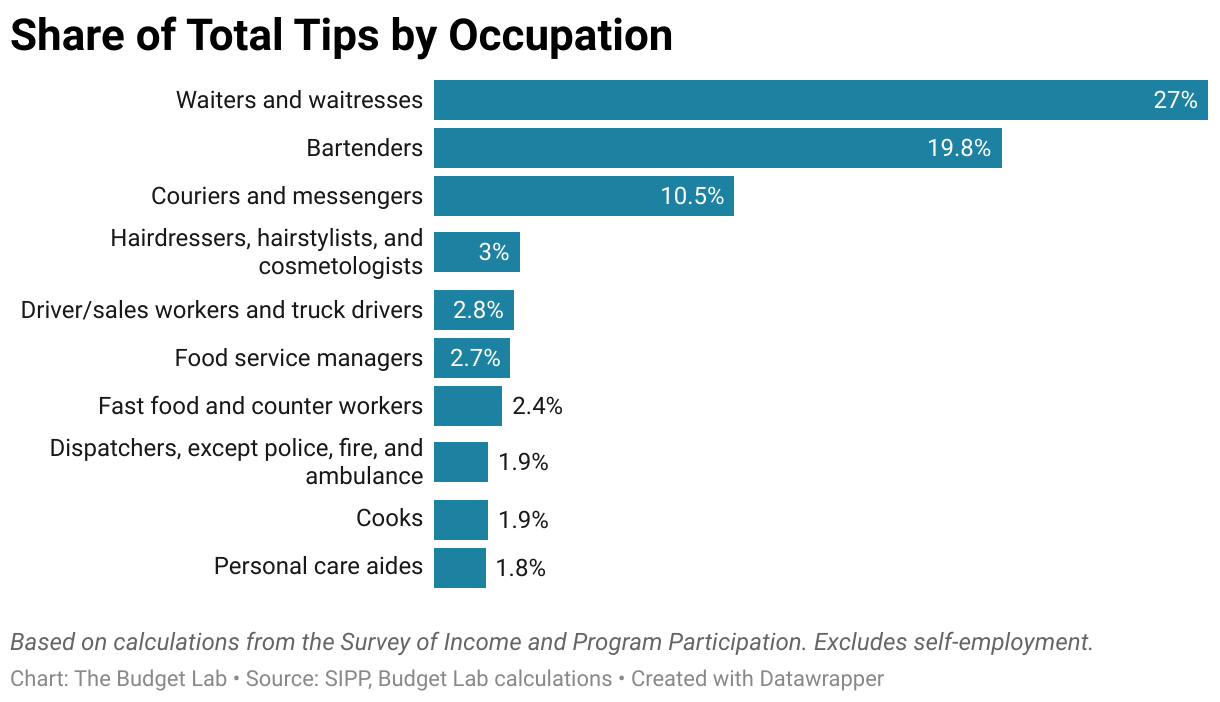
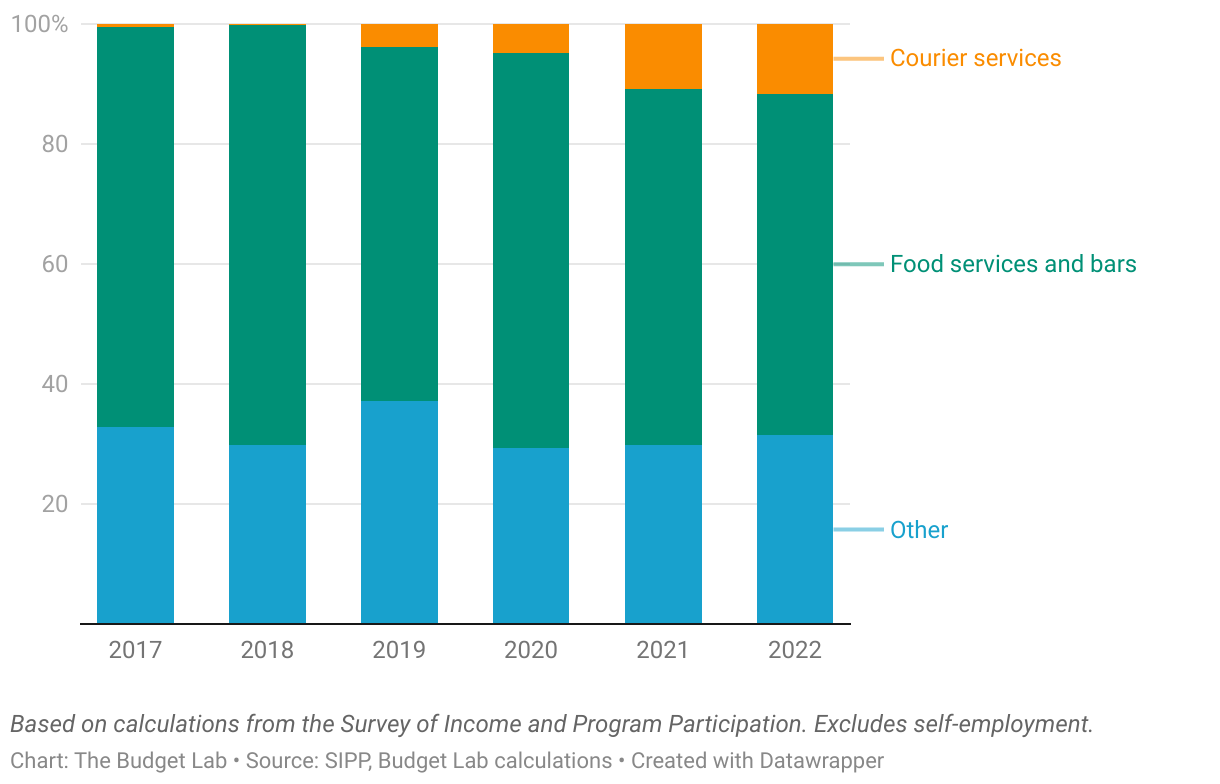
3. More than half of tips are earned in the food service industry.
Figure 2 shows the top ten industries and occupations by total tips. Workers in restaurants and other food service jobs earned 54 percent of all tips during 2021 and 2022, according to SIPP data. This industry has a high share of workers who earn tips, and tips make up a higher-than-average share of earnings among workers who do earn tips. The occupational breakdown tells a similar story, with five of the top ten occupations by tips being associated with food service.
Figure 2. Top Ten Industries and Occupations for Tips, 2021-2022
4. Courier services are a fast-growing source of tips.
One important source of recent growth in tipping involves the “courier services” industry—that is, different kinds of delivery workers. The share of total tipped income attributable to this industry rose from less than 1 percent in 2017 to about 15 percent in 2022, likely reflecting the dramatic pandemic-era growth in home delivery of goods and food.2 Courier services accounted for more than a quarter of the overall increase in tips over this period, according to SIPP data.
Figure 3. Share of Total Tips by Industry, 2017-2022
Policy Design Options
While both presidential candidates have signaled their support for some version of “no tax on tips”, neither has put forth a concrete description of what the policy would look like in practice. There are five key design questions, each with important budgetary, distributional, and efficiency tradeoffs:
- Would the exemption apply to income tax only—or also payroll tax? Today, tipped workers are subject to both income tax and payroll tax on their tipped income. In practice, due to other provisions, many low-income workers don’t pay any income tax. But all workers pay some amount of payroll tax. Therefore, an income tax-only version would not create additional benefits for some tipped workers, whereas all tipped workers would see tax cuts if payroll taxes were also exempted. The latter option would come at a higher budget cost and potentially reduce tipped worker’s future Social Security benefits, which are tied to a worker’s reported earnings. If future Social Security benefits are impacted, that obviously affects the distributional impacts of the policy as workers may trade higher income now for lower benefits in the future.
- Would the income tax exemption be structured as a deduction or an exemption from gross income? There are two ways tips could be exempted from income tax for most filers. The first is an above-the-line deduction, in which case filers would still report their tips as part of wages but get to deduct their value when computing Adjusted Gross Income. The second approach is for tips to be excluded from wages entirely. Others have noted that the latter approach might leave certain tipped workers who benefit from the Earned Income Tax Credit (EITC) and the Child Tax Credit (CTC) worse off relative to current law, since those credits become more generous with higher reported earnings, up to a point.
- Would the policy be limited to tips earned in certain industries or occupations? Vice President Harris indicated her proposal would apply to “service and hospitality workers”. While legislation and/or Treasury regulations would be required to define the precise test which determines eligibility, there is precedent in the tax code for this kind of “guardrail”.3 An industry-based restriction would reduce the budget cost and limit opportunities for tax avoidance at the cost of administrative complexity and arbitrarily excluding certain tipped workers.
- Would tips earned through self-employment be eligible? According to SIPP data, tips earned through self-employment make up about 7 percent of all tips. Excluding this source of tipped income would exclude certain workers who receive 1099 income, of which some amount represents tips. Such a restriction would reduce the budget cost and limit opportunities for tax avoidance and evasion because self-employment income is subject to substantially fewer third-party reporting requirements than W2 wages.
- Would there be other limitations? Harris’s campaign has also alluded to an income-based limit on a tax break for tips. There are different ways this could be structured. One option is to phase the deduction out with income above a certain threshold. Another option is a limitation on the total amount of deductible tips, either expressed as a dollar amount or a fraction of total income. A limitation based on income would alleviate concerns that high-income taxpayers would reclassify income to take advantages of a tax break meant for lower-income workers. But it would come at the cost of complexity and higher implicit marginal rates for those in a phase-out rate range.
In this report, we analyze three options that have been clearly articulated by proponents or legislation to date:
- Income tax deduction for tips.
- Income tax deduction for tips earned in specified leisure and hospitality industries.
- Income tax deduction and payroll tax exemption for tips.
We define “leisure and hospitality” to mean workers in industries with NAICS code 71-72. This classification would include restaurants, bars, coffee shops, casinos, amusement parks, traveler accommodation services, and more. It would largely exclude some tipped occupations, for example taxi drivers, delivery workers, and hairdressers. This definition is meant only to be an illustrative example of what a hospitality-oriented restriction might look like; a final legislative and regulatory interpretation might include workers excluded under our definition.
We assume that only tips earned through wage employment would qualify; tips earned through self-employment would be ineligible for the new tax break.
Finally, we analyze these scenarios in the context of current law rather than a baseline incorporating candidates’ other proposed policy changes—for example, the extension of individual tax cuts under the Tax Cuts and Jobs Act (TCJA) or Harris’s proposal to increase the tipped minimum wage.
Static Estimates
This section presents budgetary and distribution estimates on a static basis—that is, before considering how tax avoidance and other behavioral changes would affect the score. Static analysis offers a useful starting place for understanding the first-order effects of policy changes, especially when the magnitude of behavioral effects is uncertain. But we stress that these numbers represent likely lower bounds since a “no tax on tips” policy would likely have significant behavioral effects. The final section, following this one, discusses the plausible magnitude of behavioral responses which would increase the costs presented here.
Budgetary effects
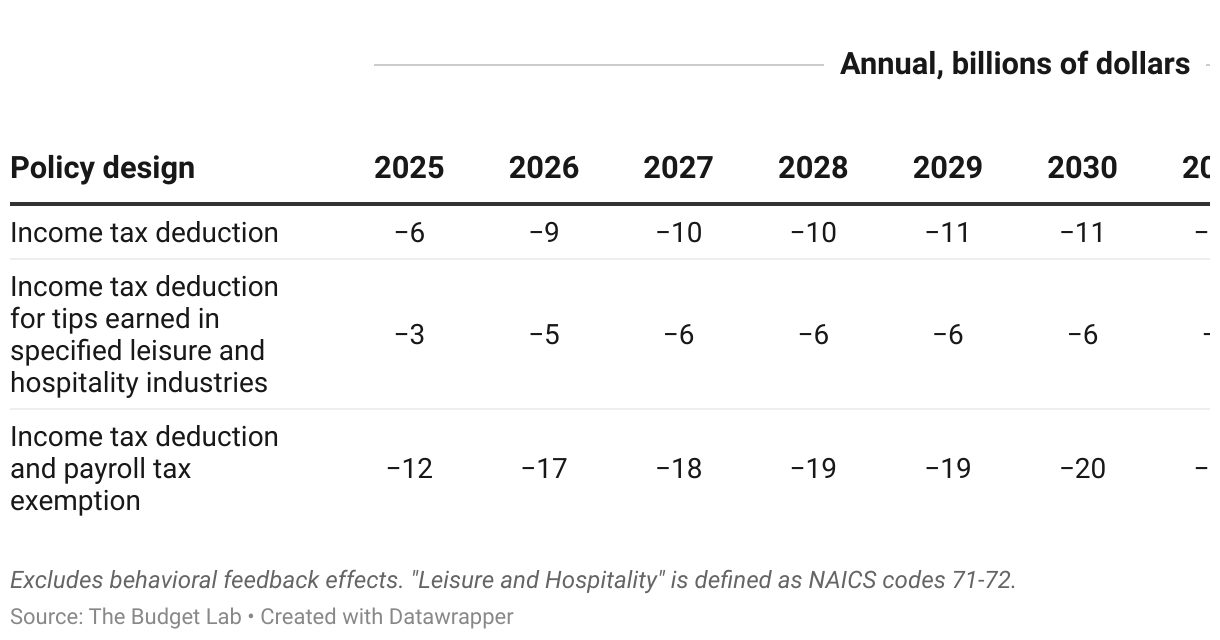
We estimate that an above-the-line income tax deduction for tips would cost $107 billion over the 2025-2034 budget window, before considering any behavioral feedback effects. If this deduction were restricted to workers employed in specific leisure and hospitality industries, the ten-year cost would be about 40 percent lower ($62 billion). If, instead, tips were also made exempt from payroll taxes, this static cost estimate rises to $195 billion.4 These numbers are consistent with estimates from other budget researchers.5 Table 1 shows estimated budget effects on an annual basis.
Table 1. Estimated Static Budgetary Effects, FY2025-2034
Distributional effects
Who would benefit—and by how much—under each design option? The overall distributional impact of a tips exemption can be broken down into three pieces:
- How many families earn tips in each income group?
- Among families with tipped income, what fraction would benefit from the proposal?
- Of those who do benefit, what is the average tax cut?
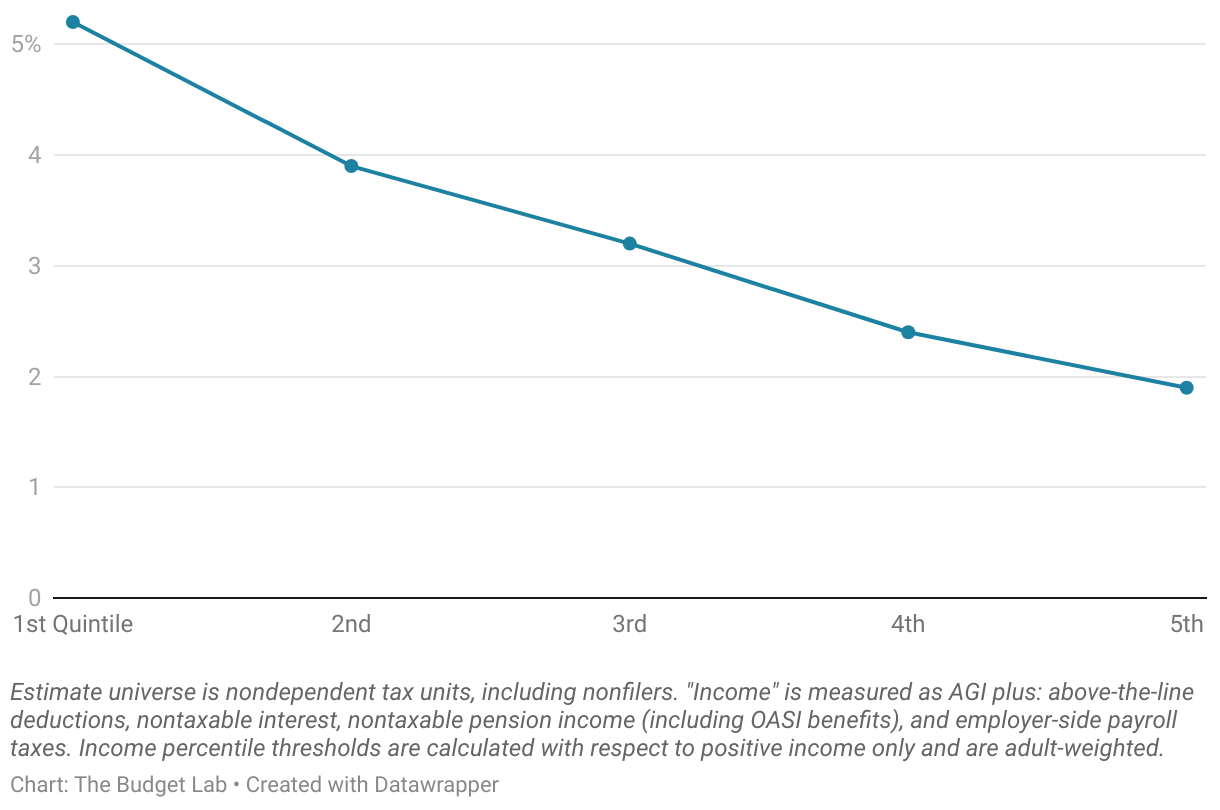
Figure 4 addresses question (1), showing our 2025 projection of the share of tax units with nonzero W2 tipped income by income group. In total, we project that 6.3 million tax units will report some amount of tips. As described in a previous section, lower-income families are more likely to report tipped income. That means, all else equal, these families are more likely to benefit from tax relief tied to having tipped income.
Figure 4. Share of Tax Units with Tipped Income, 2025
But not all else is equal. Many of these lower-income families pay no income tax, and so would not benefit from additional reductions in taxable income. Figure 5 answers question (2) by asking: What share would see tax relief in 2025? The left panel restricts the sample to those with tipped income only; the right panel looks at all tax units.
Figure 5. Share of Tax Units with a Tax Cut, 2025
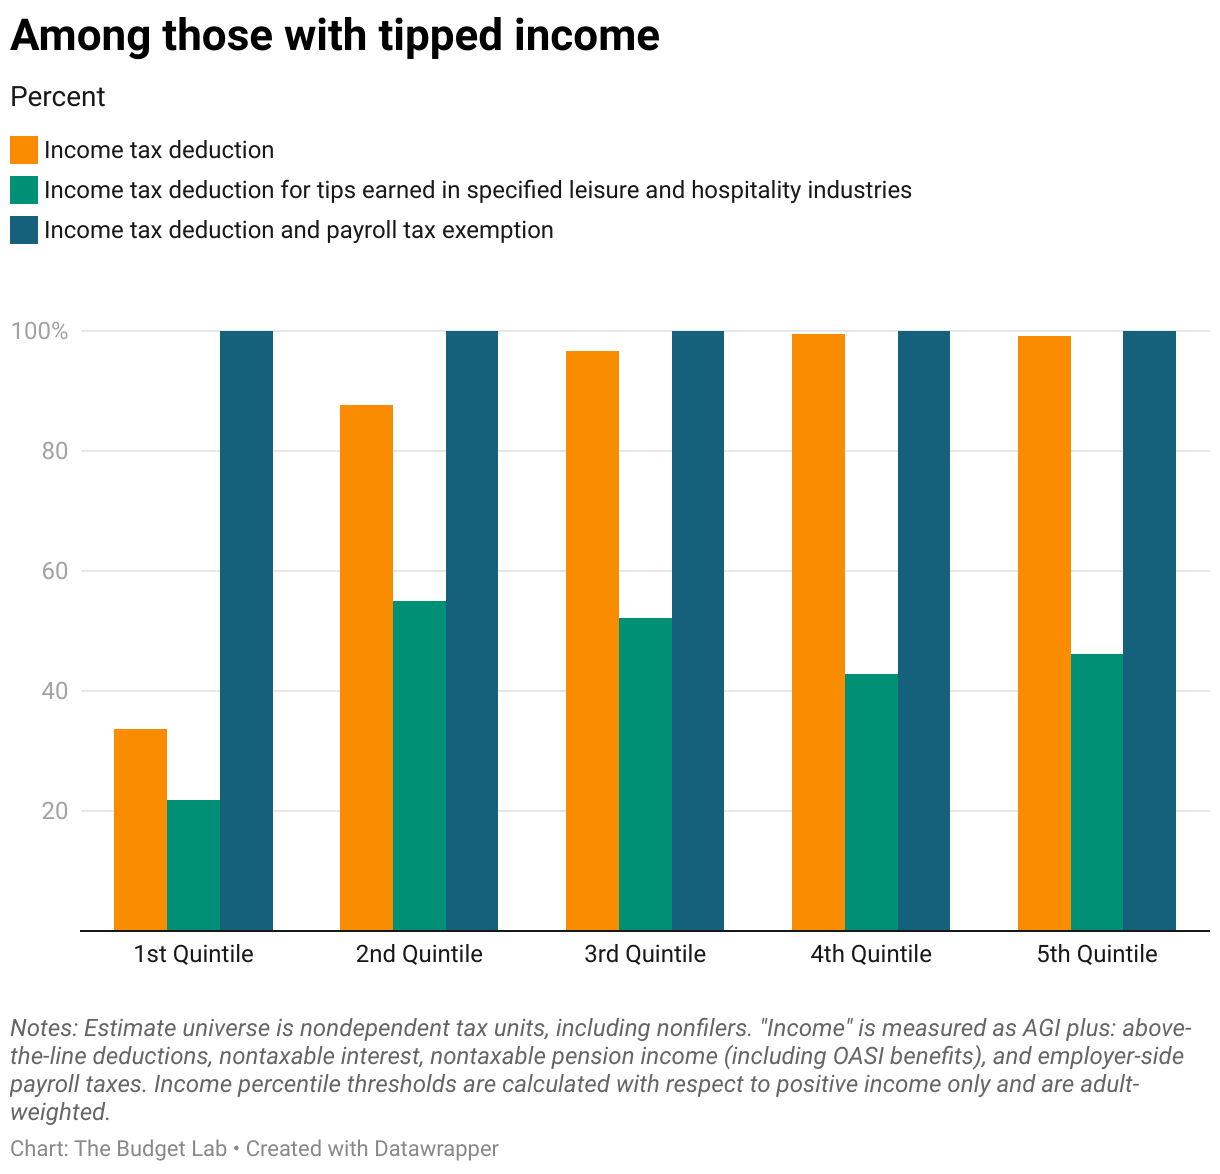
Because all workers pay some amount of payroll tax, all families with tipped income would see tax cuts under a version of the proposal that includes payroll tax. If the exemption is limited to just income tax, only 34 percent of bottom-quintile tax units with tips would benefit, since most in this group do not owe any income tax to begin with; nearly all of above-median families with tips would benefit in this scenario. Finally, we consider a design option where the income tax deduction is restricted to a subset of workers earning tips in leisure and hospitality sectors. Fewer than half of all families with tipped income would benefit in this case, due to either insufficient income and/or working in an ineligible industry. Taken together with the fact that a small share of tax units report tips to begin with, the fraction of all tax units that benefit would be small across all scenarios and income groups. Less than 3 percent of tax units would see a tax cut under the income tax deduction scenario.
Next, question (3): Among those with a tax cut under each proposal, what would the average size of the tax cut be? Figure 6 shows our estimates below. The average size of tax cut rises with income under all scenarios because higher-income tipped workers generally have more tips to deduct. In addition, average tax cuts rise more steeply under the income tax-only design options due to the income tax’s progressive rate structure—that is, a dollar of deduction generates more tax savings for someone with a higher tax rate than a lower tax rate. Notably, average tax cuts are higher if the income tax deduction is restricted to leisure and hospitality workers only. That’s because tipped workers in these industries—restaurants, for example—tend to earn a higher fraction of their earnings through tips compared with tipped workers in other industries—e.g. delivery workers.
Figure 6. Average Tax Cut Among Those Who Benefit, 2025
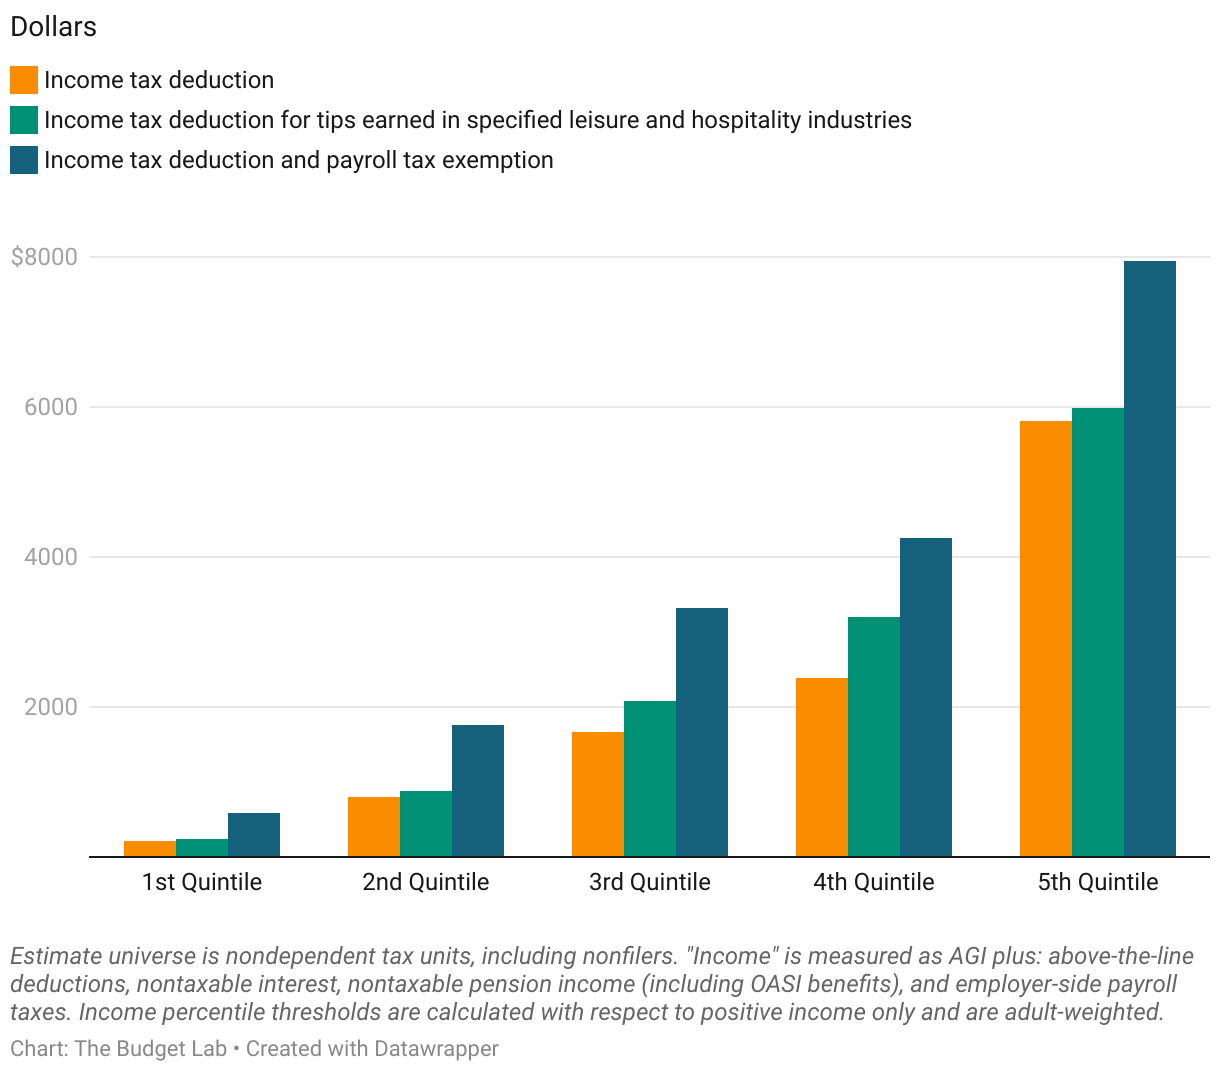
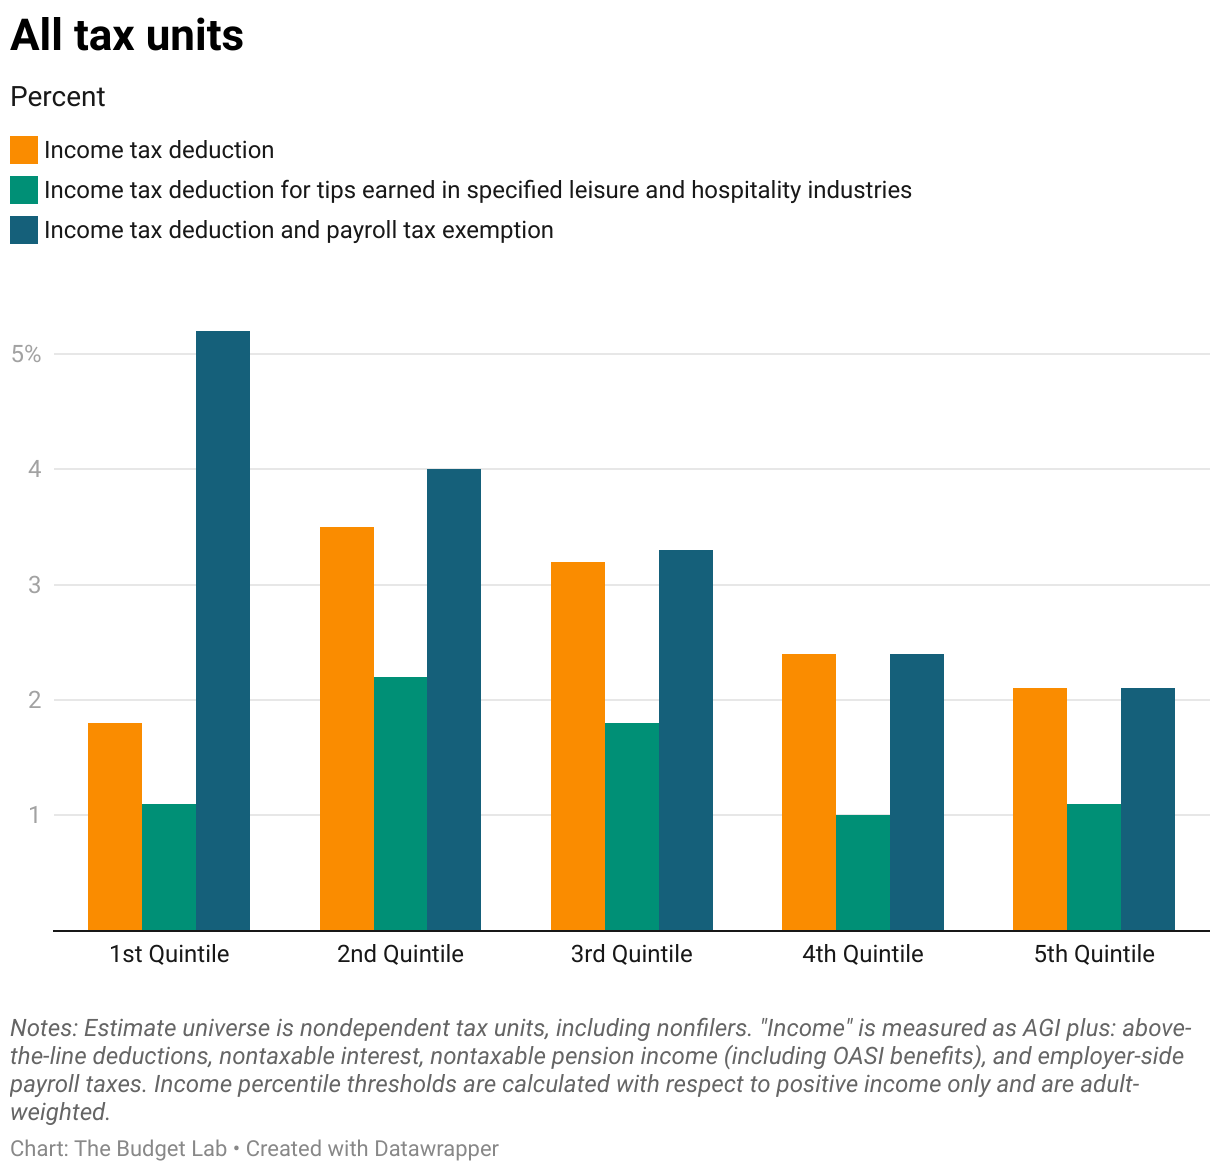
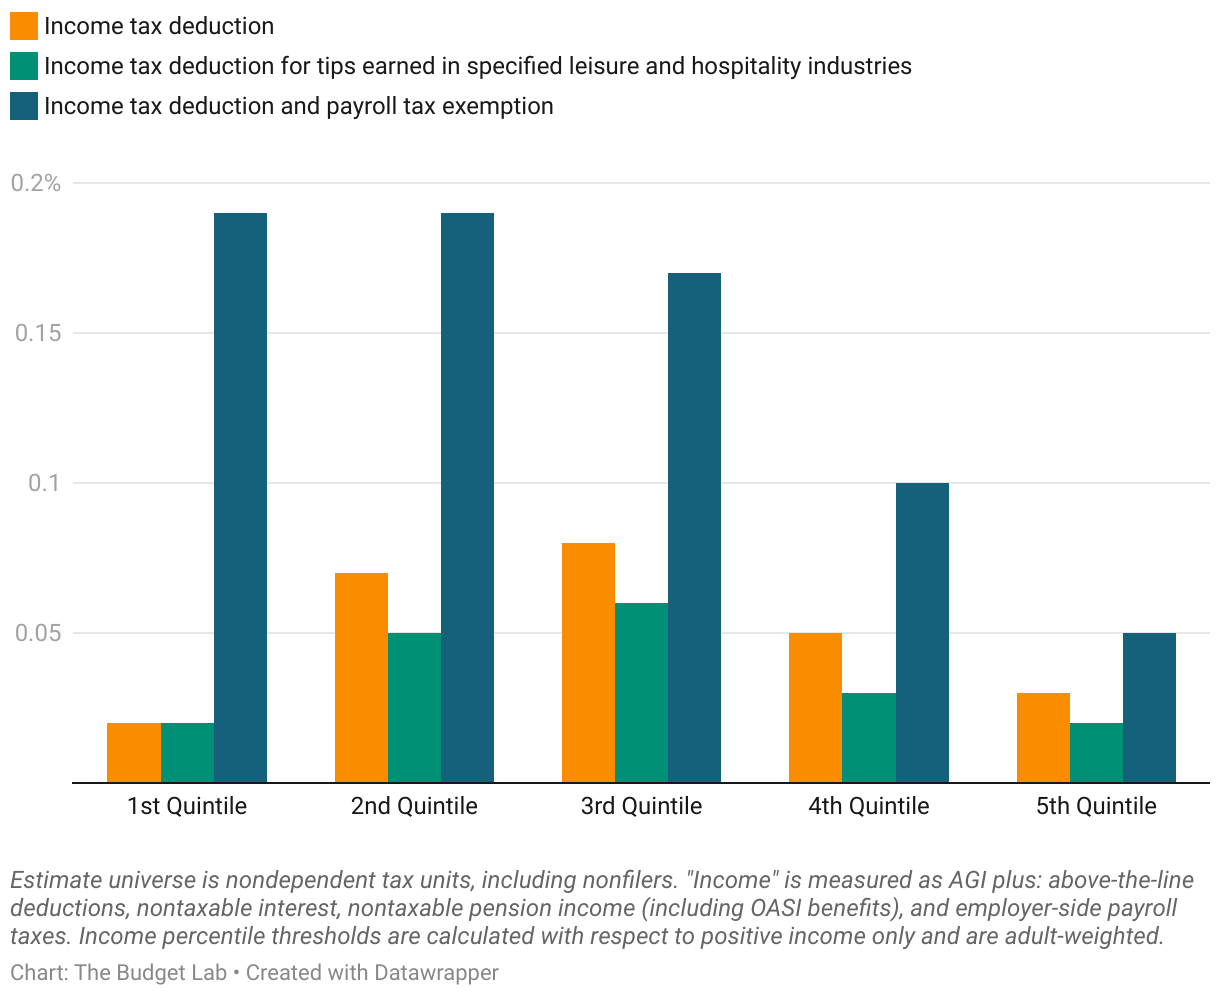
Figure 7 combines these factors—propensity to earn tips, the share of tipped workers benefiting from each proposal, and the average tax cut among those who benefit—to measure the overall progressivity of the reform. It shows the relative change in after-tax income for each income group among all workers, not just those who earn tips, and underscores three main static distribution takeaways:
- Tips are a small share of overall earnings, so any tax provision targeting tips will have muted aggregate distributional effects. Less than 3 percent of tax units would benefit and no income group sees an increase in after-tax income of at least 0.1 percent under the income tax-only versions.
- Lower-income tipped workers owe little to no income tax. This factor more than offsets the fact that this group is most likely to report tips.
- Exempting payroll taxes increases the progressivity of the proposal at an additional revenue cost of almost $100 billion over a decade.
Figure 7. Percent Change in After-Tax Income Among All Tax Units, 2025
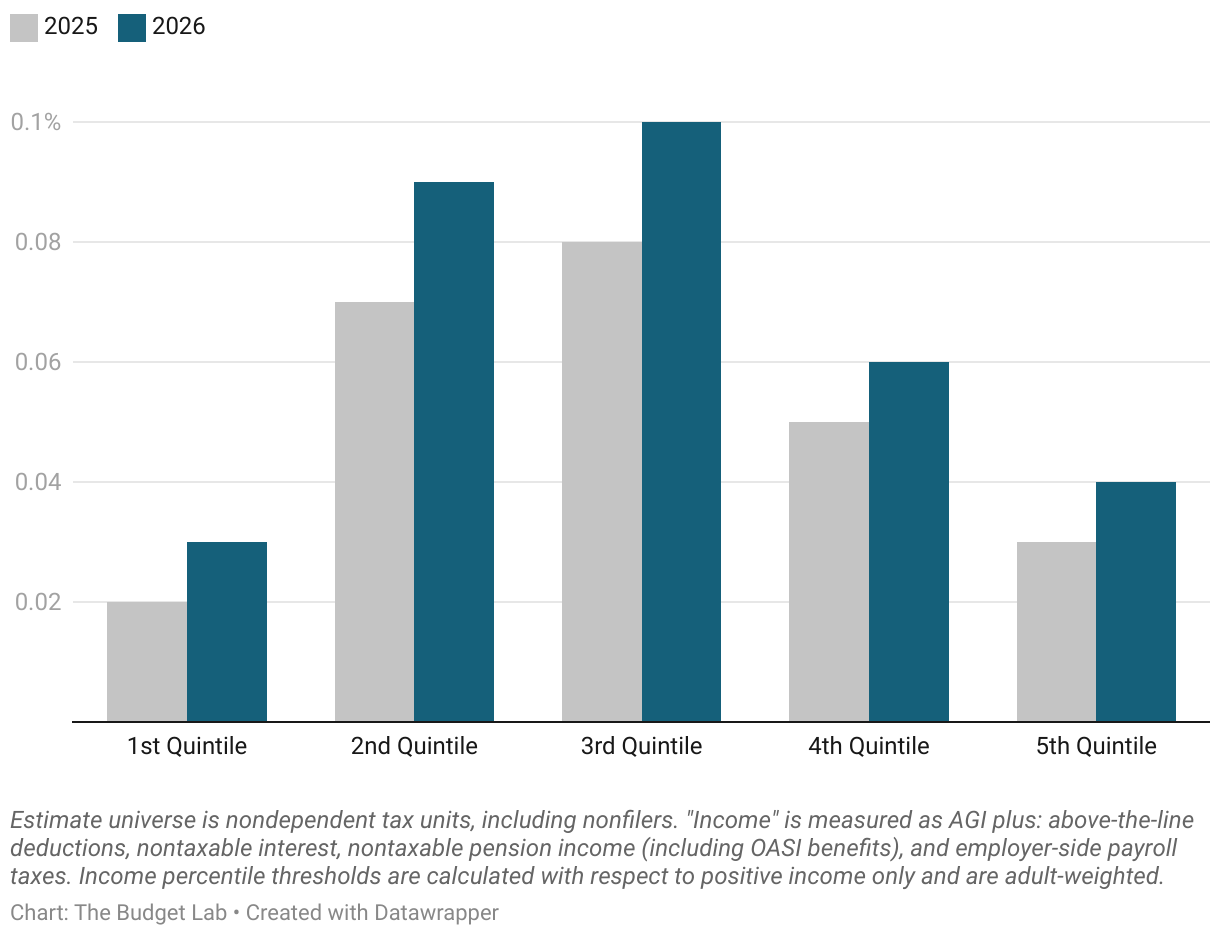
Finally, it’s worth noting how these distributional effects interact with the scheduled expiration of individual tax cuts under TCJA. In 2026, tax rates are scheduled to rise and the standard deduction is scheduled to fall, among other changes. That means deductions will generate larger tax savings and a higher share of filers will pay income tax—two factors which increase the generosity of a new deduction for tips. Figure 7 illustrates this dynamic by comparing the overall distributional impact of an income tax deduction for tips in 2025 and 2026.
Figure 8. Percent Change in After-Tax Income under the Income Tax Deduction Option, 2025 vs 2026
Estimating Behavioral Changes
The static estimates presented above are constructed by applying the proposed tax changes to our current-law projection of tipped workers. But the results of this exercise are a lower bound on the true impact. In reality, workers, employers, consumers, and tax planners would have an incentive to coordinate their behavior to take advantage of a new tax break. In all likelihood, tips would rise and other forms of income would fall, increasing the revenue cost of the proposal.6
Budget scorekeepers account for this kind of tax avoidance response when constructing “conventional” revenue estimates. (Review our primer on different types of budget estimates here.) The process for incorporating behavioral responses typically involves reviewing the relevant research, calculating how the policy reform affects taxes, then applying the findings of that research to the current context. Examples include looking to historical evidence when simulating how business owners avoid taxes and our application of realization elasticities to proposed capital gains tax changes. This process is inherently difficult: it requires careful consideration of how institutional contexts differ, an ability to parse econometric evidence, and an up-to-date understanding of how tax planning strategies are evolving over time.
But this task is especially challenging in the context of the proposal to exempt tips from tax. There is no direct precedent for this proposal, which means there are no studies measuring the responsiveness of tipped income to tax changes. To be sure, there are other tax policy settings which are nominally similar, such as the tax exclusion for employer-sponsored health insurance or tax-preferred retirement accounts, but there are reasons to believe these settings are of limited external validity. And most of all, tipping is hard to model as a purely economic phenomenon. It’s a cultural norm based more on social convention than crude financial calculation. Any behavioral feedback estimate must take a stance on the tricky subject of how social norms will respond to taxes. And different assumptions here can lead to very different answers.
For these reasons, rather than present a single estimate of tax avoidance, we use this section to walk the reader through our thinking on how one might ballpark the size of behavioral responses under a “no tax on tips” policy. The goal is not to deliver a precise estimate but rather to arrive at reasonable order of magnitude while illustrating the kinds of modeling choices that go into an estimate. Indeed, because assumptions often drive results, this is a core mission of the Budget Lab—to be fully transparent in how we arrive at our final numbers, and to educate the public about how budget scorekeeping works.
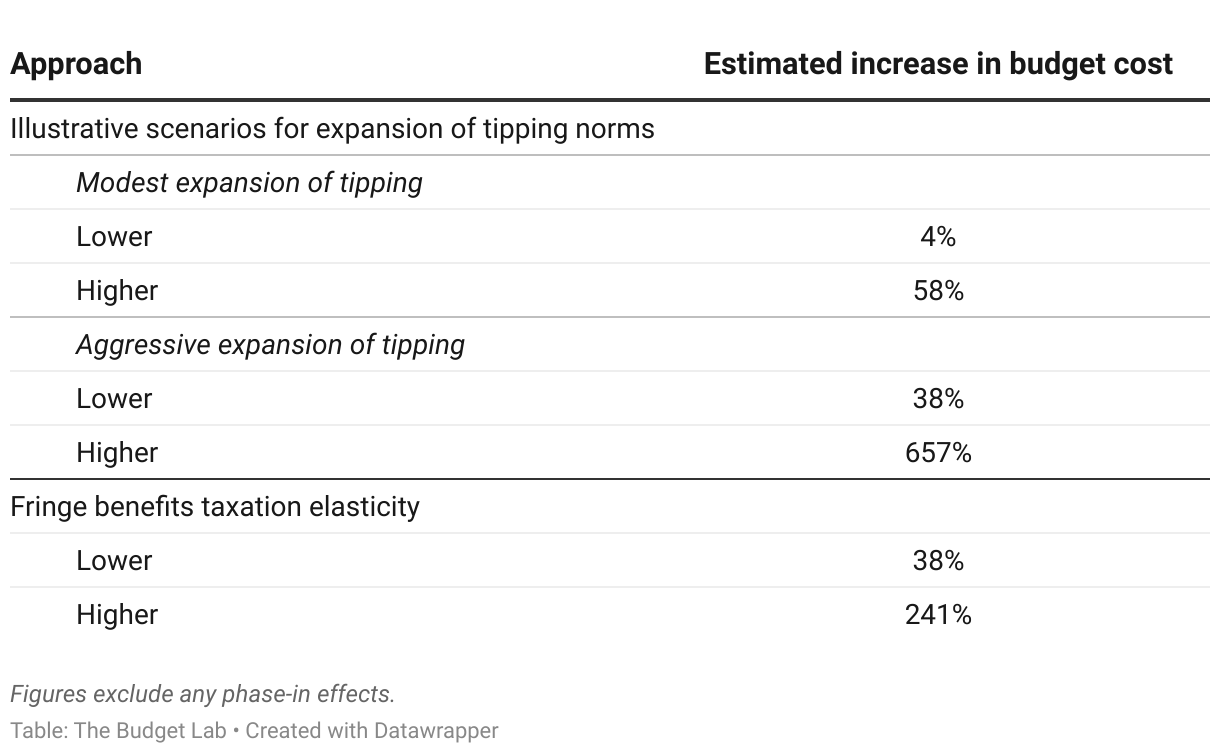
In this section, we begin by describing potential avenues for tax avoidance under the policy. After that, we present two different approaches for ballparking the size of behavioral feedback—one where we simulate shifts in tipping norms based on occupation and industry, and another based on empirical evidence from the fringe benefits literature. (We look only at behavioral feedback under the income tax-only version of the proposal with no industry requirements; guardrails based on industry or income would limit potential avenues for avoidance and reduce the estimates described below.) Table 2 summarizes our ballpark estimates of long-run behavioral feedback.
Table 2. Estimated Size of Behavioral Feedback by Approach
Potential margins of behavioral response
When quantifying the behavioral feedback effects of a tax policy reform, the first question to ask is: what are the potential margins through which taxpayers could plausibly change their behavior? Once we have a list, we can look to related contexts for an empirical estimate of how important each margin is. Here are some plausible margins for the case of a tips exemption:
- Increases in customer tipping. Tipping is a social custom currently limited to a small share of industries and occupations. But tipping might expand in response to a new tax incentive. Indeed, the pandemic offers an example of how these norms can change quickly: technological progress (e.g. the use of computer tablets in retail checkout situations) and social appreciation for “frontline workers” combined to increase the prevalence of tipping over the course of just a few years.
But even if a tax preference would lead to more tips, economic theory tells us that total compensation would remain unchanged. In a conventional score, budget scorekeepers assume that labor markets are competitive (that is, workers generally get paid their marginal product) and that macroeconomic prices remain fixed (that is, aggregate labor income doesn’t change across scenarios). This means that any increase in tips would be offset by a reduction in wages. Consider a worker who earns $25/hr in wages under current law. If we project that they would earn an additional $5/hr in tips under a scenario where tips are exempt from tax, their wage rate must fall to $20/hr. One complication, though, is that workers tend not to favor nominal wage cuts. Therefore, it’s likely that any shift from wages to tips would happen over time rather than immediately: nominal wages might grow more slowly than they otherwise would, with tipping increasingly filling in the gap.
The closest existing tax policy analogue to new tax exemption for tips is the nontaxability of certain fringe benefits, like employer-sponsored health insurance or contributions to retirement accounts. Like a proposed tax exemption for tipped income, these tax preferences encourage compensation to take the form of a tax-preferred category rather than wages. Evidence shows a relatively high tax elasticity of nontaxable fringe benefits—that is, employees do accept a higher fraction of their compensation in the form of benefits when it’s tax-efficient to do so. But how much this experience applies to the case of tips is unclear. On one hand, tips might be more tax-elastic because they are merely another form of cash (unlike in-kind benefits which are valuable but only up to a point). On the other hand, tips might be less elastic: while benefits only require a two-party negotiation (employee/employer), tips add a third party into the mix via customers.
Another difficulty with this scenario—a purely tax-driven expansion of tipping—is that it would need to be socially coordinated without being too explicit about what’s happening. In the IRS’s eyes, the difference between wages and tips is that the latter cannot be compelled or expected as payment for services. Tips must be voluntary. A large coffee chain, for example, cannot announce that they will cut the price of a coffee from $5 to $2 so long as customers promise to offset the gap with a $3 tip. Rather, this kind of process must play out informally through norms—a tacit understanding among customers, employers, and employees.
Would employers bother to optimize on behalf of their employees? Would employees trade the certainty of wages for uncertain streams of tipped income? And most importantly: would customers oblige? Anecdotal evidence suggests many Americans are already unhappy with the pandemic-era proliferation of tipping. These questions underscore the difficulty of estimating the size of behavioral changes under this proposal, as it requires venturing beyond the traditional toolkit—economic theory and empirical evidence—and into speculation about social norms. - Unilateral reclassification of other income as tips. Evidence repeatedly shows that when a specific form of income faces preferential tax treatment, taxpayers respond by reclassifying their income to look like the favored form “on paper”, even if the underlying economic substance is unchanged. Examples include investment managers paying capital gains tax rates on labor income, business owners switching legal status based on tax treatment, owner-managers characterizing wages as profits to avoid payroll tax, and wealthy taxpayers creating complex legal vehicles to avoid estate tax. But there are important impediments to this kind of income shifting in the tips context.
The main difference is that these historical examples do not require coordination with third-party actors. For example, whether a closely held business elects to be taxed under the corporate tax system depends only on the decisions of its owners. It does not require the approval of employees or customers. But in the context of tips, workers and employers can only shift wage compensation into tips if customers cooperate by tipping more. Some have worried that firms may re-write contracts or otherwise explicitly coordinate with customers to ensure compensation takes the form of tips instead of commissions or other kinds of income. But that is explicitly barred under the IRS’s definition of tips, which requires that tips be fully optional—for example, a mandatory 20 percent service charge at a restaurant would be considered non-tip wages, since the payment is compulsory. Similarly, tips earned in exchange for promising a lower sticker price would not count as tips from the perspective of the tax code. Of course, the line between mandatory and optional is sometimes unclear, and the IRS may have a difficult time with enforcement, especially in cases where tips are negotiated implicitly. But still, the combination of multi-party coordination and strict IRS rules would make unliteral income reclassification more difficult here than in other settings.
In addition, if the proposal includes restrictions based on industry, it would be harder for higher-income taxpayers to characterize existing income flows as tips since many have no substantive ties to leisure and hospitality activities. Recent evidence from the Qualified Business Income (QBI) deduction suggests that well-defined rules can be effective at preventing taxpayers from reclassifying income into tax-preferred industries.
The only exception might be active participant owners of S corporations, who have some degree of unliteral leeway over the composition of their compensation. They may wish to characterize a greater share of W2 wages paid to themselves as tips, and may be able to coordinate with customers more easily. Still, for this situation not to be outright fraud, the character of these tipped transactions would need to be genuine. - Relative wage changes. By increasing the after-tax return to working a tipped job relative to a non-tipped job, these proposals may encourage some non-tipped workers to look for jobs in tipped industries if they could earn the same amount. For example, a worker who is currently indifferent between a warehouse job that pays $20/hour and a waiter job that pays $20/hour including tips would be incentivized to choose the latter due to the new tax preference. This increase in labor supply would drive down the rate of compensation in tipped industries. Whether this change would have second-order budgetary effects depends on the form that decrease takes: if tips fall, then the cost of the deduction would be smaller; if wages fall, it would merely offset the decrease in wage rates in non-tipped industries. In either case, the budgetary impact of this margin is likely to be small.
- Industry reallocation. If the tax break is limited to specific industries only, then tipped workers from ineligible industries would be encouraged to move to eligible industries, all else equal. This dynamic would have the same effect described in the bullet point above.
Approach #1: Illustrative scenarios for expansion of tipping norms
One simple approach for estimating the size of behavioral feedback is to combine economic theory, data, and judgment to run several “what if?” scenarios. If the scenarios are constrained by plausibility, we can bound the magnitude of behavioral response within a range. In our case, we want to construct plausible scenarios about which kinds of workers and businesses would see higher tips, then ballpark the budgetary implications using data.
We can begin by imagining that, in world where tipping is tax-favored, industries or occupations with lower rates of tipping will end up looking more like those with higher rates of tipping—so long as they are similar in some way. For example, while grocery stores have dramatically lower rates of tipping compared with restaurants, it’s just not reasonable to expect that a 20 percent gratuity upon checkout will become the new norm when shopping at your grocery store. But grocery stores do have slightly lower rates of tipping than other retail settings (for example, deli counter workers or grocery baggers maybe be tipped but cashiers generally are not). So it’s plausible to think that, in the presence of a tax break, grocery stores would see slightly higher tipping rates—customs that have already proven viable in other retail stores.
We use SIPP data to estimate the budgetary effects of this behavioral feedback scenario using the following steps:
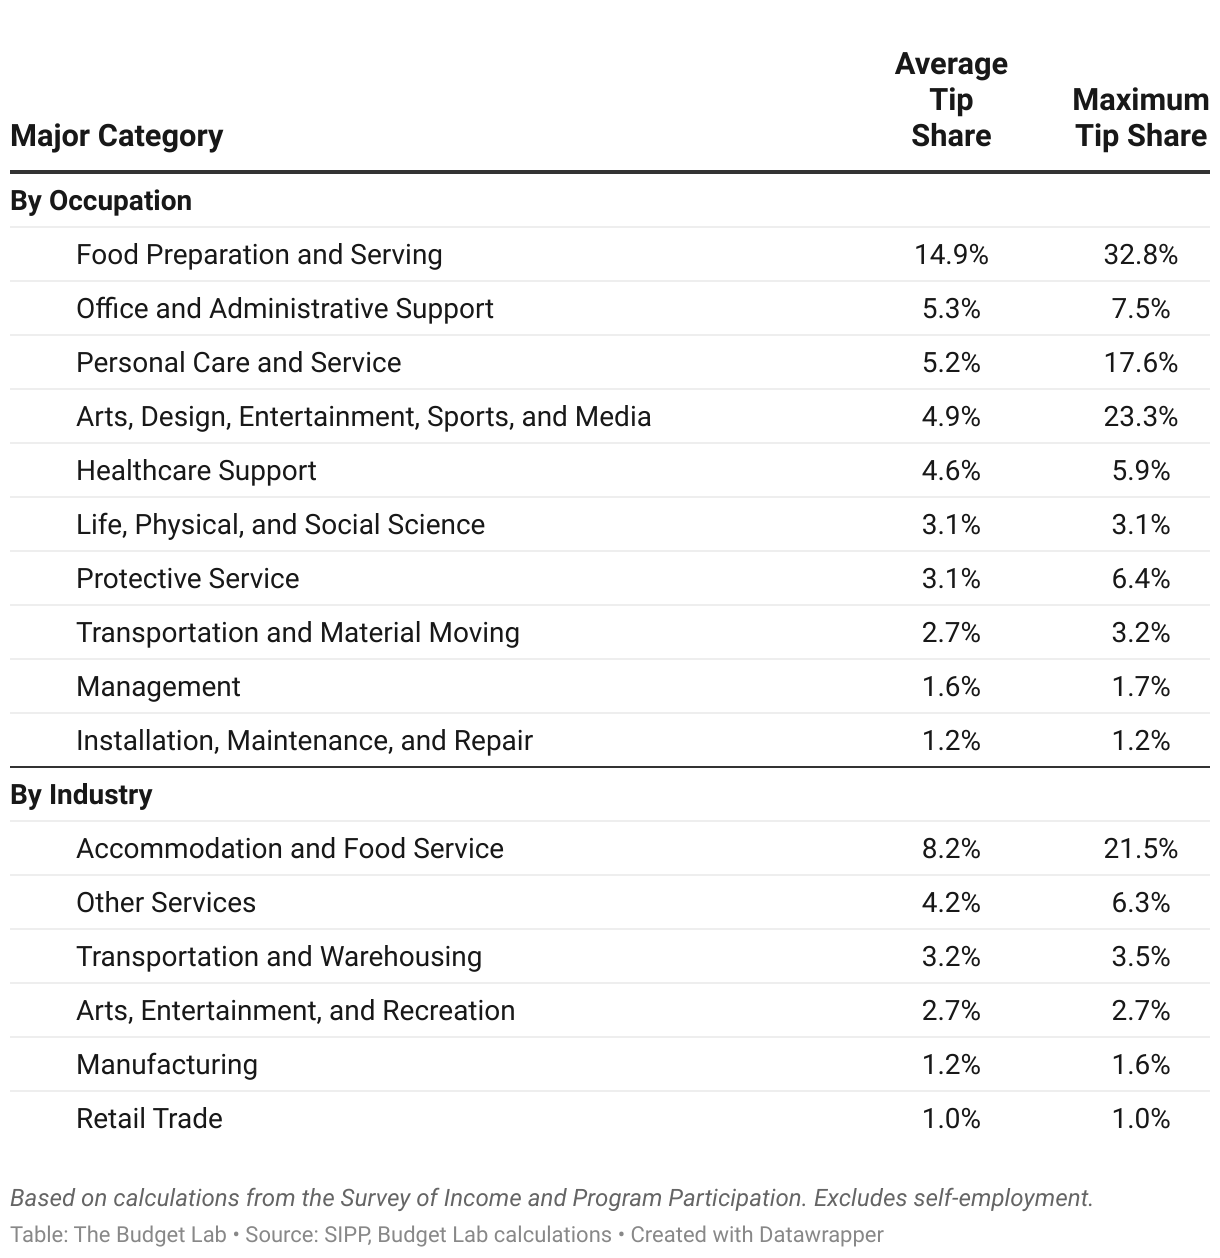
- Classify workers into detailed and major occupation categories. We use Census industry definitions.
- Calculate measures of tipping prevalence at both the detailed and major category level. We calculate tip share of share of wages (“tip share”) for all detailed groups, then calculate the maximum and average tip share by major category.
- Calculate the implied additional tips in a world where lower-tipped occupations adopt the customs of higher-tipped occupations in the same major category. We simulate two scenarios for tipping expansion. The first is a modest expansion scenario where below-average occupations adopt the average tip shares of their major category. The second is an aggressive expansion scenario where all occupations adopt the maximum tip share of their major category. If we assume that new tips face the same tax rate as existing tips, the percent increase in tips is also the percent increase in the budget cost due to behavioral feedback.
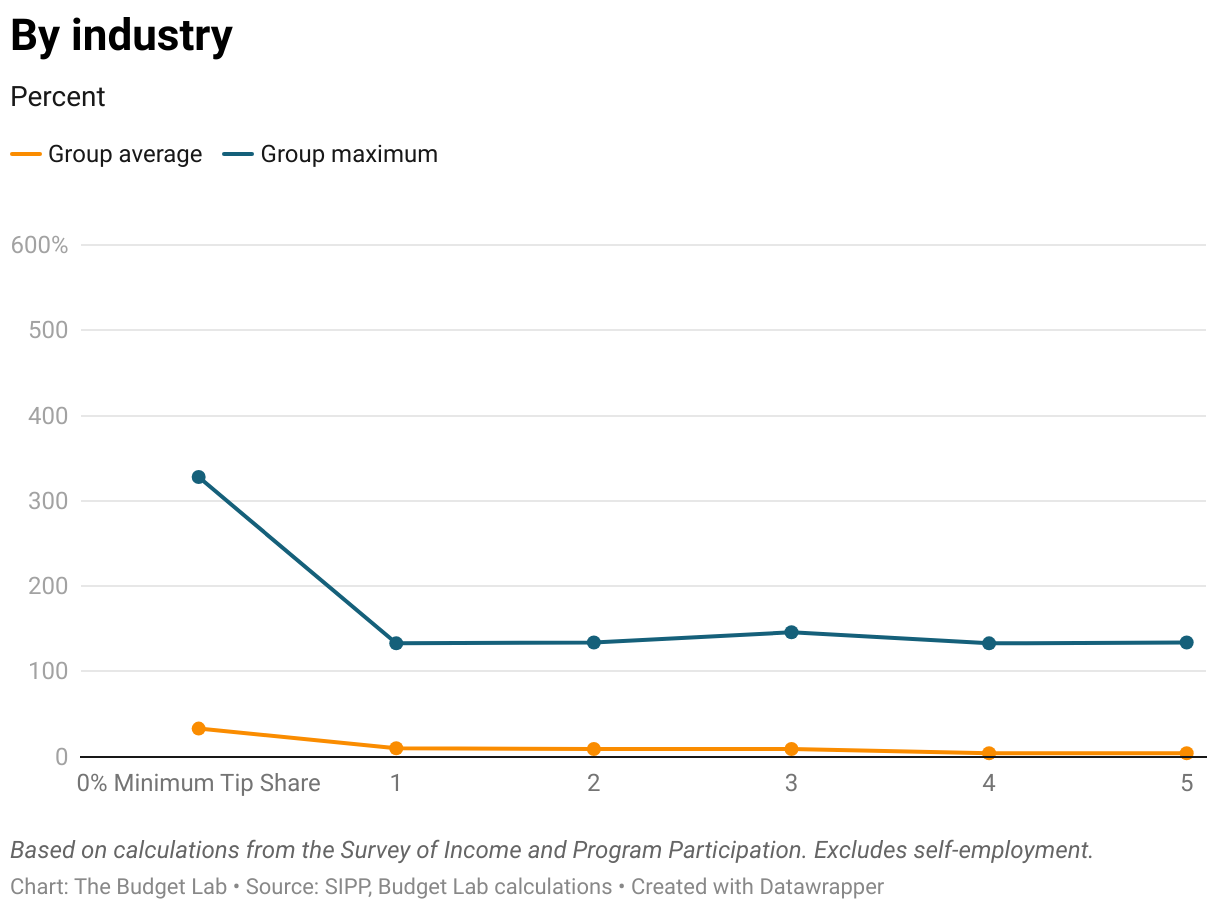
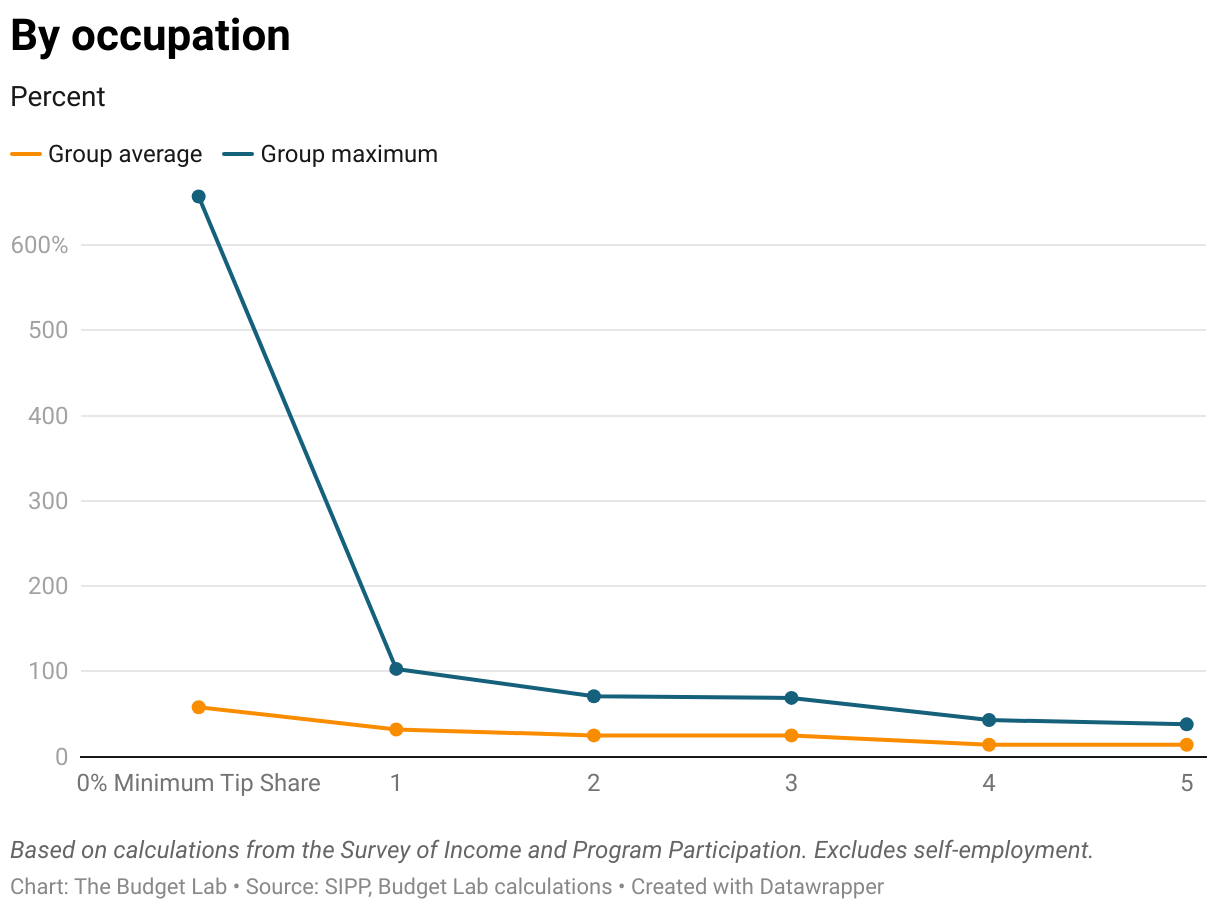
To see how sensitive our estimates are to assumptions, we repeat this exercise under different conditions. First, we use industry categories in addition to occupation categories. In practice, tipping customs are clustered around both industry (e.g. dishwashers may get tips in a restaurant but not in a retirement home kitchen) and occupation (e.g. a bartender who works for a sports arena rather than a bar still gets tips), so it’s useful to try both methods of categorization. Second, we vary the minimum tip share for inclusion in step (2) above. The idea is that if we believe some minimum amount of tipping is necessary for expansion under a tax-preferred regime—that is, that some industries or occupations will simply never adopt tipping customs—then we can ignore places where tipping is not sufficiently prevalent.
Table 3 shows average and maximum tips shares using a 1 percent tip share inclusion threshold.
Table 3. Average and Maximum Tip Share of Wages by Major Occupation and Industry Category, 2017-2023
The results of this exercise are shown in Figure 9 below. If tipping expansion is limited to occupations /industries where tips already make up at least 1 percent of earnings, then lower-tipped occupations/ industries adopting average tipping norms would lead to an estimated increase in tips between 10 and 32 percent. This is the “modest” tipping expansion scenario. Looking instead at the “aggressive” tipping expansion scenario, in which occupations/industries adopt the most generous existing tipping norms, the estimated increase in tips rises to between 103 to 133 percent. These figures are much larger if we remove the restriction that there needs to be some baseline degree of tipping.
Figure 9. Estimated Increase in Tips under Different Tipping Expansion Scenarios
This exercise leaves us with an extremely wide range of implied outcomes. While this approach benefits from interpretability, it can only produce conditional estimates of behavioral responses, and at the end of the day it still requires us to make subjective decisions about which conditions are more likely. But in some cases this is the best that budget analysts can do: use data and economic theory to build models relating assumptions to outputs, and allow others see how changes in those assumptions will affect outputs.
Approach #2: Fringe benefits taxation elasticity
The alternative to a scenario-based approach is to instead look at the existing empirical evidence in a related topic area. One area where existing research might be applicable is the tax treatment of fringe benefits. The idea is that a tip exclusion would create a tax-preferred form of compensation similar to the exclusion for employer-sponsored health care premiums. As described above, there are important reasons why this setting may differ from the question of how much compensation takes the form of tips. But the net directional effect of those differences is not obvious ex-ante.
Researchers have studied how implicit tax subsidies influence employers’ health insurance offerings and generally find that insurance spending rises with tax rates. One such study is Gruber and Lettau (2004). It finds that a one percentage point increase in the tax subsidy rate for health insurance leads to (1) a 0.36 percentage point increase in the likelihood of being offered health insurance, and (2) a 1.05 percent increase in insurance spending among firms who already offer insurance. These effect sizes are “in the middle of the previous range of findings for firms offering elasticities”.
What would it look like if we applied these findings to the case of an income tax deduction for tips? Let’s do some back-of-the-envelope math, starting with the extensive margin. How many non-tipped employees would become tipped in this scenario? The paper estimates a probit model but only provides enough information to use the implied linear probability coefficients, so our answer is calculated as:7
Percentage point change in the tipped worker share = -0.36 * (change in the marginal tax rate)
Using our tax microsimulation model, we estimate that the dollar-weighted average marginal tax rate on tips (including payroll tax) will be 37 percent under current law and 11.9 percent under an income tax deduction for tips in 2026. That gives us a change of –0.25. Applying the elasticity to this figure, we get an implied increase in the share of tipped workers of -0.25 * -0.36 = 0.089, or 8.9 percentage points. The baseline tipped share of wage employment is 4.2 percent, so an additional 8.9 percent represents a 215 percent increase in tipped workers—that is, tipping would more than triple along the extensive margin.
Next, let’s look at the intensive margin: how much would tips rise for existing tipped workers? We do a similar calculation to get the change in tax rates, except this time we use average marginal tax rate on tips calculated among tipped workers only (37.2 percent under current law, 13.6 percent with an income tax deduction for tips). A 24 percentage-point change in the tax price applied to the –1.05 semi-elasticity implies an approximately 28 percent increase in tipping along the intensive margin.
If we assume that new tipped workers are similar in economic and demographic characteristics to existing tipped workers, then the total increase in aggregate tips would be the sum of the 215 percent extensive margin result and the 28 percent intensive margin result, a total increase of 241 percent. In other words, the conventional budget score would be about 3.5 times the static score in the longer run, abstracting from any adjustment period during which these changes phase in.
Do these back-of-the-envelope calculations pass the smell test? Ex-ante, a tripling of the score due to behavioral responses seems plausible: after all, this policy would create an atypically straightforward opportunity for tax avoidance. But in addition to the conceptual differences between tips and benefits laid out in the section above, it's also worth noting that this approach is highly sensitive to assumed functional form. In particular, the paper’s “offering elasticity” is expressed in percentage point terms, and 91 percent of employees in their sample are offered health insurance. In contrast, only 4.2 percent of workers earn tips in our projection. Thus, a 0.36 percentage point increase in the outcome variable represents a much larger relative increase against a 4.2 baseline versus a 91 percent baseline. This suggests that our large result is in part an artifact of assumed functional form, and that a different regression specification would generate a much smaller effect. If we instead convert the paper’s offering elasticity from percentage-point to percent terms, we get a value of -0.36 / 0.91 = -0.39; the estimated 25 percentage point change in the tax rate on tips only generates a -0.39 * 0.25 = 10 percent increase in tipped workers. In other words, using this approach, the answer to the question of how much the budget cost will increase due to behavioral feedback is “anywhere between 38 percent and 243 percent”—a range so large it does not tell us much. This illustrates yet another difficulty in relying on econometric evidence to estimate behavioral responses: the further removed you are from the initial context, the harder it is to justify using estimated regression parameters.
To summarize, the benefit of using an empirical elasticity is that the choice of behavioral parameter value is based on rigorous academic research rather than pure theory or judgment. But differences in institutional contexts can limit external validity, and it’s not always clear how best to use measured elasticities in “out of sample” data settings.
Conclusion
“No tax on tips” is an idea that could take many forms in practice, and our analysis indicates that its effects would be especially sensitive to design choices. These choices come with important tradeoffs. For example, applying the exemption to payroll taxes increases generosity and progressivity, but at a larger cost to the budget and to the universality of contributions to Social Security and Medicare; a restriction based on industry could limit the potential for avoidance, but it would increase tax compliance costs and further worsen the proposal’s negative effects on horizontal equity—arbitrarily favoring some earnings over others, even at the same income level.
Appendix
The code uses to produce the calculations in this report can be found at the following links:
- Operations to process SIPP microdata
- Tips imputation model in our tax data
- Post-processing calculations
The remainder of this section describes our method for imputing tips and industry of tipped workers in our tax microsimulation model. At a high level, our approach involves three steps: (1) constructing annual tipped income and industry variables in the SIPP microdata, (2) estimating a model of tips and industry conditional on economic and demographic features, and (3) fitting values based on that model in our tax microdata, benchmarking to available administrative aggregates from the IRS.
Processing SIPP data
We begin by selecting SIPP variables pertinent to our analysis: for each job held by each worker, we track wages, self-employment earnings, tips, industry, and occupation. We then aggregate these monthly characteristics into individual-level annual data, listing all jobs worked in a single year separately. For each job, we sum all earnings variables across the entire year, but also split these earnings between those earned through work for an employer and those earned through self-employment.
Estimating a model of tips and industry
We build three statistical models of tipped income characteristics using the processed SIPP microdata as training data. Models are estimated using random forests, a nonparametric tree-based machine learning algorithm that performs well in imputation settings where capturing nonlinear relationships between variables is important and overfitting is not a concern.
The first model expresses tipped status (whether a worker earns nonzero tipped income) as a function of real wage earnings, parent status, marital status, and age.
The second model expresses tip share of income as a function of real wages, estimated on a subset of data limited to those with tips only. Because we are interested in drawing from the conditional distribution of tip shares rather than assigning conditional means in our tax model, we use the quantile random forest estimator. This approach is required for accurately estimating revenue costs because the tax code contains nonlinearities which interact with heterogeneity in income. For example, consider workers with $20,000 in wages and $5,000 in current-law taxable income. Say the conditional mean tip share for this level of wages is 50%, but the conditional distribution of values ranges from 5% to 100%. If we assign the conditional mean tip share, tipped workers in this wage range will each get a $10,000 deduction, only $5,000 of which generates tax savings due to insufficient taxable income; in this case, 50% of tips will be deductible. If we instead draw from the conditional distribution of tip share, some workers will be assigned a tip deduction of less than $5,000, accurately capturing the fact that 100% of tips will be deductible for many taxpayers.
The third model expresses leisure and hospitality industry status (whether a tipped worker earns their tips from this specific industry classification) as a function of tip share of wages, real wage earnings, parent status, marital status, and age. We categorize a worker as being a leisure and hospitality worker if their tips are earned in those industries (defined as NAICS code 71 and 71). No records in our sample report multiple tipped jobs in different industries.
Benchmarking to IRS aggregates
The IRS reports cross-tabulations of W2-related variables through tax year 2018. Table 5A presents return counts and total dollar amounts by marital status. We benchmark our imputed tip variables to these figures, meaning that we rescale the probability of being a tipped worker and the tip share of wages uniformly to match these aggregates while preserving relative differences, driven by economic and demographic differences, across taxpayers.
To do so, we first fit values from the models above in our 2017 tax microdata – namely, probability of being a tipped worker and tip share of wages conditional on reporting tips. Then we calculate implied totals for number of tipped workers and total amount of tips by marital status based on these imputed values. For unmarried workers, the IRS-reported probability of being a tipped worker is about 50% larger than the SIPP-implied probability, and the IRS-reported average nonzero tip is about 15% lower than our estimate. For married workers, these figures are about 30% and 50%.
We rescale the SIPP-implied probabilities and tip shares by these respective differences by marital status. Then, to account for the fact that our jump-off project year is 2023, we scale up these probabilities by 10% (percent, not percentage points) to reflect the pandemic-era extensive-margin increase in tipping according to SIPP. Finally, we randomly draw from these distributions.
Footnotes
- Among single-job tipped workers, the median tip share is 27 percent, and only 29 percent of this group earns a tip share of at least 50 percent.
- This trend is present even when we limit our SIPP sample to wage employment rather than self-employment, the latter of which we assume would not qualify for the tax exemption. Specifically, if a worker is (mis)classified as an independent contractor and receives a 1099 from a business it is not clear that they would be able to take advantage of a “no tax on tips” policy. Some of the respondents to the SIPP may be characterizing their tips as “wage employment” even though they receive a 1099.
- For example, the Qualified Business Income (QBI) deduction is unavailable to certain taxpayers earning income through “specified service trades or businesses”, as defined explicitly in the tax code. The FICA tip credit, limited to restaurants and bars, is another example.
- This estimate does not account for any lower Social Security wage credits in the future. Any budget effect would largely fall outside the 10-year window.
- Tax Foundation estimates an income tax-only version would cost $107 billion over 10 years. The Commitee for a Responsible Federal Budget ballparks a range of $150 billion to $250 billion for a version that also exempts tips from payroll tax. Researchers at the American Enterprise Institute estimate a cost of “at least $100 billion” for an income tax deduction, and “more than twice that amount if tips were also exempted from the payroll tax”.
- While the ultimate distributional impact may also look different when including tax avoidance effects, behavioral responses are typically excluded from distribution tables because the interpretation of such results can be difficult. Tax Policy Center explains:
“By convention, TPC distributes only the static impacts of tax changes. The issue of including behavioral responses to tax changes is particularly important when dealing with changes to tax rates on realized capital gains. A reduction in the marginal rate on capital gains causes increased realizations and could lead to an increase in taxes paid. But higher realizations and the consequent increase in taxes paid are voluntary and therefore do not indicate an actual increase in tax burden—investors would not have realized the gains if doing so made them worse off. Because of this, TPC distributes only the change in taxes paid on the realizations that would have occurred in the absence of the rate change.” - Effects are likely nonlinear for larger changes, such as the 25 percentage point change we look at. All else equal, that means our results may be somewhat overstated.