
The Fiscal, Economic, and Distributional Effects of Illustrative “Reciprocal” U.S. Tariffs
Key Takeaways
-
The Budget Lab modeled an illustrative “reciprocal” tariff policy where the US matched other countries’ tariff and VAT rates.
-
The policy is the equivalent of a 13 percentage point hike in the US effective tariff rate, raising it to the highest since 1937.
-
The price level rises by 1.7-2.1%, the equivalent of an average per household consumer loss of $2,700-3,400 in 2024$.
-
Real GDP growth is 0.6-1.0pp lower in 2025. In the long-run, the US economy is persistently 0.3-0.6% smaller, the equivalent of $100-175 billion annually in 2024$.
-
The illustrative proposal raises $2.7-3.5 trillion over 2026-35 conventionally-scored, and $200-400 billion less if dynamic revenue effects are taken into account.
-
Tariffs are regressive taxes. Losses for households at the bottom of the income distribution would range between $1,000-1,300.
-
Clothing and electronics are disproportionately affected. Motor vehicles and pharmaceuticals see above-average price increases as well.
Introduction
On February 13, the Trump Administration announced a policy of “reciprocal” tariffs against US trading partners. The announcement did not yet propose a specific rate schedule, but instead laid out a timeline and principles that the Administration will consider when setting final rates on a country-by-country basis. Commerce Secretary Lutnick foresees a proposal submitted to the President by April 1, with the new tariffs going into effect April 2.
The Administration’s stated purpose for the policy is to counteract perceived unfair trade practices from foreign countries. Among the factors that the Administration will consider when setting “reciprocal” tariff rates:
- Tariffs each country imposes on US products as well as domestic VAT rates;
- Currency policies; and,
- Other trade practices.
TBL’s Illustrative “Reciprocal” Tariff Scenario
Many of these criteria are subjective and hard to anticipate. Currency policies and trade practices are often difficult to quantity and assess in a modeling setting. However, tariff schedules and VAT rates by country are well-documented. The Budget Lab (TBL) therefore modeled an illustrative “reciprocal” tariff proposal that adheres to the spirit of the February 13 announcement and incorporates just the tariff- and VAT-matching criteria. One can therefore interpret TBL’s exercise as a lower-bound estimate of the Administration’s “reciprocal” tariff principles when broadly applied.
The scenario TBL modeled made several key assumptions about the “reciprocal” tariffs:
- The tariffs go into effect April 2. In the retaliation scenario, retaliation is near-immediate.
- For any product, if a foreign country’s levied tariff on US imports is greater than the US tariff on that country’s imports, the “reciprocal” US tariff rises by the difference.
- If a foreign country has a value-added tax (VAT) or consumption tax, the “reciprocal” tariff further rises by the appropriate country VAT rate, depending on the product in question. For simplicity, TBL reduced the VAT schedule in each country to four rates: a base rate and (potential) reduced rates on energy, groceries, and tourism.
- The tariffs apply to both traded goods and services. Typically, TBL assumes US tariff proposals only apply to goods imports, but VATs generally apply to both goods and services so taken at face value, TBL assumed a VAT match must apply to services as well (for services within each country’s VAT base). Services made up only a fifth of total US imports in 2024, so the choice does not dramatically change the qualitative interpretation of the results.
TBL modeled two variations: one without any retaliation from other countries, and one with tit-for-tat retaliation by the full new tariff amount.1 TBL followed broadly the same methodology as its prior tariff analyses; the methodology is briefly summarized in the appendix.
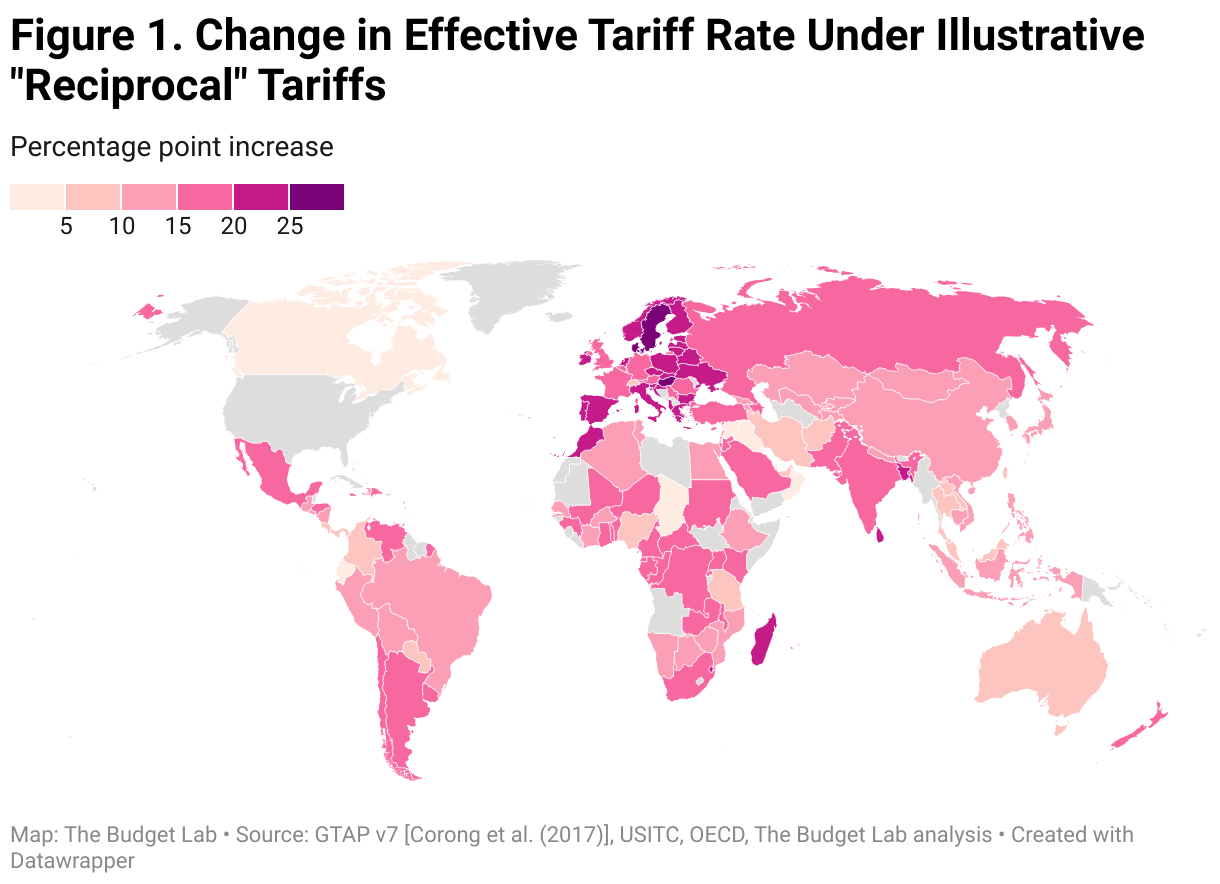
The map below shows the resulting change in the weighted average US tariff rate by country resulting from the tariff- and VAT-matching approach mentioned earlier. Some countries see only a small adjustment: notably, the average tariff on Canada only rises 5 percentage points, one of the smaller effects worldwide. China’s tariff rises by 13 percentage points, not substantially different than the 10% tariff the Administration has already levied on China. Mexico and India’s tariffs hike by 16 and 17 percentage points, respectively. The effect is the largest in Europe, driven by the Continent’s generally-high VATs. The UK and Russia go up by 20 percentage points, Denmark and Sweden by 25, and Hungary by 27.
Results
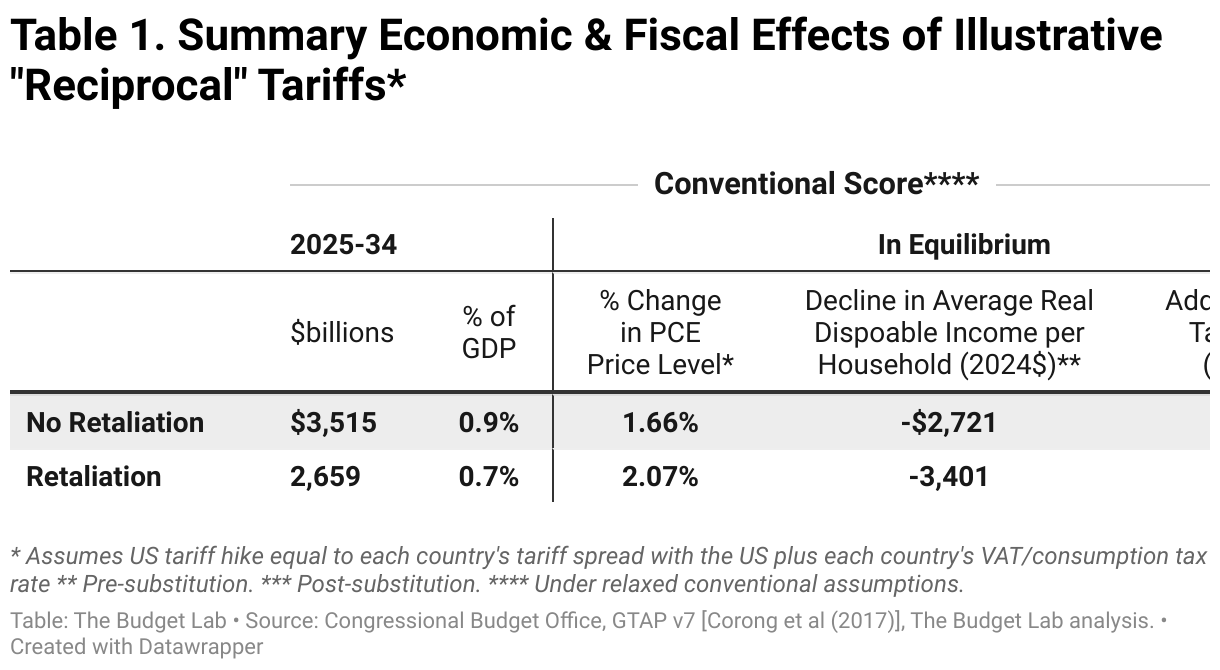
The table below summarizes TBL’s fiscal and economic results.
Aggregate price impact
Under the illustrative policy, PCE prices rise by 1.7% in the short-term if other countries do not retaliate and by 2.1% if they do, assuming the Federal Reserve does not respond (in either direction) to the tariffs’ economic effects. This is equivalent to a consumer loss of $2,700-$3,400 per household on average in 2024 dollars. These are short-run, pre-substitution effects—before consumers make the difficult choices about how to shift spending habits—which is the best way to measure the effect on consumer welfare. Post-substitution, the effect on prices settles somewhat, to 1.5-1.6%, still a $2,400-$2,600 average consumer loss per household.
Output effects
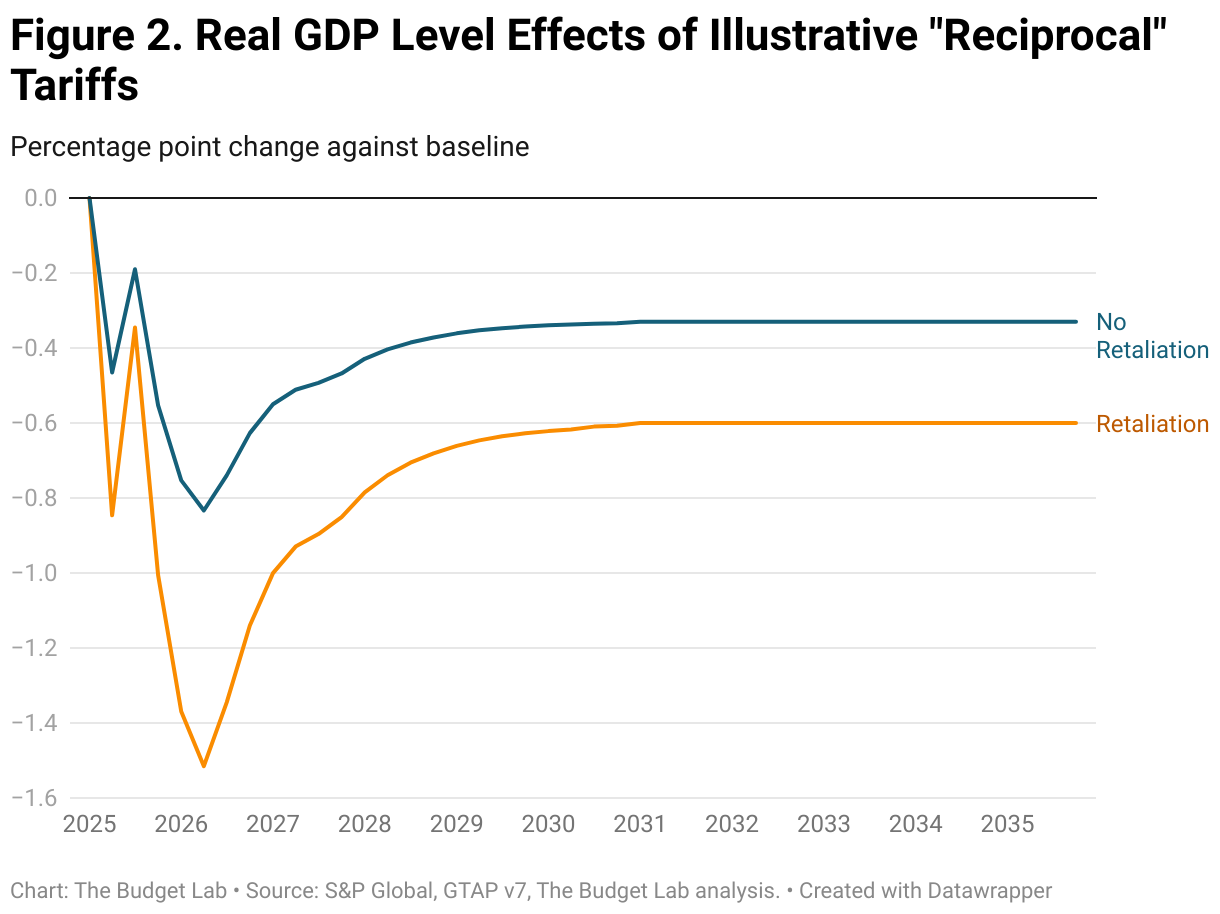
The proposal reduces the short- and long-run level of real GDP; this effect is more pronounced in the first two years after enactment. Real GDP growth is -0.6pp lower in calendar year 2025 and -0.1pp lower in calendar year 2026 without retaliation, and -1.0pp / -0.1pp lower respectively with retaliation. After 2026, the level of GDP begins to recover modestly as production and supply chains reoptimize. But in the long-run, US output is still -0.33% lower without retaliation and almost twice as much with. That’s the equivalent of the US economy being permanently smaller by $100-$175 billion annually in 2024 dollars.
Fiscal impact
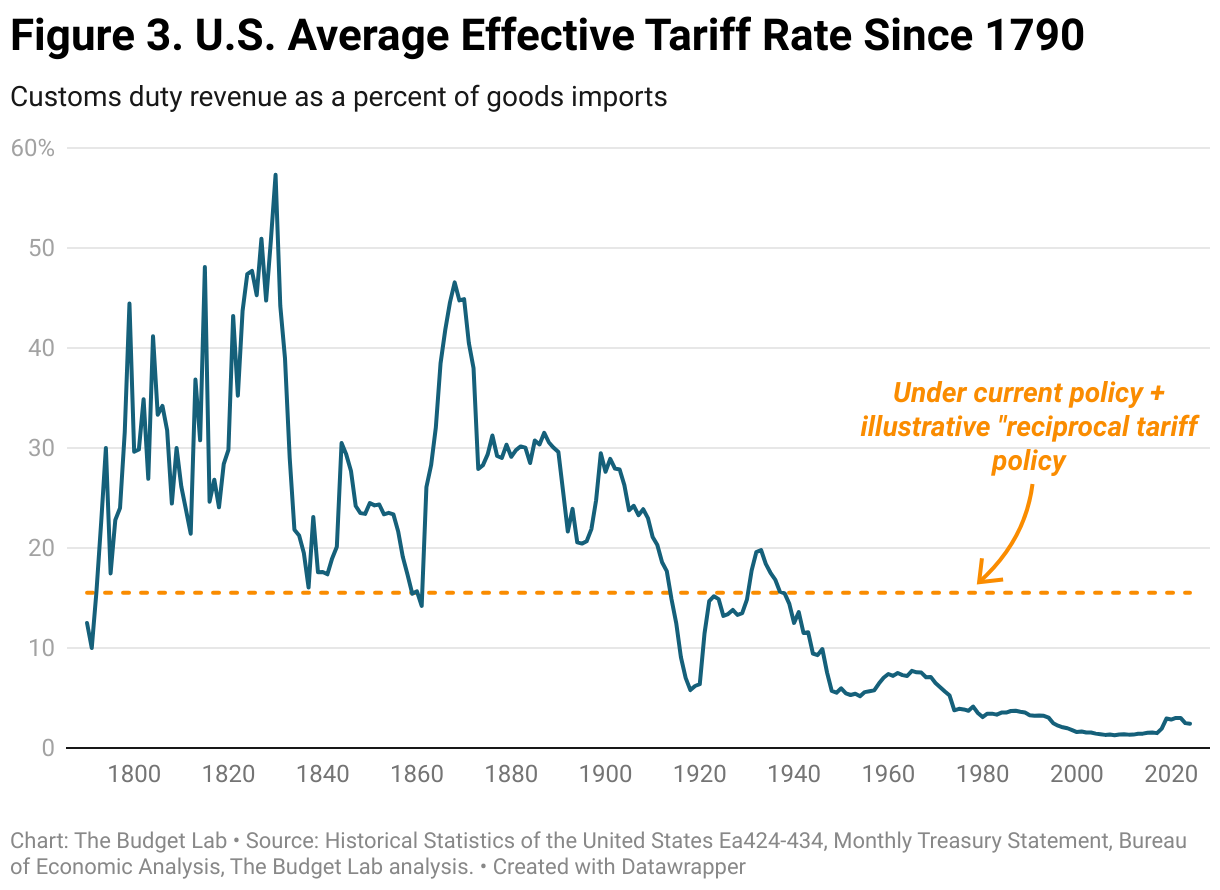
The illustrative proposal is the equivalent of a rise in the effective tariff rate of 13 percentage points, bringing it to its highest level since 1937 (see chart below). Were it to remain in place, the policy would raise $3.5 trillion over 2026-35 conventionally-scored without retaliation, and $2.7 trillion with retaliation.2
Given the negative output effects of the illustrative policy, there would be additional dynamic reductions in tax revenue as a result. Based on Congressional Budget Office rules-of-thumb, TBL estimates that these effects would range between $200 billion without retaliation to almost $400 billion with.
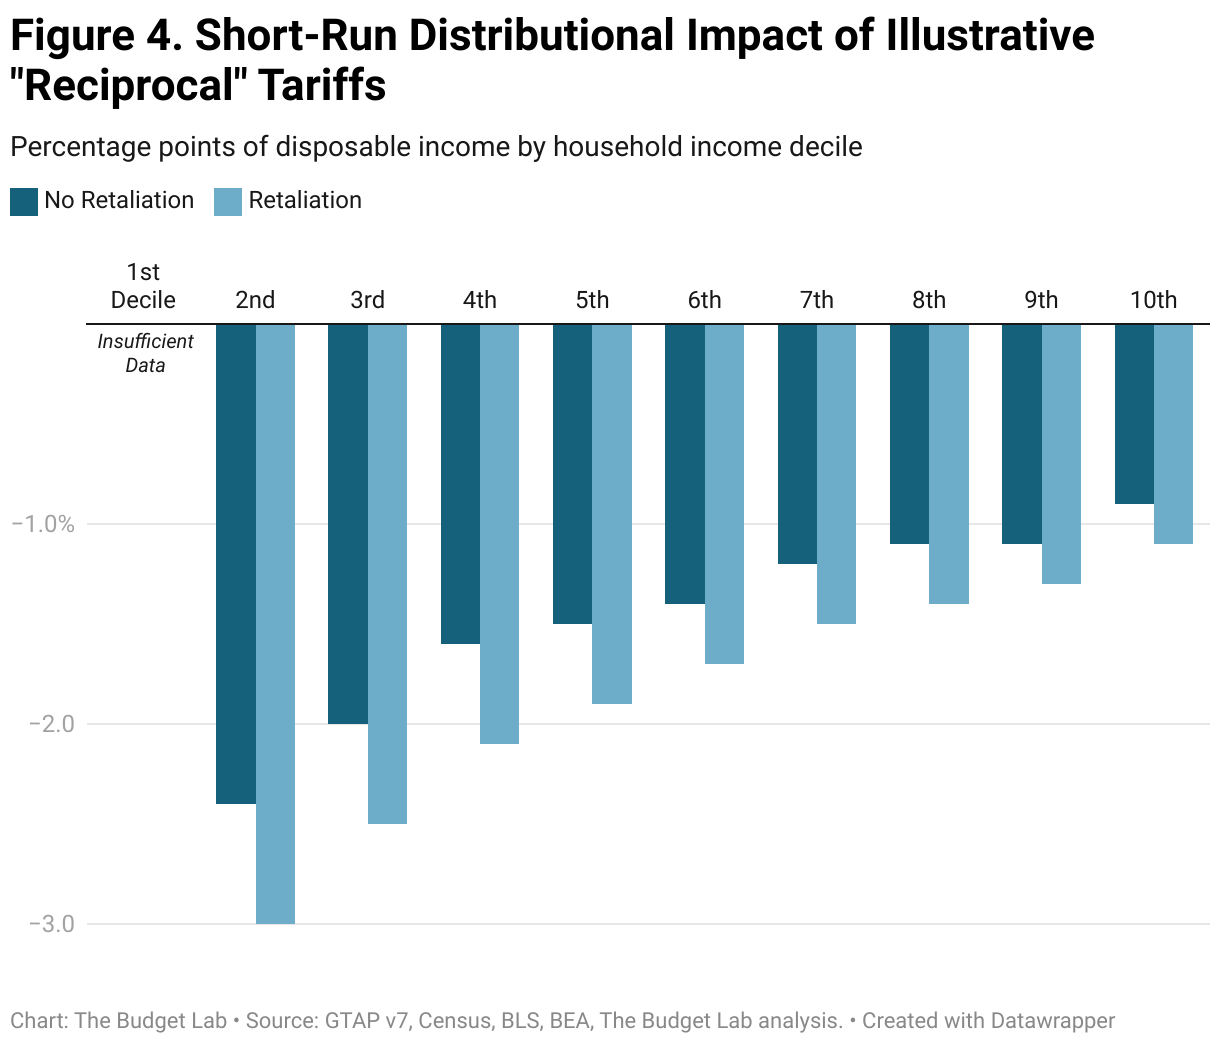
Short-run distributional impact
Tariffs are a regressive tax, especially in the short-run. This means that tariffs burden households at the bottom of the income ladder more than those at the top as a share of income. In this case, the percent change in disposable income resulting from the tariffs is almost 3x as much for households in the second decile by income as it is for households in the top decile-- -3% versus -1.1% in the case of tariffs with retaliation (see top panel of chart below).
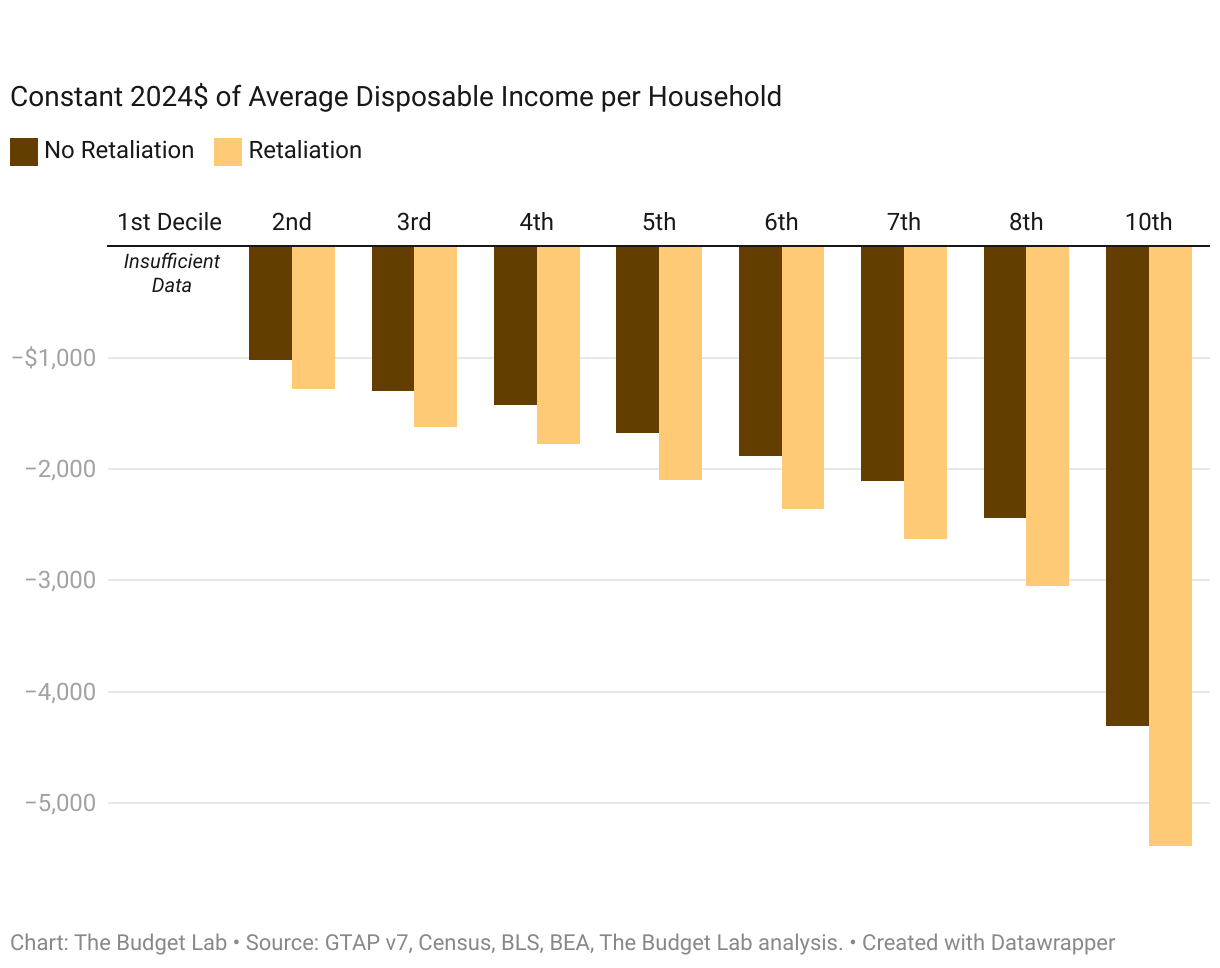
Because income rises across the distribution more steeply than the tariff burden falls, the tariff burden in dollar terms is higher at higher incomes (bottom panel). For a household in the second lowest income decile, the tariff proposal leads to consumer loss of just under $1,300 per household on average when countries retaliate. For households in the middle, the burden rises to $2,100 per household on average, and for those in the top tenth, it averages $5,400 per household.
Tariffs are more distributionally-ambiguous in the longer-run. Tariffs reduce both labor income and above-normal returns to capital, or rents. We assume that owners of capital hold rents rather than consume them in the short-run, but consume them over their lifecycle in the long-run. The implication is that the tariff burden is more regressive in the short-run and more evenly-distributed across households in the long-run.
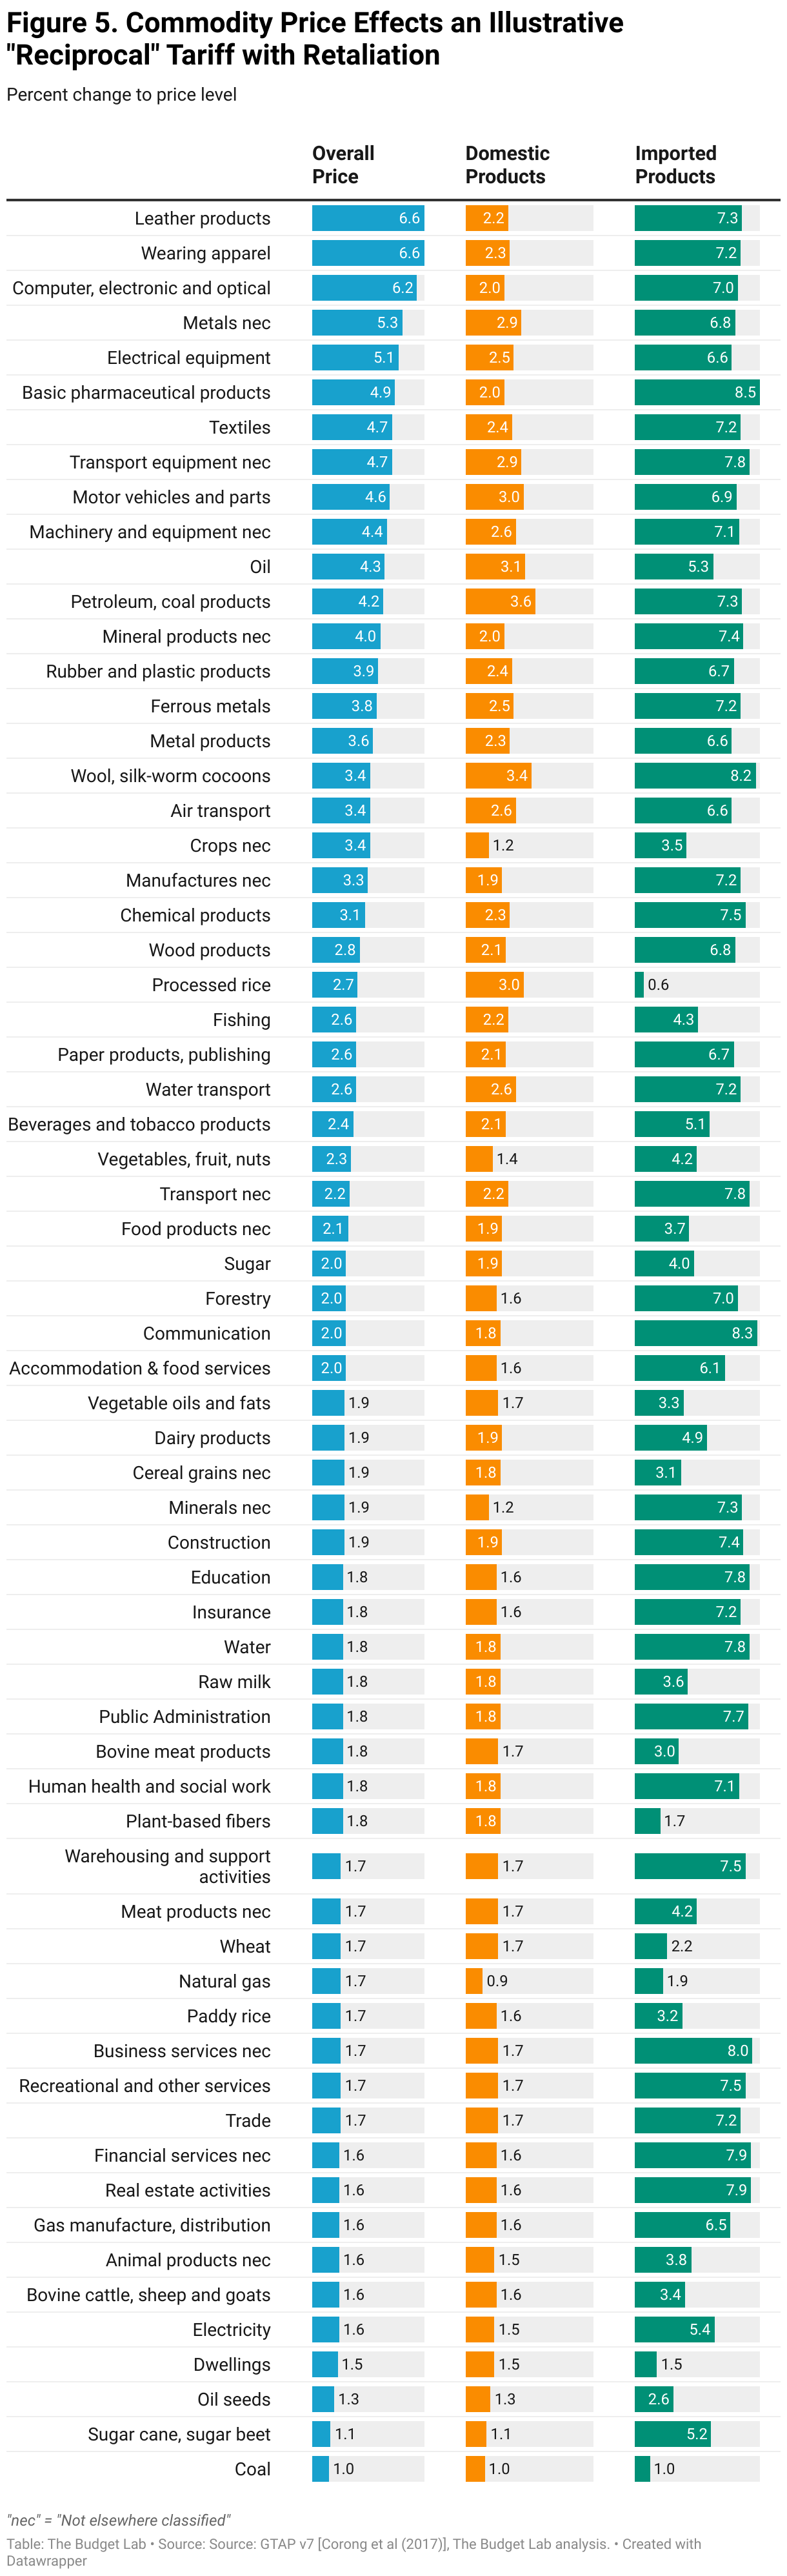
Commodity price effects
Post-substitution, the aggregate price level is 1.6% higher with retaliation. The figure below shows how that longer-run 1.6% effect breaks down by 65 individual goods and services. A few high-level observations:
- Five of the top seven overall price growth categories are electronics or clothing.
- Pharmaceuticals rise 4% in price overall, driven by an almost-7% average rise in pharmaceutical import prices.
- Energy & transportation goods are also exposed. Automobiles rise 3.6%. Crude oil rises 3.4%, while refined products including gasoline go up 3.3%.
Methodological Appendix
The Budget Lab uses a variety of tools to measure the economic impact of tariffs. The Global Trade Analysis Project (GTAP) model, version 7, provides forecasts of trade-flow changes for adjusting the composition of US trade in the wake of different tariff shocks. TBL uses these trade-flows to adjust effective tariffs for both revenue-scoring purposes as well as for price impact purposes. GTAP also provides terminal long-run GDP level effects. Short-run GDP dynamics come from the Macroadvisers US (MA/US) model, now maintained by S&P Global. In the model, TBL assumes that the Federal Reserve looks through price level effects from tariffs. The transition from the MA/US short-run path to the long-run GTAP terminal path occurs at roughly a five-year horizon. The price level effects that TBL reports come from analysis of input-output and import requirement matrices from the Bureau of Economic Analysis. TBL assumes dollar appreciation offsets the tariff effect on prices somewhat under non-retaliation scenarios; however, this is not present in retaliation scenarios. Moreover, TBL also assumes a moderate upward effect from domestic price hikes. TBL uses these I-O derived effects to scale the commodity-by-commodity price effects that come from GTAP. TBL estimates revenue effects based on the Congressional Budget Office’s January 2025 baseline projections for tariff revenues and imports. TBL multiplicatively scales CBO’s implied effective tariff rate and CBO’s import projections based on the GTAP simulation results, with further adjustments for income & payroll tax offsets and non-compliance. Dynamic revenue effects are based on TBL’s 10-year GDP path and CBO rules-of-thumb for the effects of growth on receipts. Finally, distributional analysis is based on the Consumer Expenditure Survey, a joint endeavor of the Census Bureau and the Bureau of Labor Statistics. Current tariff schedules come from USITC as well as GTAP itself. VAT rates are sourced from the OECD's Consumption Tax Trends 2024 report and the EY Worldwide VAT, GST and Sales Tax Guide 2024.
Footnotes
- TBL also simulated a scenario where other countries only retaliated to the VAT portion of the new tariffs. However, in most cases the overwhelming portion of the US tariff action is due to VAT-matching, so this alternative scenario yielded only a slightly-smaller impact than the full-retaliation scenario. For simplicity, we omit it here.
- TBL employs a “relaxed conventional” assumption for the retaliation scenario, whereby foreign income is permitted to fall but US income remains fixed.