
Long-term Impacts of the One Big Beautiful Bill Act
Key Takeaways
-
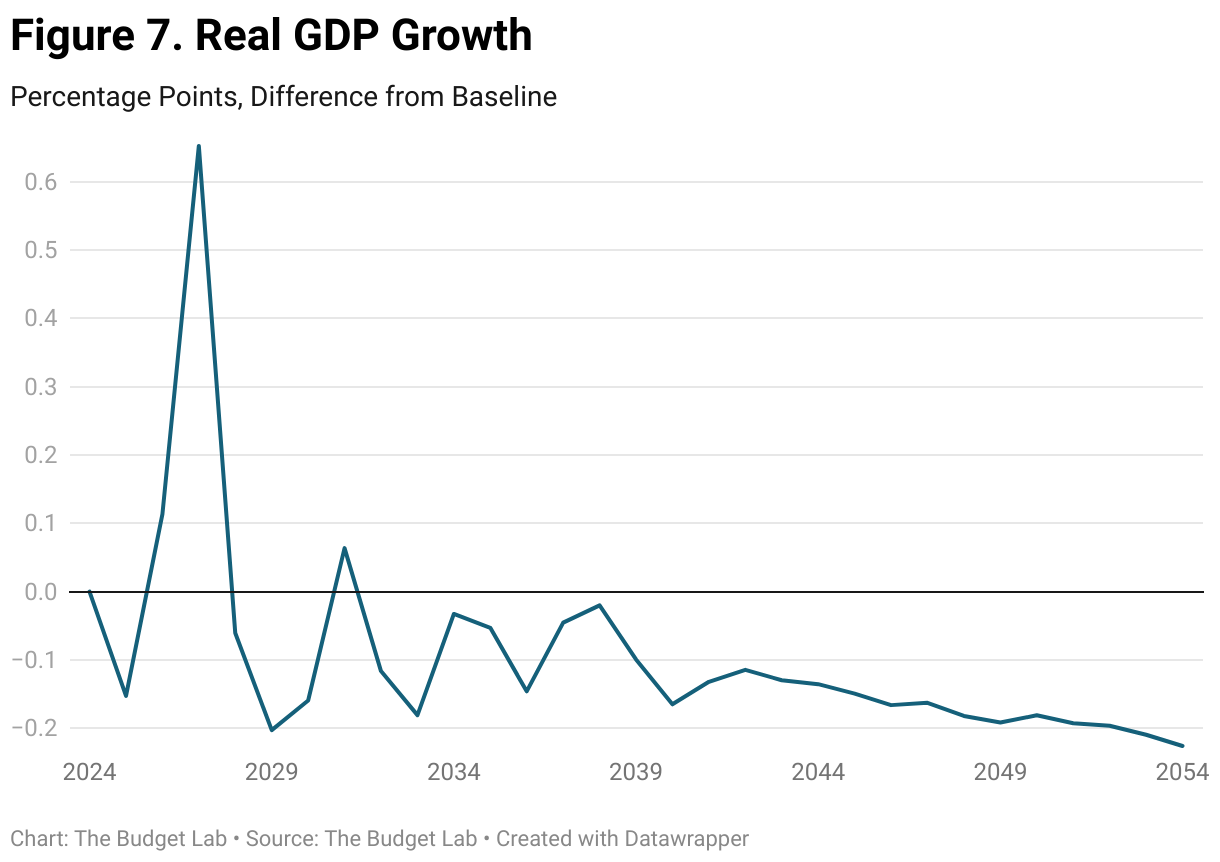
In the long run, real GDP growth slows because of the debt load from the One Big Beautiful Bill Act (OBBBA) that raises interest rates and results in crowding out. In the short run, however, there is a boost to GDP growth that averages 0.2 percentage point per year from 2025 to 2027. Thereafter GDP growth slows such that by 2054 the level of GDP is nearly 3 percent smaller than it would have been if the bill were not passed.
-
The increase in debt and deficits drives up interest rates. By 2054, the 10-year Treasury yield is 1.2 percentage points higher than it would have been if the bill were not passed.
-
By the third decade, the deficit is higher by almost 3 percentage points of GDP.
-
The increase in net interest outlays accounts for almost two-thirds of the increase in the deficit in the third decade.
-
Under passage of the bill, and accounting for the macroeconomic impacts, debt-to-GDP reaches 183 percent in 2054. If the bill were not passed, debt-to-GDP would still reach 142 percent, accounting for macroeconomic feedback.
-
On average over three decades, direct mechanical effects associated with tax-law changes, spending reductions, and debt compounding (at baseline interest rates) accounts for slightly more than one-half of the average increase in the ratio of budget deficits to GDP. The remaining portion of the average increase in deficit/GDP — slightly less than one-half — is accounted for by macro-dynamic budget impacts from higher interest rates and lower GDP.
-
Over the first 10 years, average GDP growth is functionally zero, reflecting that the small, short-term growth impacts are replaced by negative growth moving forward.
Summary
The Budget Bill under consideration on the Hill would substantially add to the debt and deficit at the same time that it contains relatively few investment-incentivizing provisions (as opposed to direct tax cuts for individuals). As such, there are few provisions that would drive economic growth in the long run as opposed to simply running up debt and generating upward pressure on interest rates.
This analysis is of the OBBBA as written. It assumes that no temporary provisions in the bill become permanent.1 Budget Lab plans to follow-up with analysis if the provisions become permanent. This analysis does not reflect the impacts of recent tariff announcements, which are the subject of other analyses from The Budget Lab.
This is an initial estimate from The Budget Lab on the macroeconomic effects of the OBBBA. We plan to refine our methodology in the future and welcome feedback on our approach.
Impacts on GDP of Passing the One Big Beautiful Bill
The macroeconomic impacts of passing the OBBBA are substantial and increase over time.2 In the short run, passing the OBBBA is more stimulative to aggregate demand than the alternative of allowing it to expire. Consequently, real GDP, income, and employment are higher, resulting in a small offset to the direct revenue loss attributed to lower tax rates. From 2025 to 2027, real GDP growth is, on average, 0.2 percentage point higher than it would have been if the bill did not pass.

However, the boost to GDP is short-lived, in part because the Federal Reserve would be expected to raise interest rates to prevent a persistent increase of inflation above 2% (while balancing that objective with the other half of its dual mandate, to promote full employment). Investors anticipate that more Fed rate hikes will occur in the future as deficits and debt grow, adding to upward pressure on bond yields.
Higher interest rates depress interest-sensitive spending relative to the expiration baseline, both directly through higher real interest rates that increase rental prices for investment and indirectly through lower equity valuations that weaken aggregate demand. In the near term, the Fed raises the federal funds rate to counteract the inflationary consequences of fiscal stimulus. After inflation is brought back to 2%, the federal funds rate rises persistently but more slowly than the 10-year yield, which is boosted by expectations of future increases in short-term interest rates. In 2054, the federal funds rate is 0.5 percentage point above baseline, versus an increase of 1.2 percentage points for the 10-year yield.
Over time, business fixed investment falls below the path that would have prevailed were the TCJA allowed to expire at the end of 2025, as the crowding-out effects exceed the stimulative effects of more favorable tax treatment of cost recovery (such as accelerated depreciation and other provisions that temporarily reduce taxes on investment). A lower trajectory for business fixed investment results in less capital-deepening, a smaller contribution to productivity growth, and a lower trajectory for potential output.3 The long-run negative growth impacts largely come from crowding out. Budget Lab considers our macro work, as with all of our work, to be an iterative process and plans to update and refine our methodology as we go.

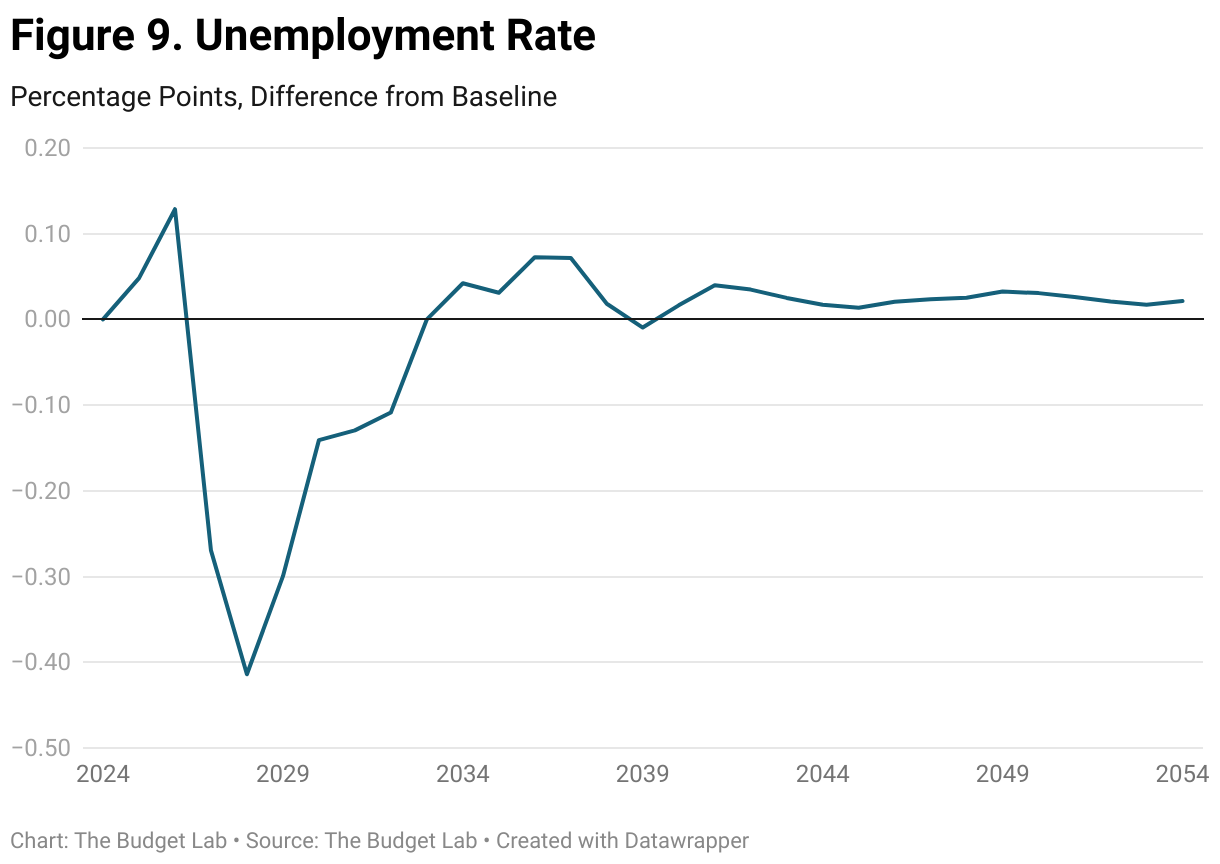
Monetary policy is assumed to be effective in keeping inflation close to 2% and the economy near “full employment” (the unemployment rate equal to NAIRU) beyond the short run, so a lower path for potential output corresponds to a lower trajectory for real GDP. In 2054, real GDP is 2.9% lower with passage of the OBBBA than in the baseline scenario.4 The decline in GDP relative to baseline exacerbates the fiscal deterioration as it reflects lower paths for taxable incomes. Consumer spending is influenced by several developments, including lower trajectories for real labor and transfer income, and for real net worth. Higher interest rates are a drag on spending for durable goods. Asset income is boosted by higher interest payments on government debt. (Please see additional graphs on the economic impacts in the Appendix.)
For monetary policy to be effective in keeping inflation at 2% (and the unemployment rate equal to the NAIRU), real interest rates are pushed ever higher in the face of a permanent net fiscal expansion. The upward pressure on interest rates is manifested in growing interest payments to holders of federal government debt, which boosts personal disposable income and consumer spending even with a substantial increase in the personal saving rate. These forces intensify as interest rates rise and debt continues to grow relative to nominal GDP.
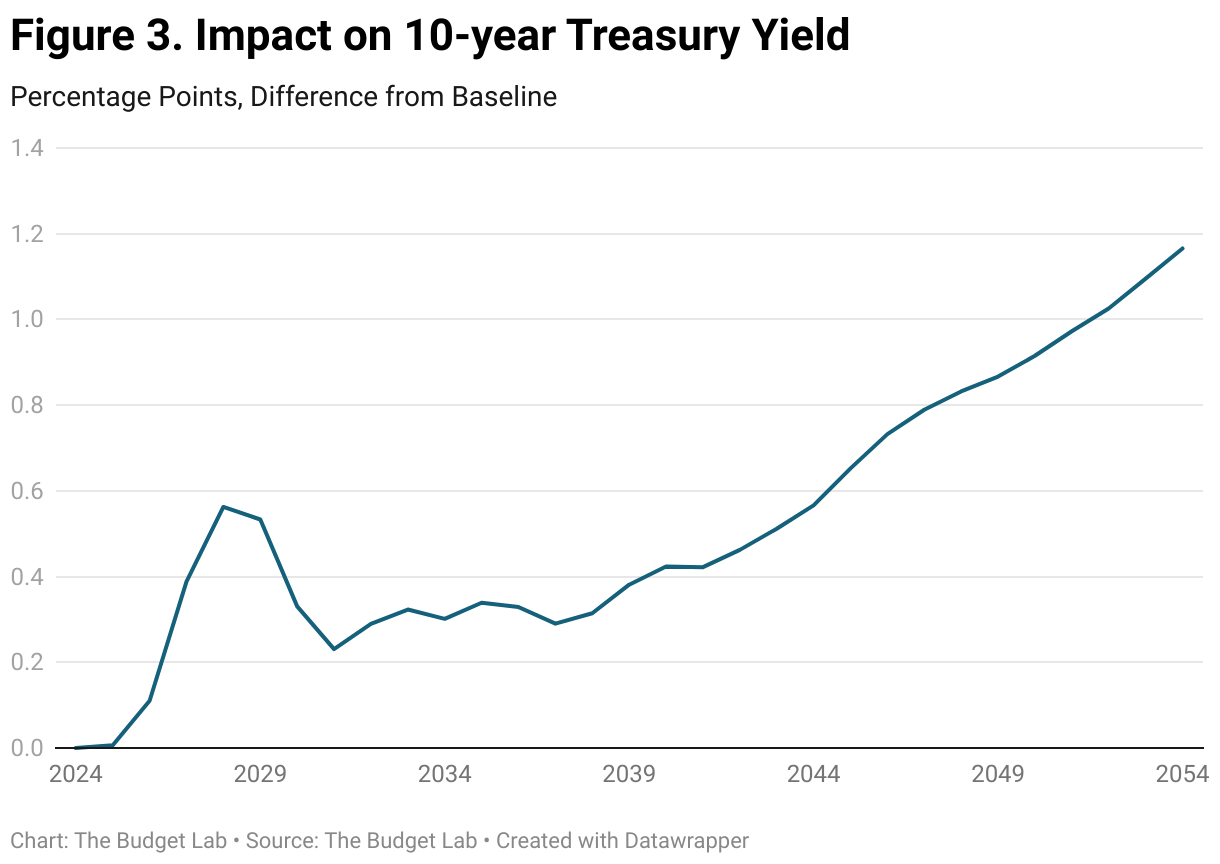
Passage of the OBBBA results in larger increases in interest rates than if all its provisions were temporary because investors expect more future debt accumulation. One feature of the upward pressure on interest rates is a notable increase in the spread between the 10-year Treasury yield and the federal funds rate. In 2054, the federal funds rate is 0.5 percentage point higher with passage. In contrast, the 10-year Treasury yield is 1.2 percentage points higher than baseline. Approximately two-thirds of the increase in the 10-year yield in the simulation, relative to baseline, is due to investors’ expectation that short-term interest rates will be pushed still higher in the future, including beyond the end of the 30-year horizon of this analysis, in order to keep inflation at 2% and the economy at full employment. A smaller portion of the increase in the 10-year yield is accounted for by an increase in the term premium — the difference between 10-year yield and the expected federal funds rate over the 10-year life of that instrument.5

Higher short- and long-term interest rates are reflected in increases in the average effective interest rate on government debt. Typically, approximately 30% to 40% of federal debt matures each year, so the average effective interest rate on government debt rises more slowly than market interest rates, such as the 10-year Treasury yield. In our simulation, the effective interest rate on debt in 2054 is 0.6 percentage point higher than if the OBBBA were not passed.
The increases in interest rates, net interest outlays, and debt stemming from passage of the OBBBA could be larger than shown here. For this exercise, we assumed that foreigners acquire federal debt in similar proportions to recent history. In contrast, if foreigners were to pare their participation in acquiring new and refinanced debt, there could be more upward pressure on interest rates. Negative crowding-out effects on investment and potential output would be larger, resulting in further deterioration in potential output and GDP. In addition, in our modeling the personal saving rate increases several percentage points, tempering the increase in private aggregate demand that would put upward pressure on GDP and inflation unless counteracted by even higher interest rates. If the saving rate rose by less than in our simulation, there would be more upward pressure on interest rates, budget deficits, and debt/GDP.
Direct and Indirect Effects on Deficits and Debt

Over the first decade (through 2034), deficits average 0.9% of GDP, with approximately two-thirds of that increase accounted for by larger primary deficits and the remaining one-third attributable to higher net interest outlays. Impacts on primary deficits and net interest outlays can be split into direct-mechanical impacts and macro-dynamic impacts.
In the first decade, changes to primary deficits as a direct result of reductions in federal outlays and changes in tax law (“mechanical effects”) account for nearly all of the increase in primary deficits. The mechanical effect of higher debt due to tax-law changes and spending reductions that, on net, raise primary deficits accounts for approximately one-third of the increase in net interest outlays in the first decade. Macro-dynamic factors, which in the first decade consist primarily of the impact on net interest of an increase in the average effective interest on government debt, account for the remaining portions of the increases in primary deficits and net interest.6 Higher interest rates can impact the primary deficit by slowing down the economy and impacting taxable income.
The importance of macroeconomic feedback on the budgetary impacts of the passage of the OBBBA increases substantially over time. In the third decade, macro-dynamic effects account for slightly more than one-half of the average increase in total deficits/GDP, with most of the remainder accounted for by mechanical effects. The increasing relative importance of macro-dynamic impacts is particularly stark in the case of net interest outlays. A higher effective interest rate accounts for three-fifths of the increase in net interest outlays in the third decade.
Averaged over the full 30 years, the increase in deficits/GDP is split about 55% due to mechanical effects and 45% to macro-dynamic effects.

A second table summarizes debt, deficits, and net interest as percentages of nominal GDP, by decade reflecting all effects, i.e., direct-mechanical and macro-dynamic, and take into account that the path of GDP is different than in the baseline, as noted elsewhere. Over the first decade, the ratio of debt to GDP rises 7 percentage points relative to its baseline trajectory. The increases in subsequent decades are significantly larger, mostly due to larger increases in net interest outlays relative to baseline. In the third decade, net interest outlays as a percent of GDP are 1.8 percentage points higher than in the baseline scenario. In the final year (2054), net interest outlays are 2.6 percentage points higher than in the baseline scenario. In 2054, federal debt rises to 183% of GDP, 41 percentage points higher than under the baseline scenario. A decline in GDP relative to baseline contributes to the increase in the ratio of debt to GDP.
Impacts on debt and net interest are shown in nearby charts.


Comparison to Other Research
If our modeling exercise were to continue beyond 2054, the ratio of debt to GDP in the following decade would average approximately 64 percentage points higher than if TCJA were allowed to expire at the end of 2025.7 The ratio of the increase in the 10-year yield as of 2054 (1.2 percentage points) to the expected increase in debt/GDP is 1.8 bps / percentage point. This calculation is appropriate to the extent that future increases in the debt are taken into consideration by investors in long-term Treasury securities. If the calculation were performed in a purely static fashion — reflecting the increase in debt/GDP as of 2054 but no further increase — the ratio of the change in the 10-year yield to the change in the ratio of debt/GDP, in percent, would be 2.8. Outside research indicates that each percentage point of increase in the ratio of debt to GDP (%) is associated with approximately 2 basis points of increase in the 10-year yield.8
Our results on the relationship between changes in debt/GDP and interest rates differ importantly from those in the Congressional Budget Office’s “extended baseline” projections. Looking beyond the first five years, when CBO expects interest rates to decline from recent levels, from 2030 to 2055 CBO projects that the 10-year Treasury note yield will decline 7 basis points. During the same span, it projects that the ratio of debt to GDP will rise 47 percentage points, to 156%. Note that there are many factors that can affect interest rates in the long-run, including factors such as the labor force that impact potential growth of output.
Issues of Long-Term Sustainability
There is an important question about the extent to which the scale of the increase in debt produced in this simulation is sustainable. As substantial as the effects are in this exercise, the economic and fiscal outcomes could be much worse in the event of a debt crisis sparked by investor pullback from the market for US government debt. Such a crisis would complicate the task of financing large deficits alongside the refinancing of growing amounts of maturing debt. In the event of a debt crisis, financial conditions would deteriorate sharply, possibly sparking a severe recession or worse. Fed rate cuts might be inadequate to the task of fighting recession and restoring full employment.9 One might imagine that, in an attempt to avoid a more severe economic weakening, monetary policymakers would undertake substantial purchases of government debt at larger scale than seen in the aftermath of the 2008-2009 financial crisis or the Covid-19 pandemic.
Appendix
In 2024 we provided estimates of the dynamic impacts for extending the individual tax provisions of the Tax Cuts and Jobs Act (TCJA) through 2054. Those estimates, described here and here, were constructed in part with the use of FRB/US, an open-source dynamic macroeconomic model maintained and used by the staff of the Federal Reserve. More recently, we have constructed estimates for extending all provisions of the TCJA, including those related to individual, estate, and business taxation, as well as other provisions in the OBBBA. For the current analysis, we developed our estimates with the use of USMM, a macroeconomic model that is maintained by and licensed from S&P Global.
Briefly, USMM is a large-scale, structural, macro-econometric model widely used for forecasting and policy analysis by S&P Global and by clients in the private and public sectors. Relative to FRB/US, USMM contains a more detailed modeling of the government sector, including separate treatment of the Federal and State & Local sectors; it includes a wider variety of tax rates and revenues; and more detail for government expenditures. These features aid its suitability for long-term macro/fiscal analysis. We will publish an updated analysis of our simulation methodology using USMM, including relevant model features, in a subsequent report.
Current-Law Baseline
For purposes of the estimates described in this report, we analyzed the impacts of enacting the OBBBA relative to a 30-year baseline scenario constructed at The Budget Lab. Our baseline scenario is similar to CBO’s “extended baseline” in several respects. Like CBO’s, it is a “current law” projection. It utilizes the same population and demographic assumptions; it is based on the same estimate of the NAIRU; and it reflects credible monetary policy that keeps inflation at the Fed’s 2% (PCE) inflation target and unemployment close to the NAIRU. The size of the labor force is virtually identical to CBO’s projection. The baseline was constructed to generate paths for federal government revenues and noninterest outlays that are close to CBO’s extended baseline, so primary deficits are similar. In our baseline, we allow the Fed to respond by lowering interest rates at the time that the TCJA expires in 2026, to minimize departures from 2% inflation and full employment. Therefore, interest rates in our baseline are lower, temporarily, than in CBO’s baseline, before rising back to be similar to CBO’s projections for several years.
In the baseline beyond the short run, we allow increases in the ratio of debt/GDP to be reflected in moderately higher interest rates as the Fed continues to target 2% inflation and unemployment at NAIRU. For example, from 2030 to 2054, our baseline shows the 10-year yield rising 13 basis points to 4.20%. This contrasts with CBO's extended baseline, which projects that the 10-year Treasury yield declines 7 basis points to 3.78%.
Additional Graphs


Footnotes
- Our analysis of the OBBBA is relative to a long-term baseline we constructed that is broadly similar to CBO’s extended baseline. Please see the Appendix for more information.
- This analysis is done relative to a current law baseline. Please see a fuller discussion in the Appendix.
- In our modeling, there is no material long-run impact of passing the One Big Beautiful Bill on the labor force, so lower productivity growth through capital-shallowing translates into lower growth of potential GDP. Monetary policy is assumed to be effective in keeping the unemployment rate at the NAIRU beyond the short run, so the path of real GDP mirrors the path of potential in the long run.
- Nominal GDP is 1.8% lower than baseline in 2054, a smaller decline than for real GDP that reflects a temporary increase in inflation in the first few years after passage that results in a small, permanent increase in the price level.
- As of 2054, when the 10-year yield is 1.2 percentage points above baseline, the average expected federal funds rate over the subsequent 10 years is 0.7 percentage point higher. The term premium — the difference between the 10-year yield and the average expected short rate — is 0.4 percentage point larger.
- A final contribution to differences in ratios of deficits/GDP between the OBBBA and baseline scenarios is due to the mathematical effect on ratios of a lower trajectory for nominal GDP in the former than in the latter. The mathematical contribution from this source is small, rounding to an average of 0.0 percentage point of debt/GDP over the full 3 decades and -0.1 percentage point of deficit/GDP in the final decade.
- To put this estimate in context, we project that if the OBBBA were enacted, the ratio of debt/GDP in 2054 would be 41 percentage points higher than in the baseline. Therefore, the estimate cited in the text that the ratio of debt to GDP would continue to rise beyond 2054 an average 64 percentage points above baseline over the decade from 2055 to 2064 represents an increase relative to 2054 of 23 percentage points.
- See Neveu, A., and J. Schafer, “Revisiting the Relationship Between Debt and Long-Term Interest Rates,” CBO Working Paper 2024-05, December 2024; and Laubach, T. “New Evidence on the Interest Rate Effects of Budget Deficits and Debt,” Journal of the European Economic Association, vol. 7, no. 4 (June 2009), pp. 858–885.
- The Fed’s task would be further complicated if the dollar were to weaken, pushing up import prices and inflation. The goal of keeping inflation and inflation expectations anchored at 2% could inhibit the Fed from focusing more fully on offsetting recessionary forces sparked by a debt crisis.