
Short-Run Effects of 2025 Tariffs So Far
Key Takeaways
-
Tariff Revenue: New 2025 tariffs have raised $88 billion in revenue year-to-date through August so far, with the new tariffs responsible for about $23 billion in revenues in August alone.
-
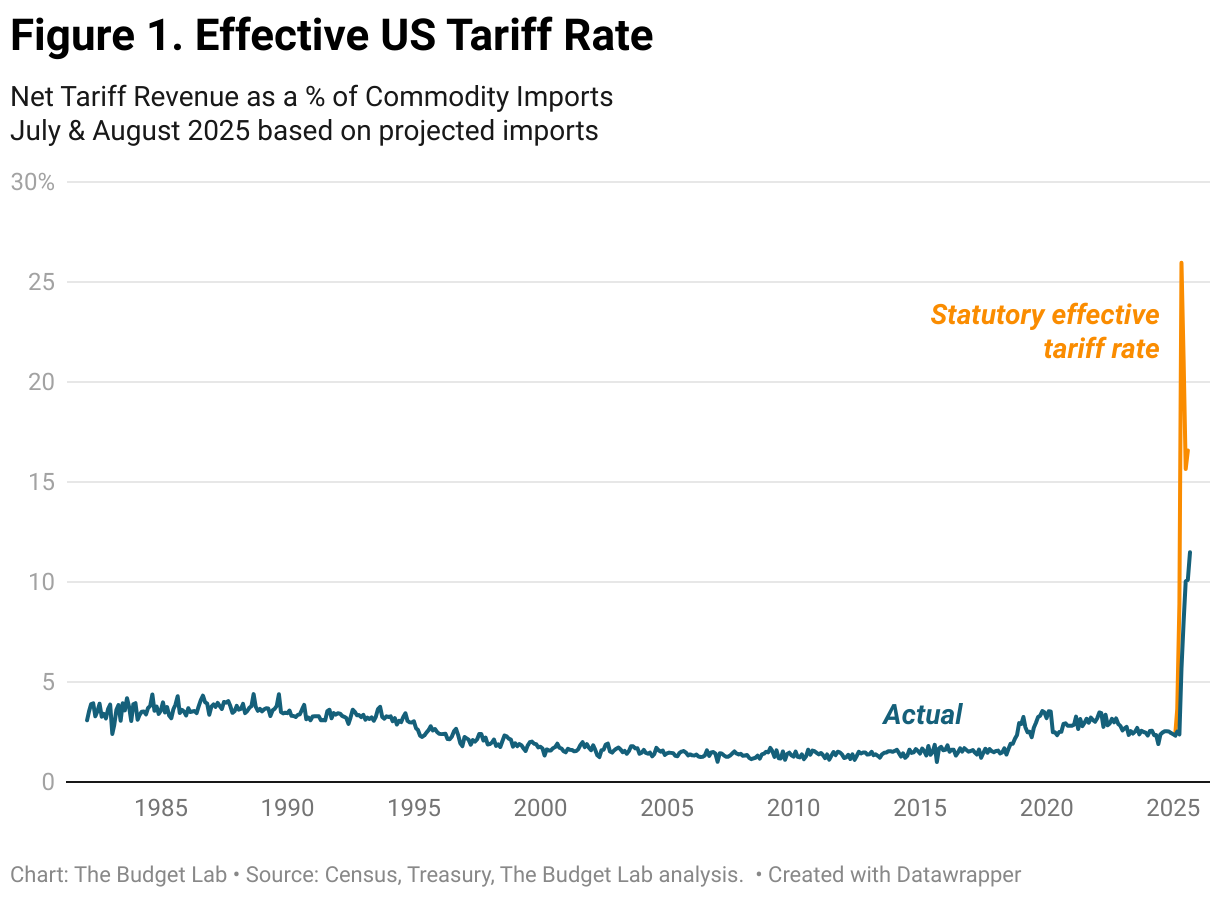
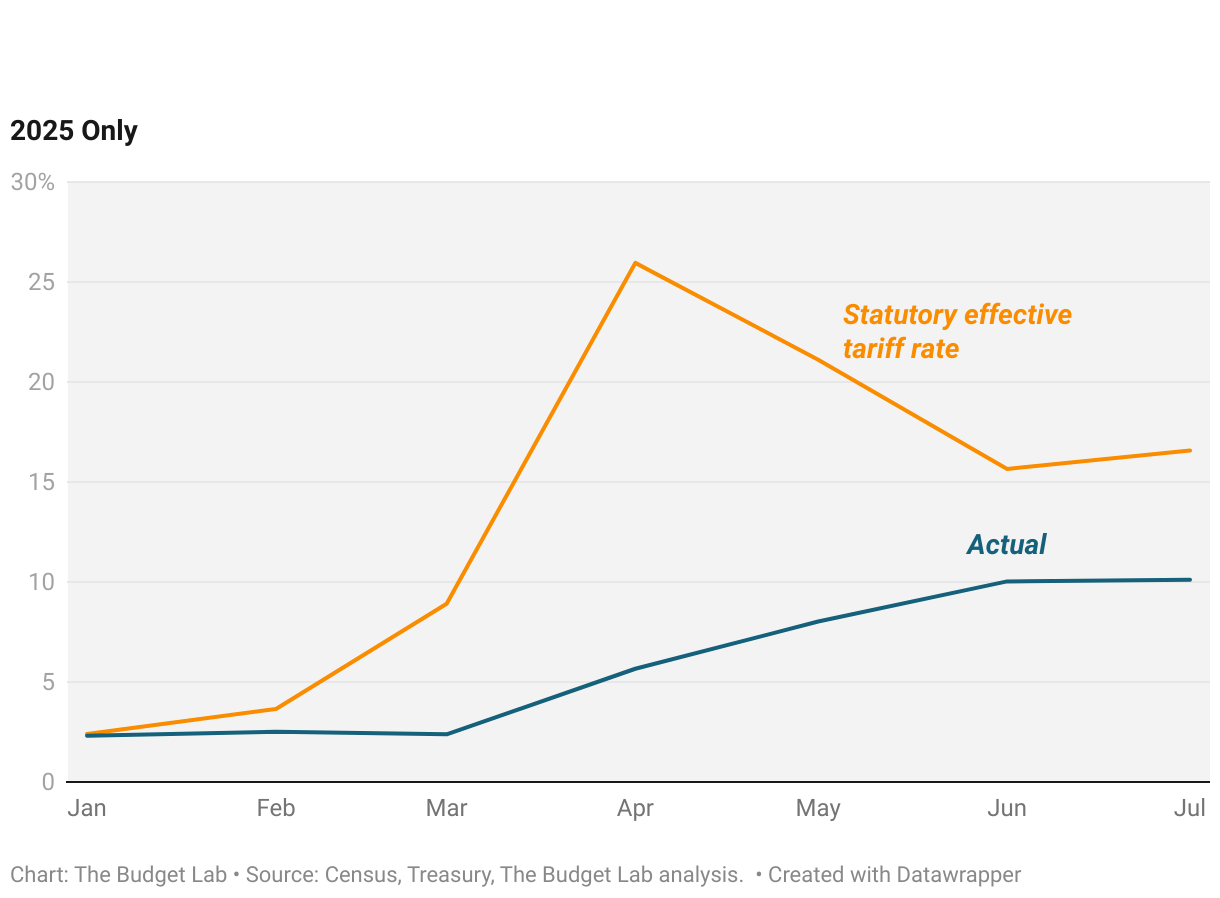
Tariff Rates: The actual average effective tariff was 10% in June and likely about 10% and 11.5% in July and August respectively, versus 2.4% at the beginning of the year. This is lower than the 15.7%, 16.6%, and 18.2% statutory tariff rates those months respectively.
-
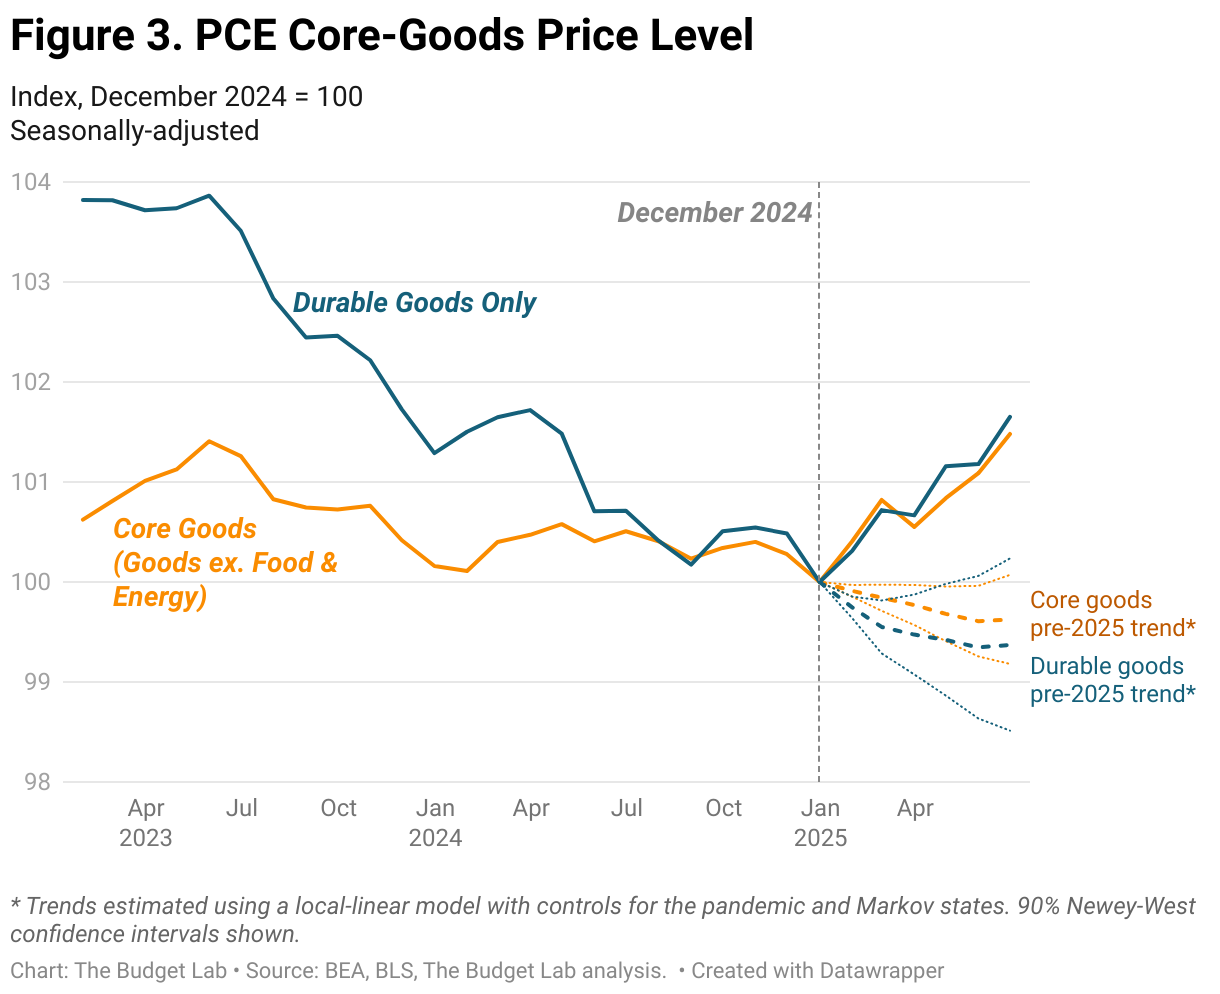
Goods Prices: There is suggestive evidence that tariffs are raising goods prices. Core goods prices were 1.9% above pre-2025 trend as of June, with window & floor coverings, appliances, and electronics particularly elevated. There is no evidence of global factors significantly affecting US goods prices. Some tariff-sensitive goods like apparel are still seeing price levels at or even below trend.
-
Services Prices: A possibility is that services prices could have weakened due to substitution or macroeconomic frictions induced by tariffs. But so far services prices are not significantly lower than expected, suggesting they are not yet offsetting higher goods prices due to tariffs.
-
Consumer Passthrough: In June alone, TBL estimates 61-80% of the new 2025 tariffs were passed through to consumer core goods prices, roughly in the middle of prior studies around consumer price passthrough.
-
Markets: After falling as much as 15% through early April, the S&P 500 is now up nearly 10% since December 31. While many factors are weighing on markets, this suggests that any potential long-run profitability worries from the new tariff regime are not dominating market pricing.
-
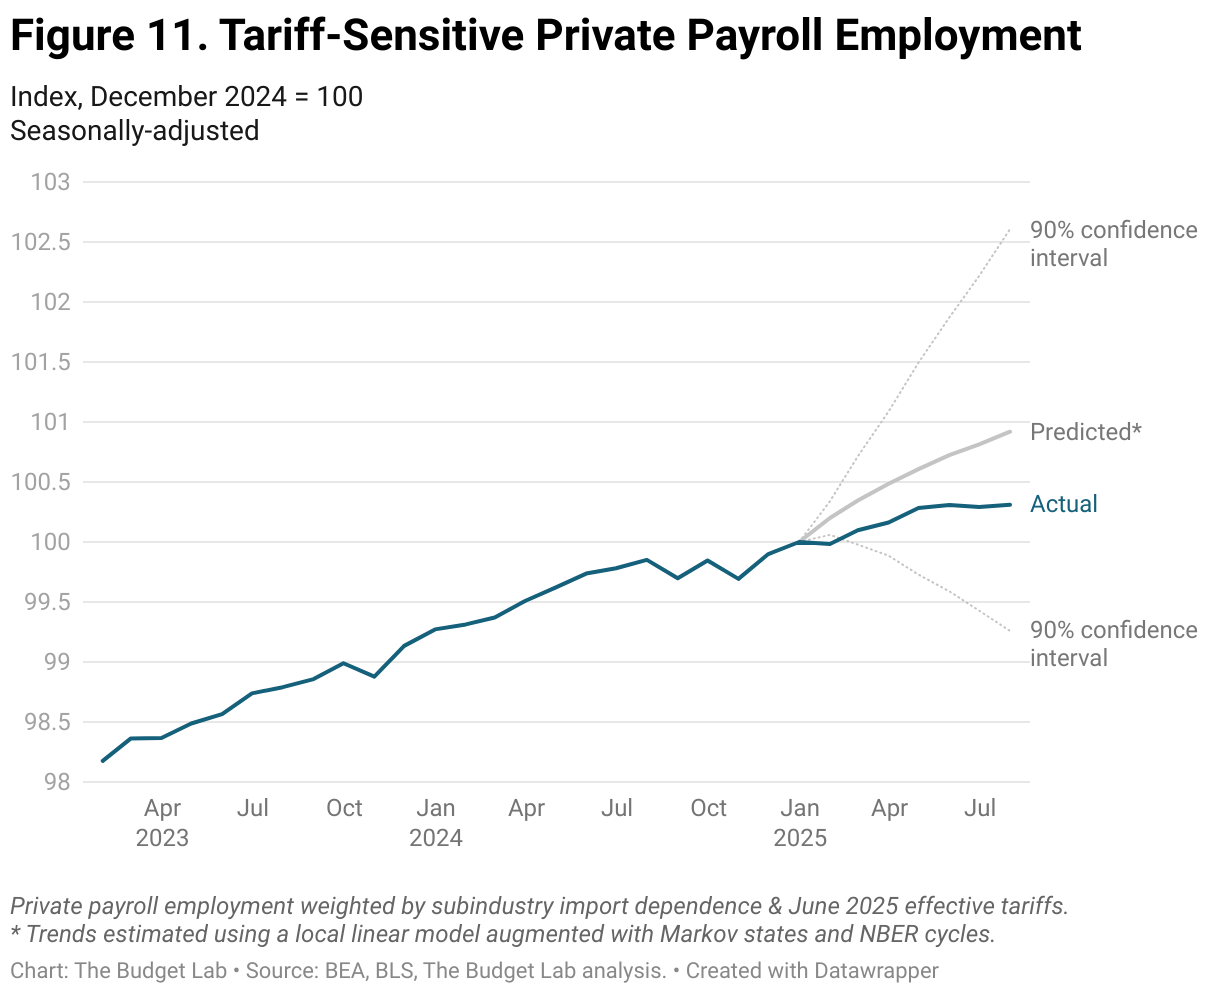
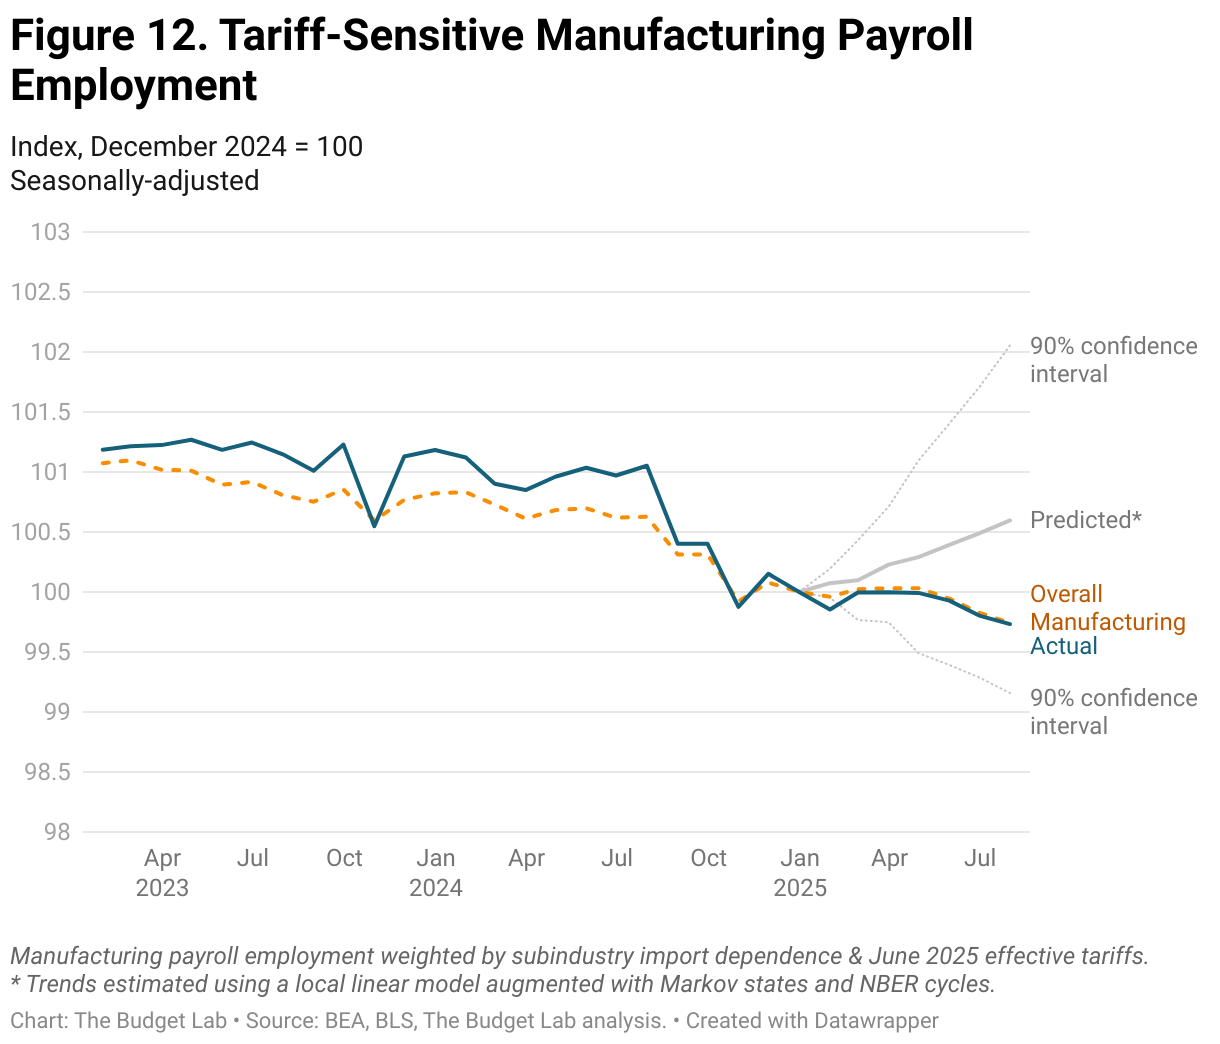
The Labor Market: Tariff-sensitive employment has grown so far in 2025, albeit by less than pre-2025 trend would have suggested; the difference is not significant. Tariff-sensitive manufacturing employment has fallen slightly year-to-date but at the same pace as overall manufacturing. There have been decelerations or even declines in certain private service sectors as well with minimal tariff-sensitivity, such as health care and professional & business services.
-
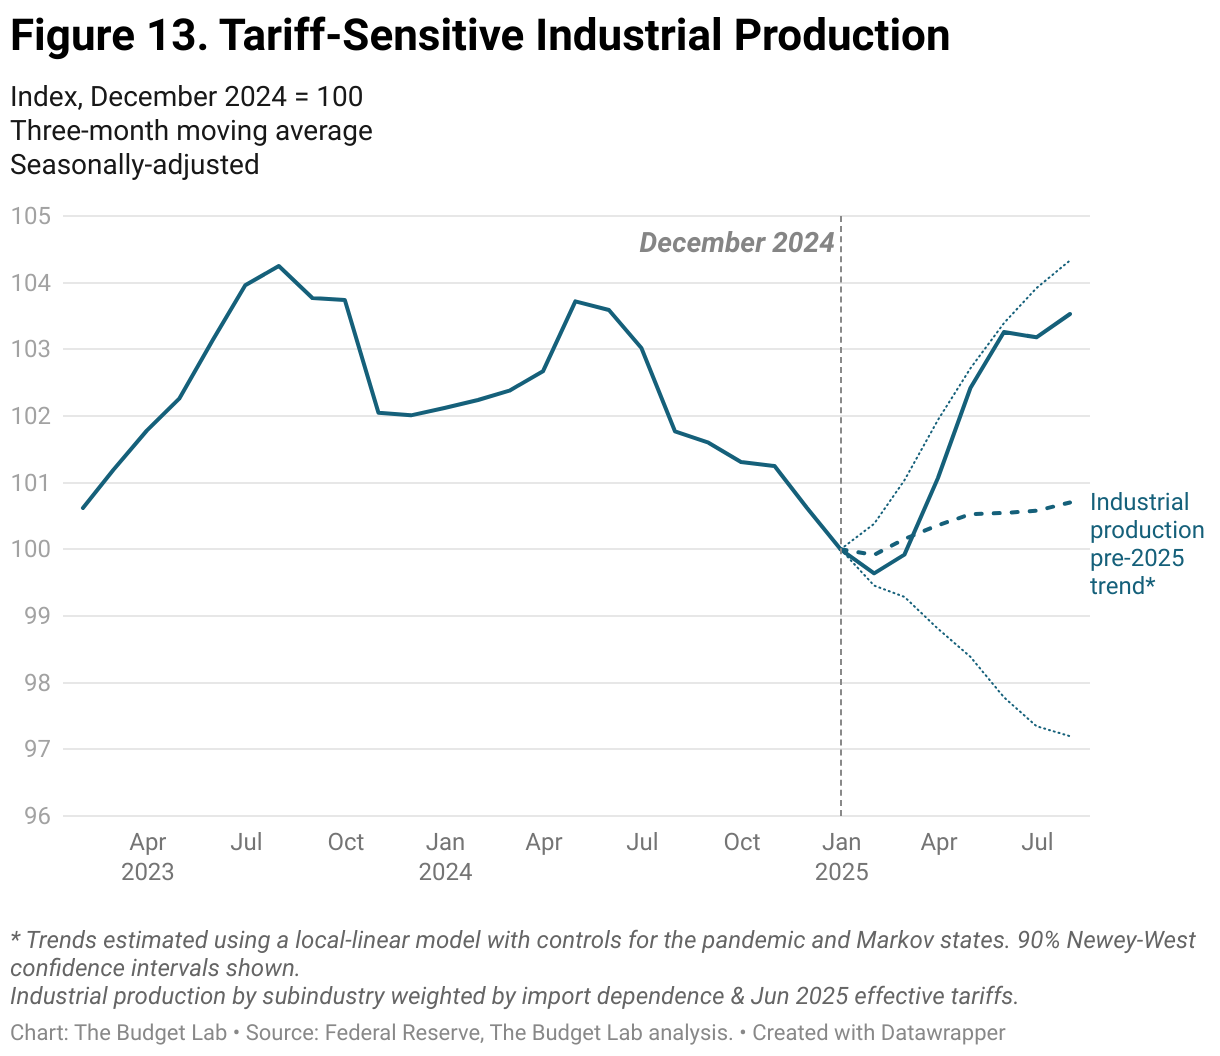
Industrial Production: Industrial output in tariff-sensitive industries has risen sharply year-to-date by 3.5%, returning to early-2024 levels.
-
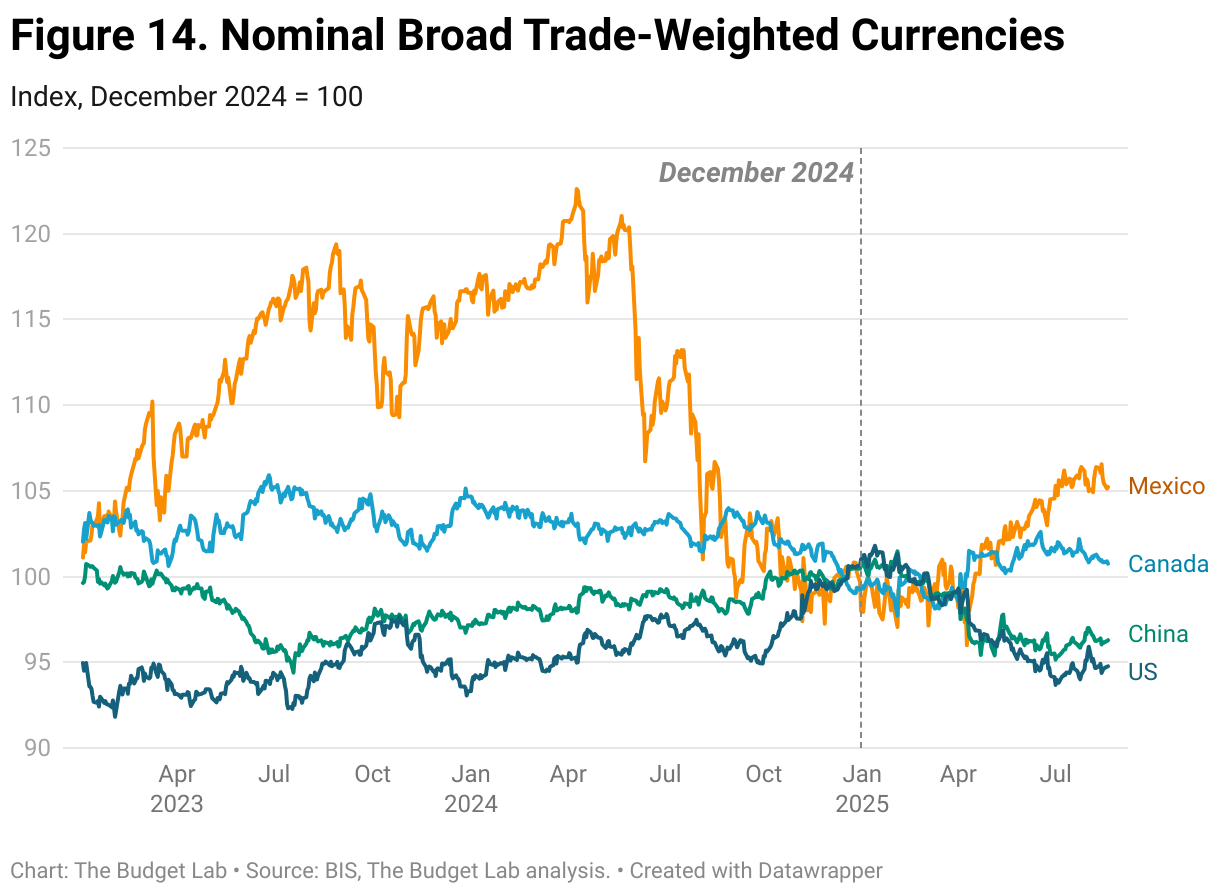
The Dollar: The dollar has weakened appreciably, down more than 7% since December and down ½% from a year ago. This is the opposite of what theory would predict in the face of higher tariffs, all else equal, suggesting other downward pressures are dominating this upward effect.
-
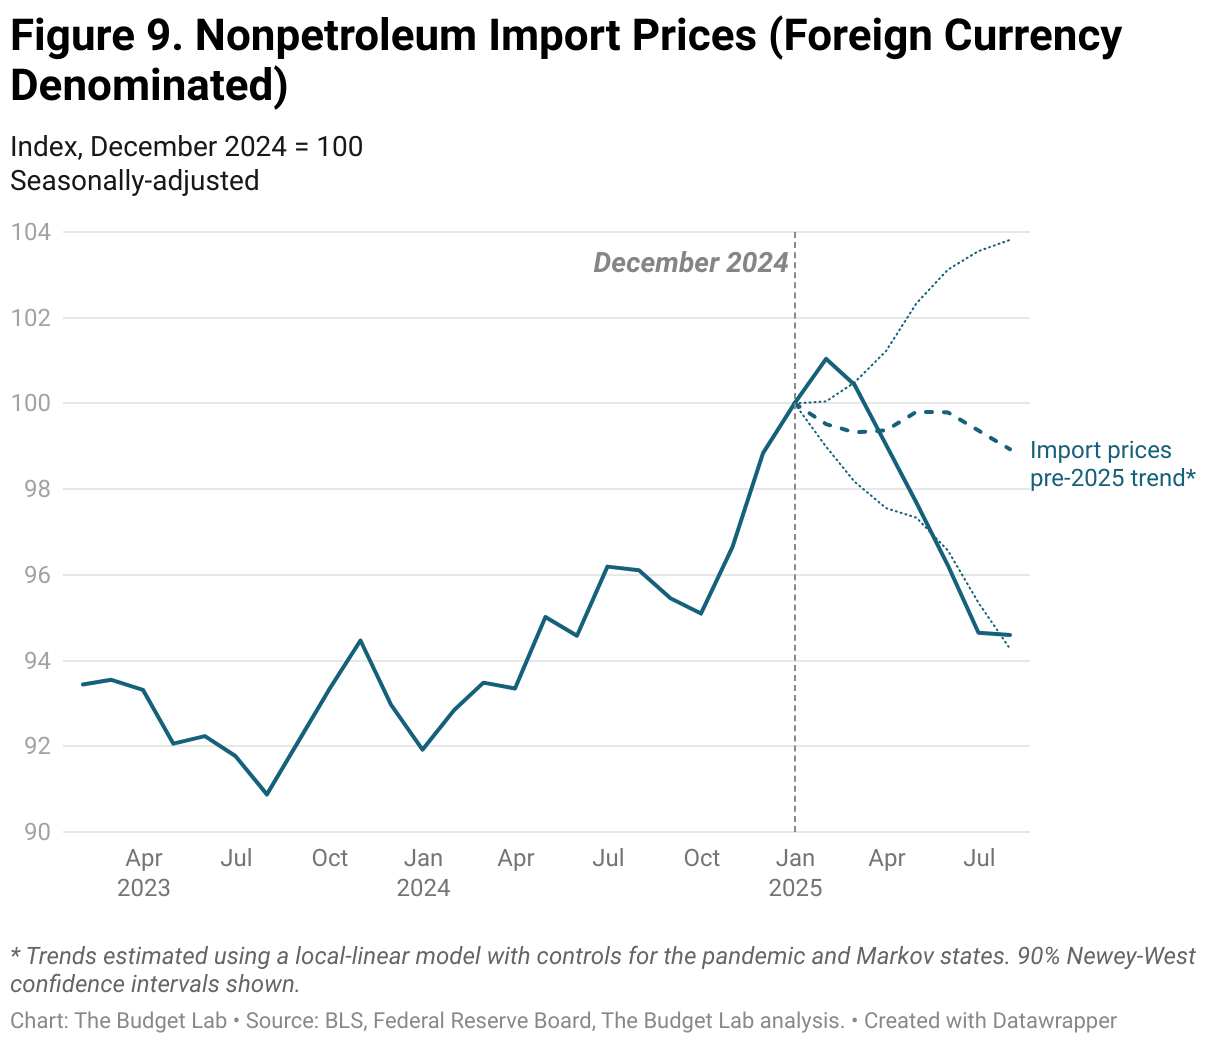
Import Prices: Dollar-denominated import prices excluding tariffs have risen year-to-date and are slightly above pre-2025 trend. Foreign-currency-denominated import prices rose quickly at the end of 2024 and have been falling over 2025 year-to-date so far, but still only returning to mid-2024 levels. This suggests foreign producers are not absorbing much if any of the US tariffs, consistent with prior economic research.
-
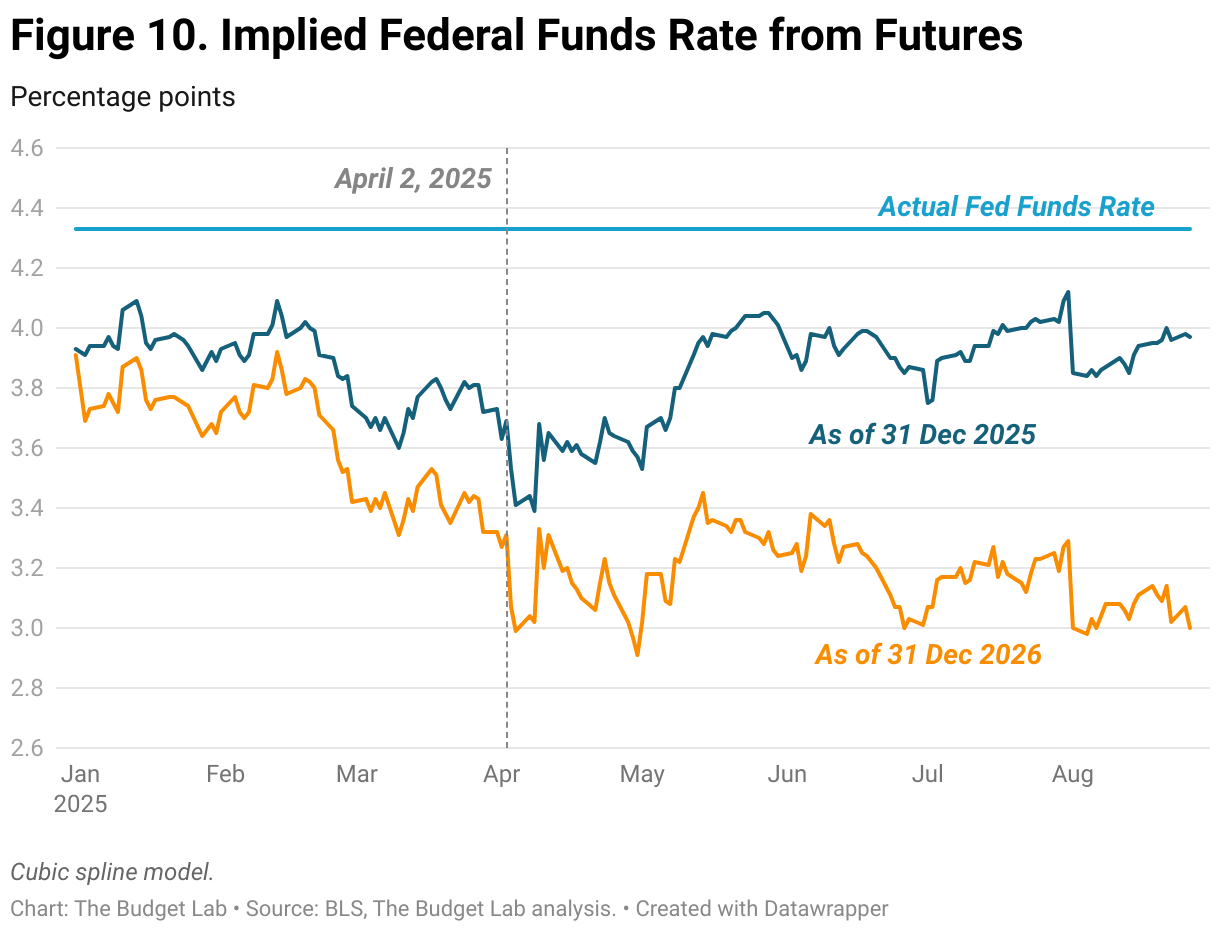
Federal Reserve Policy: The Fed itself has signaled one less cut in 2026 (i.e. higher interest rates) than it forecast last December, but markets expect meaningfully lower interest rates by the end of 2026 than they were forecasting at the beginning of the year. Many factors beyond tariffs are affecting Fed policy, but this suggests tariff anxiety is not dominating market expectations.
-
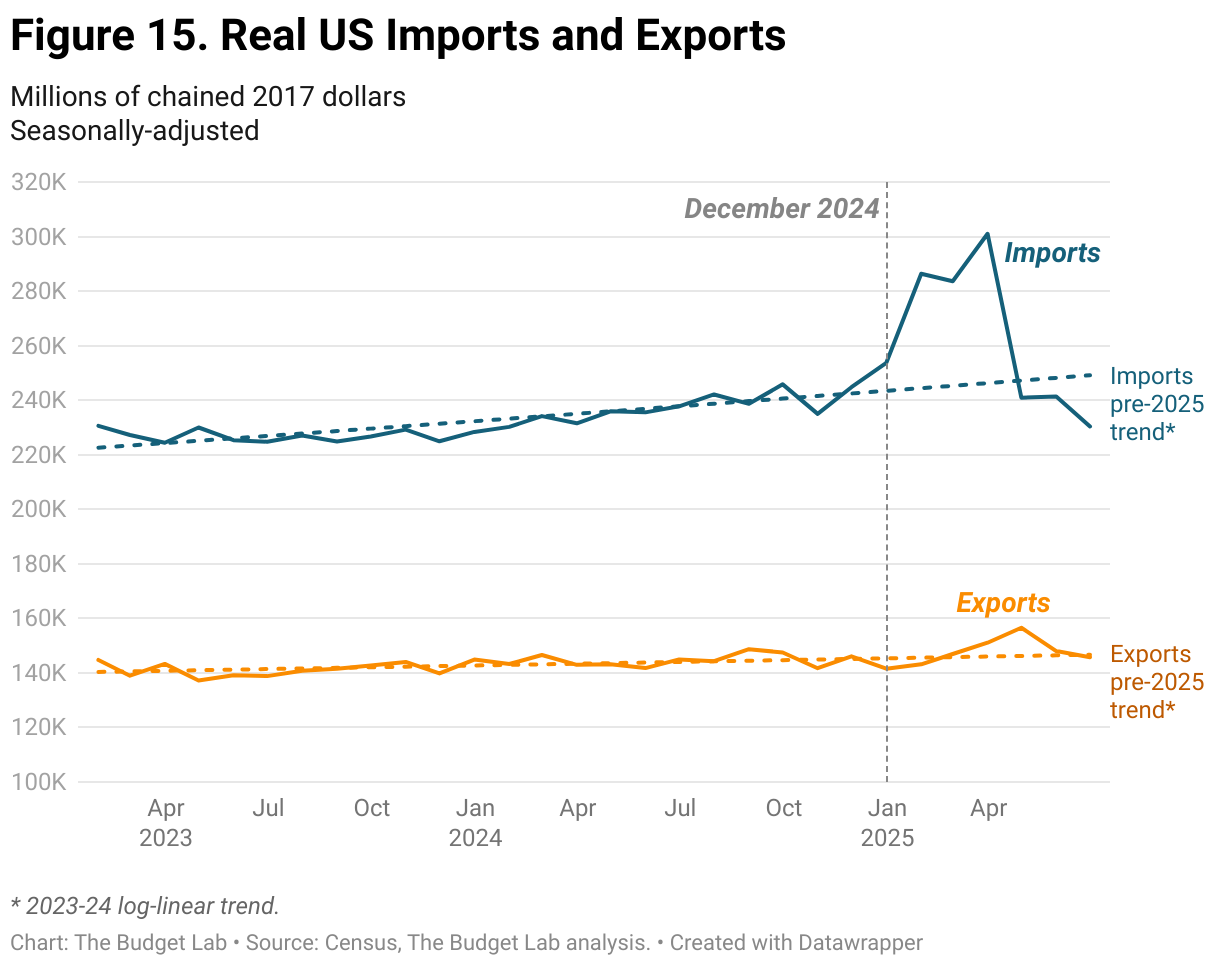
Trade: Real imports rose after the tariff announcements — as consumers and business sought to front-run their implementation — and then plunged in April; they are 7% below trend as of June, while exports are 0.6% below trend.
Introduction
In response to new tariff announcements, The Budget Lab regularly estimates fiscal and macroeconomic effects resulting from policy; TBL published its latest update August 7. These analyses rely on projections from well-respected economic and trade models, including the MA/US model (currently maintained by S&P Global) for short-run analysis and the Global Trade Analysis Project (GTAP) model for medium/long-run analysis.
However, economic models — even high-quality ones like those used by TBL — make assumptions about the economy and may struggle in periods of high uncertainty or in periods that look significantly different from past history. The current statutory average tariff rate is the highest since the early-1930s, so the current policy regime certainly qualifies as extraordinary. In such unique times, it can be helpful for economists to take stock in real time about what they have learned and how their prior assumptions are holding up.
This report is an empirical look at actual incoming economic data so far — on revenues, prices, trade, and market expectations — to give a snapshot of the short-run effects, if any, of tariffs so far this year, positive or negative. There is suggestive evidence of tariff effects along a number of dimensions, though there is still much uncertainty. Some of these effects are consistent with prior expectations: revenues are higher, for example, and good prices have generally accelerated from their pre-2025 trends, though neither has occurred yet to the extent we would project under fully-phased-in policy. Some effects are counter to what we would have expected: the dollar is weaker, for example, while the currencies of many of the targets of our tariffs have appreciated. And in some cases, such as labor market effects, evidence one way or another is mixed or weak. It is still early and the effects of tariffs may evolve and change over time as consumers, businesses, and policymakers respond.
Revenues & Effective Tariff Rates
Tariffs are a tax on imports, therefore higher tariffs will increase revenues if their effect on imports is not sufficiently prohibitive. The 2025 federal budget deficit therefore is lower than it would be otherwise without the 2025 tariffs. TBL estimates that the US has raised $146 billion in total net customs duty revenues in calendar year 2025 so far through August. This total stems from all US tariffs, not just those adjusted in 2025. Before the 2025 tariff announcements, the average effective US tariff rate was 2.4% which raised about $7 billion a month in net customs duty revenues. The new 2025 tariffs have raised roughly $88 billion in revenues so far, with about $23 billion of that new tariff revenue posted in August alone when the average effective tariff rate was likely 11-12%, up from 10% in June and July. This comes to roughly 0.8% of GDP each month, a meaningful amount of deficit reduction.
By the same token, the new tariffs are raising a bit less revenue than would be expected given where policy has been set. One way of illustrating is comparing actual to expected revenues. TBL projects that new 2025 tariff policy as of August 6 would be expected to raise an additional $29 billion per month in net tariff revenues,1 but as mentioned above, actual revenues in August will likely be $23 billion higher, about a fifth less than we would project given current statutory tariff rates.
Another way of illustrating this is in terms of the average effective tariff rate. TBL projects that imports in August reached $267 billion, implying that the $23 billion in new 2025 tariff revenue that month raised the effective tariff rate by 8.8 percentage points from where it would have been under 2024 policy. But the policies in place in August implied a statutory, fully-phased-in tariff rate that “should” have been 16.2 percentage points higher.
This is not entirely surprising however, for many reasons. First of all, several factors can cause delays in tariff revenues being fully realized. Consumers and business time very-short-run purchases to try to minimize tariffs, such as by front-running them before they take effect. This can reduce the amount of imports of higher-tariffed goods & countries for a time. As the Congressional Budget Office mentions, tariff policy changes also seldom apply to goods already in transit to the U.S., with shipping sometimes taking a few months, and importers can delay payments by up to six weeks under the Periodic Monthly Statement program. Customs and Border Protection remits the tariff revenue it collects with a lag to Treasury, such that much of the revenue counted one month represents customs duties collected the month before and can cause a misalignment between revenues and imports for a given month.
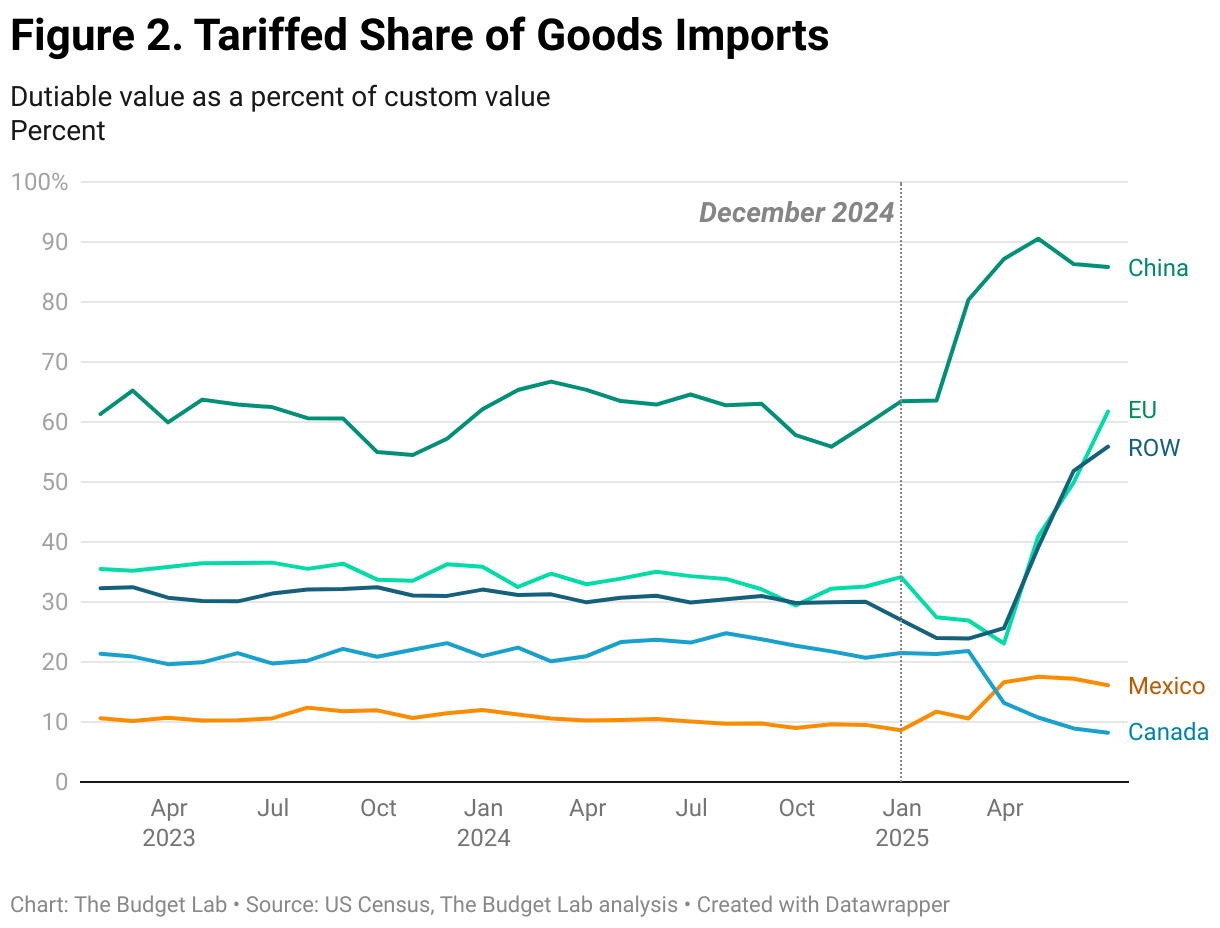
Tariff avoidance and evasion are other possibilities. The Budget Lab assumes an avoidance/evasion rate of 10 percent, but this may be higher in general or higher in the short-run when the potential for timing shifts in import purchases is highest. In particular, importers appear to be taking greater advantage of tariff-free authorities from certain countries, especially Canada, than expected. US Census data show that the share of imports by value from Canada in June that were tariff-free due to USMCA-compliance was 57%; TBL currently uses USMCA shares at the commodity level to calculate the effective tariff rate on Canada. But the share of imports from Canada that were not subject to tariffs for any reason (not just USMCA-compliance) according to US Census data was 92% in June, which is consistent with Canadian customs data on Canadian exports to the US that are CUSMA-compliant (the Canadian name for USMCA).2 The wedge may be because many Canadian imports are being recorded as tariff-free under MFN rates rather than USMCA-compliance on the US side, even if the good technically qualifies under USMCA.
Prices, Consumer Passthrough, and Federal Reserve Policy
One of the most debated questions around tariffs so far is to what extent tariffs are showing up, if at all, in consumer prices. Tariffs are a tax that otherwise add to the cost of imported goods. Different groups can bear this cost, or incidence: foreign producers (in the form of accepting lower prices on their exports), American importers and businesses (in the form of lower profit margins), and American consumers (in the form of lower real after-tax incomes). Moreover, tariffs reduce productivity and thereby real U.S. income (even when including tariff revenue) by reducing the efficiency of resource allocation across countries and increasing the marginal cost of investment. After-tax real incomes in turn can fall either from a rise in realized prices, holding nominal income constant, or a fall in nominal income.
The mechanism by which after-tax real incomes fall depends on several factors. An important one is the Federal Reserve’s response. If the Federal Reserve “looks through” the price pressures from tariffs and does not change policy, then the fall in after-tax real income stems primarily from a realized rise in actual prices. If however the Fed does react to neutralize tariff price pressures with tighter policy (e.g. higher interest rates), then realized price increases will be smaller but tighter policy will slow investment & consumption and lower nominal incomes. In both cases, after-tax real incomes will fall.3
Note too that the effect of tariffs on relative goods prices may be higher than its effect on the general price level. One possibility for example is that macroeconomic weakness induced by tariffs could cause relative services prices — which generally are not directly touched by tariffs — to be lower than otherwise, offsetting some of the relative goods price effect. Once again, even in this case, after-tax real incomes are still lower.
There is suggestive evidence that tariffs are weighing on relative consumer goods prices so far, though the evidence is not yet conclusive. We walk through the data below.
Overall Goods Prices
One possible indication that tariffs are raising consumer goods prices is that goods prices have broken with their prior behavior and increased since the beginning of the year, both in absolute terms and against reasonable estimates of pre-2025 trend.4 Over the first six months of 2025, PCE core goods prices (goods excluding volatile food & energy components) rose 1.5%, versus 0.3% over the first six months of 2024. The difference is even starker with PCE durable goods prices, which rose 1.7% over the first six months of 2025, versus -0.6% over the same period in 2024. Core goods and durables were 1.9% and 2.3% above TBL’s estimate of pre-2025 trend in June, respectively, both of which are statistically significant. Later in this analysis, we test the alternative hypothesis that global non-tariff factors may be pushing up goods prices and find little evidence.
Individual Goods Prices
Beneath the hood of these goods price increases, many individual commodities have seen prices rise meaningfully above prior trends so far this year. The figure below shows all top-level categories of goods in PCE. Several price increases this year have been significant: video, audio, photographic, and information processing equipment prices were 5.7% higher than pre-2025 trend in June, while household appliances were 3.9% higher, furniture 3.1% higher, recreational items 3.0% higher, household supplies 2.6% higher, and sporting equipment 2.3% higher. The only product category significantly below trend levels was children & infants clothing. Many components were higher or lower than trend but at magnitudes smaller than the threshold we set for significance. This suggests that while price increases are widespread among core goods, they are by no means uniform.

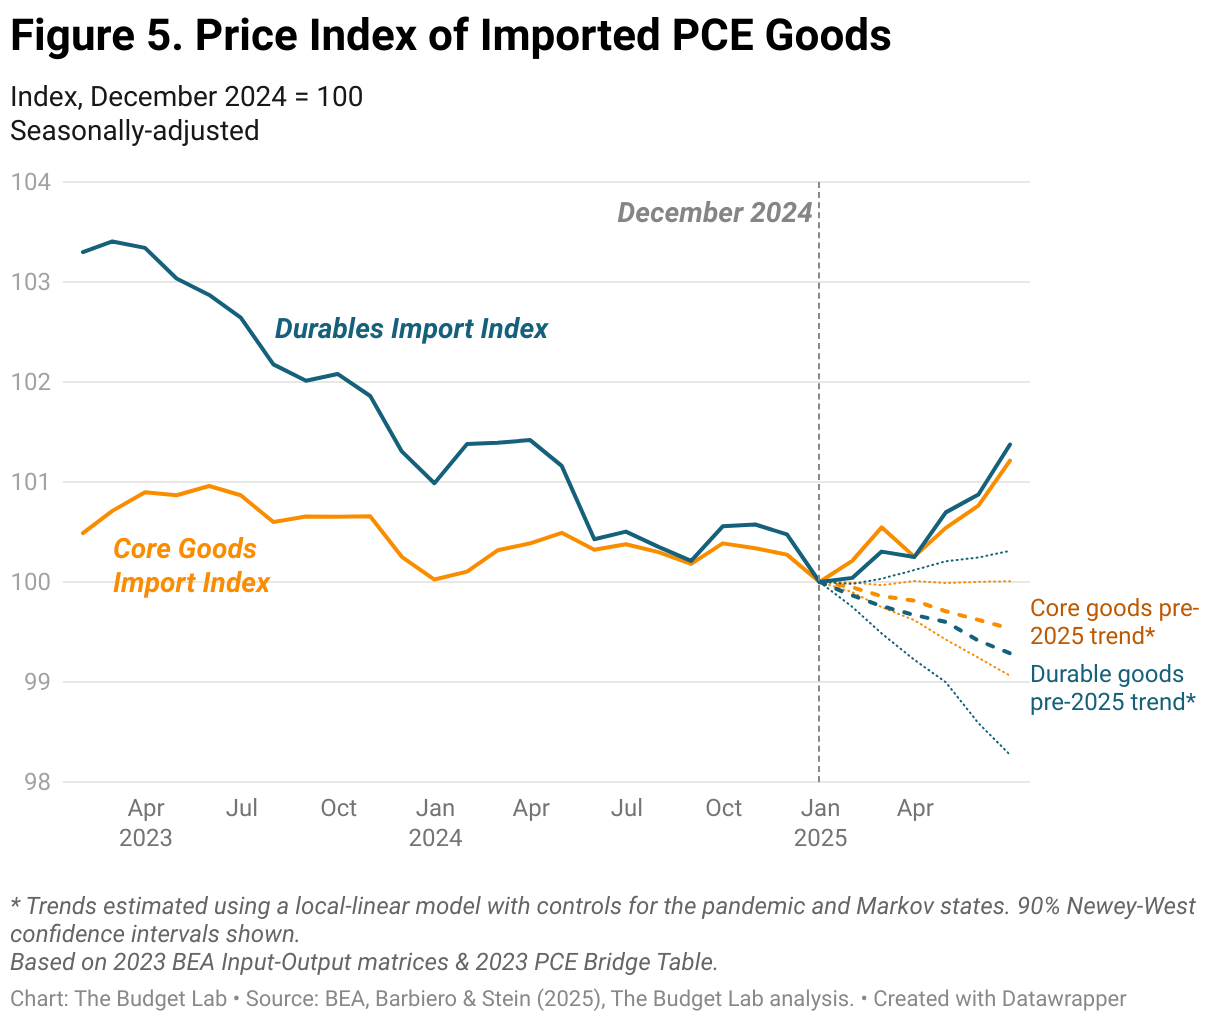
Imported Consumer Prices Including Tariffs
We observed earlier that overall consumer goods prices appear to be rising. Focusing on just imports, prices of imported consumer goods specifically appear to be rising as well. While there is no official tariff-inclusive index of imported consumer goods prices, TBL constructed indices of imported PCE goods prices by reweighting individual PCE price indices using import shares of consumer products, including the effect of both direct and indirect imports on personal consumption expenditures.5 These indices are not perfect signals of true import prices faced by consumers: one weakness is that they will still understate the effect of tariffs on imported consumer products since the weighting methodology only assigns a portion of the true tariff effect to import prices; nevertheless, they will still give a sense of how similar import price trends are from overall goods prices.6
Despite this caveat, the results show a similar story to overall goods prices: imported goods are bucking their prior trend and rising in price, both in absolute terms year-to-date and against trend. Imported core goods are up 1.2% in price through June (versus up 0.4% over the first six months of 2024), while imported durables are up 1.4% (versus down 0.5% in 2024). Against trend, imported core goods and durables were up 1.7% and 2.1% respectively.
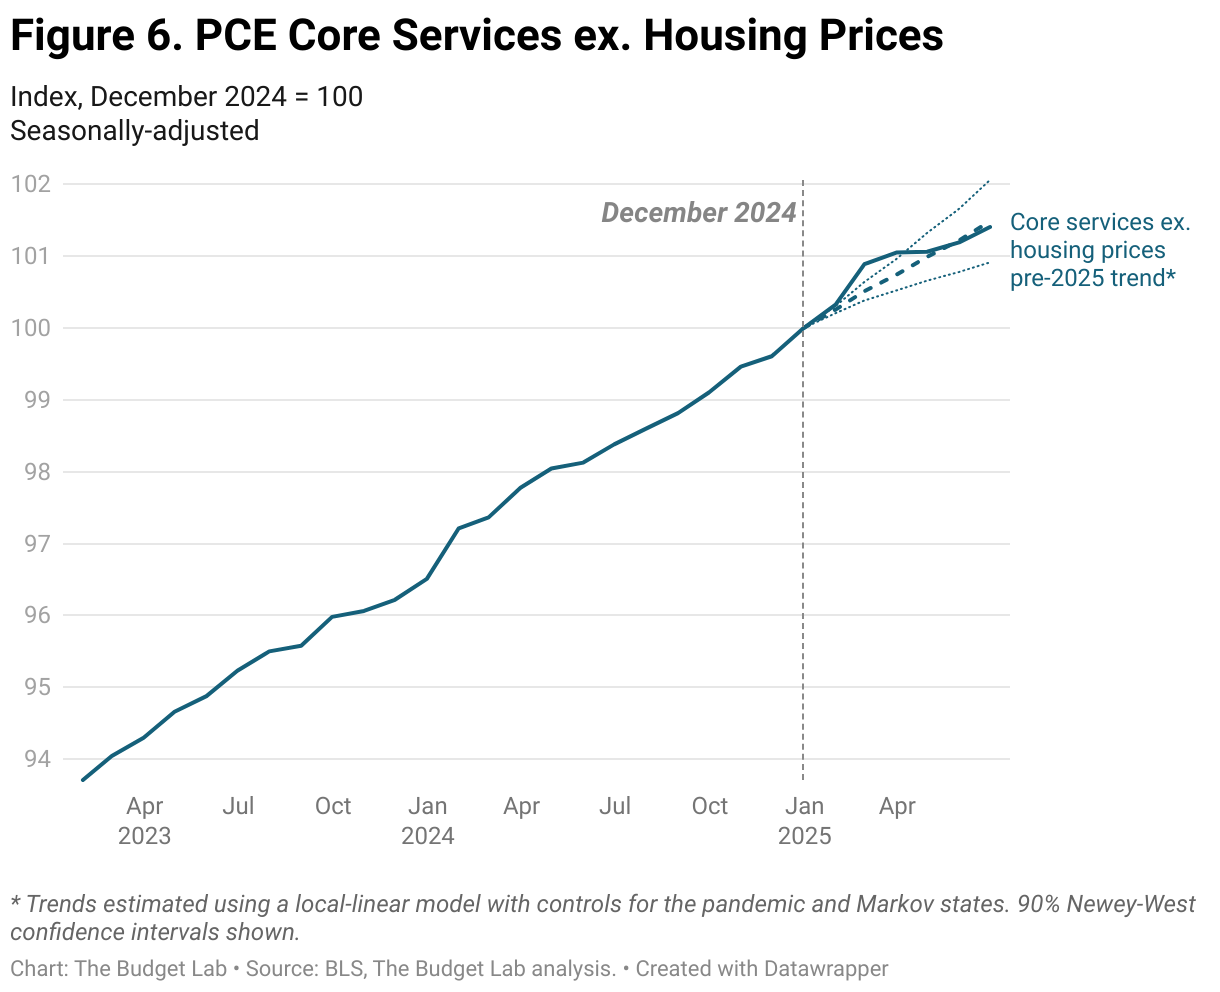
Services Prices
A possibility suggested by economic theory is that the effect of tariffs on relative goods prices will be muted when translating to overall (general) prices, because weakening relative services prices will offset the tariff effect on goods prices. We examine whether there is any evidence of such an offsetting effect so far by looking at prices for core services excluding housing. As the graph below shows, core services prices are almost exactly on their pre-2025 trendline now, after having been slightly above trend earlier in the year. Through June, core services prices rose 1.4% for the year, versus up 1.9% over the first 6 months of 2024. While we cannot distinguish between potential downward effects from tariffs and upward effects from other factors, the net behavior of services prices so far this year is not enough to offset virtually any of the tariff pressure on goods prices.
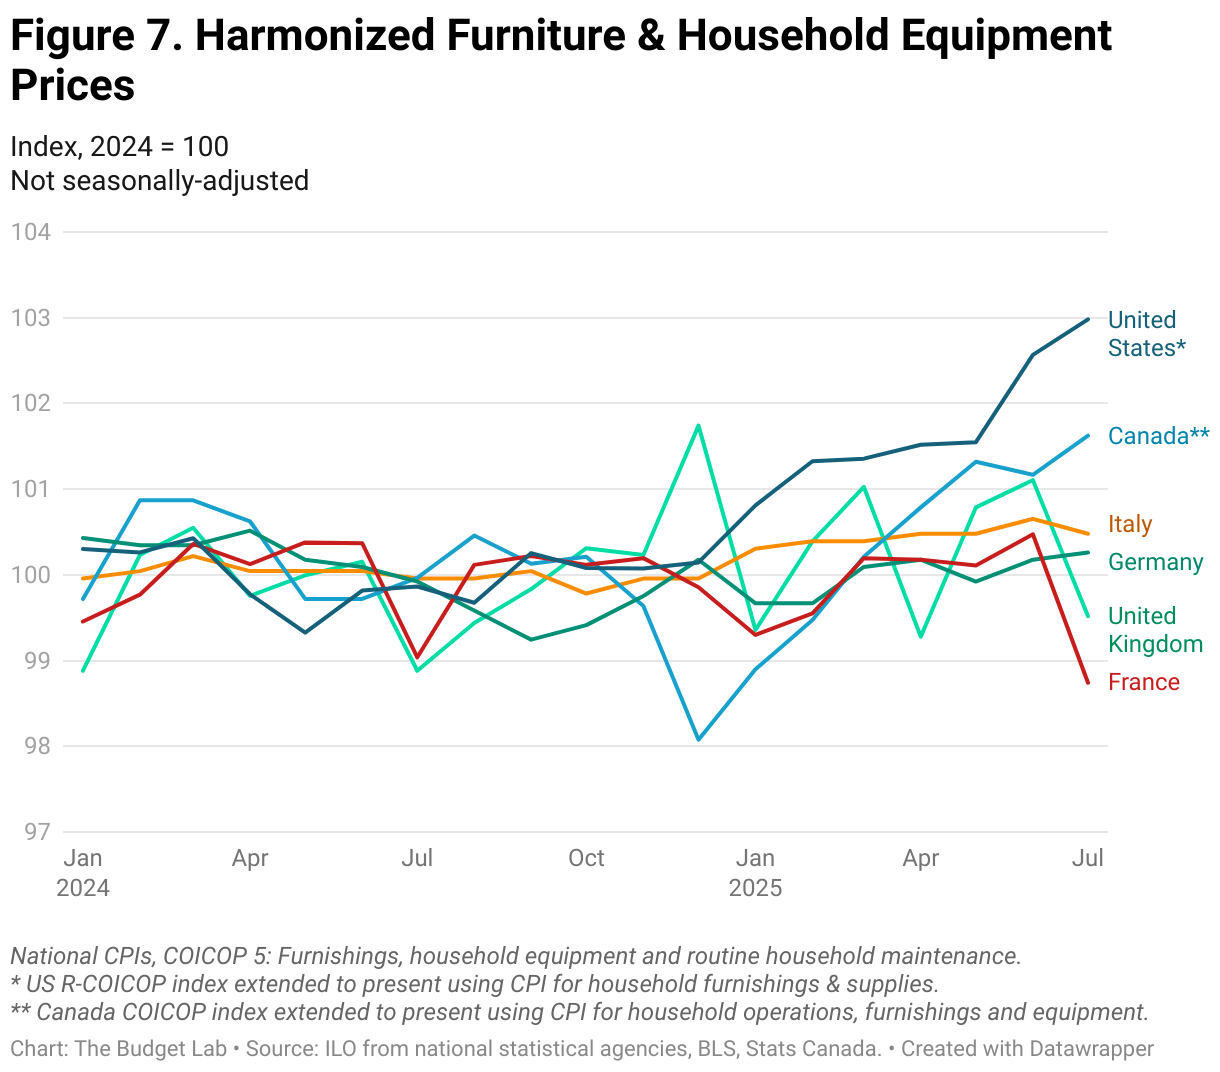
Foreign Goods Prices
Another possibility is that the recent rise in US goods prices represent global factors rather than US-specific tariff factors. It is notoriously difficult to compare price indices across countries on a proper apples-to-apples basis, since every national statistical agency uses different approaches and categorizations of goods and services. But we observe that in many large economies, particularly the Euro Area, durables prices overall are not up materially since last year (and in fact are down slightly since December). Moreover, when looking at harmonized furniture & household equipment prices (a tariff-sensitive category in the US that is its own category under the Classification of Individual Consumption According to Purpose standard (COICOP) that allows for consistent comparison of consumer prices across countries), recent US prices stand out among major G6 economies.7 US household goods prices were 3% higher than their 2024 average in July. The only major economy that approached this was Canada, with household goods prices 1.6% higher by July, but Canada is the only other trade partner besides China to have imposed retaliatory tariffs against the US, which would be expected to raise their own goods prices. Other countries hovered between 0.5% higher and more than 1% lower. There’s no evidence, then, of upward global pressure on goods prices among major economies.
Implied Passthrough of Tariffs to Consumers So Far
In its modeling, TBL assumes that passthrough of tariffs to consumer prices will ultimately reach 100%. This is partially an assumption of convenience but it is also rooted in studies of the 2018 tariffs, such as Flaaen, Hortaçsu & Tintelnot (2020) and USITC (2023). However, these studies focused on the much-narrower set of tariff increases — primarily on intermediate goods — that occurred over 2018 and 2019 (and which ultimately raised the average effective tariff rate by about 1 percentage point), whereas the 2025 tariffs have been far broader (with increases in the actual effective tariff rate of nearly 9 percentage points so far, and much more implied by statutory policy).
The 2018 tariffs also came in a different consumer context than the 2025 ones: consumers for example may be more price-sensitive in 2025 after the inflation experience of the pandemic. Also, as a large, advanced economy, there is a possibility that the U.S. could be able to affect world prices with its 2025 tariffs — which are much larger than the 2018 tariffs — forcing at least some of the tariff burden to fall on foreign producers. We will dig into the question of foreign incidence in the next section; here, we explore what the data suggest about consumer passthrough so far.
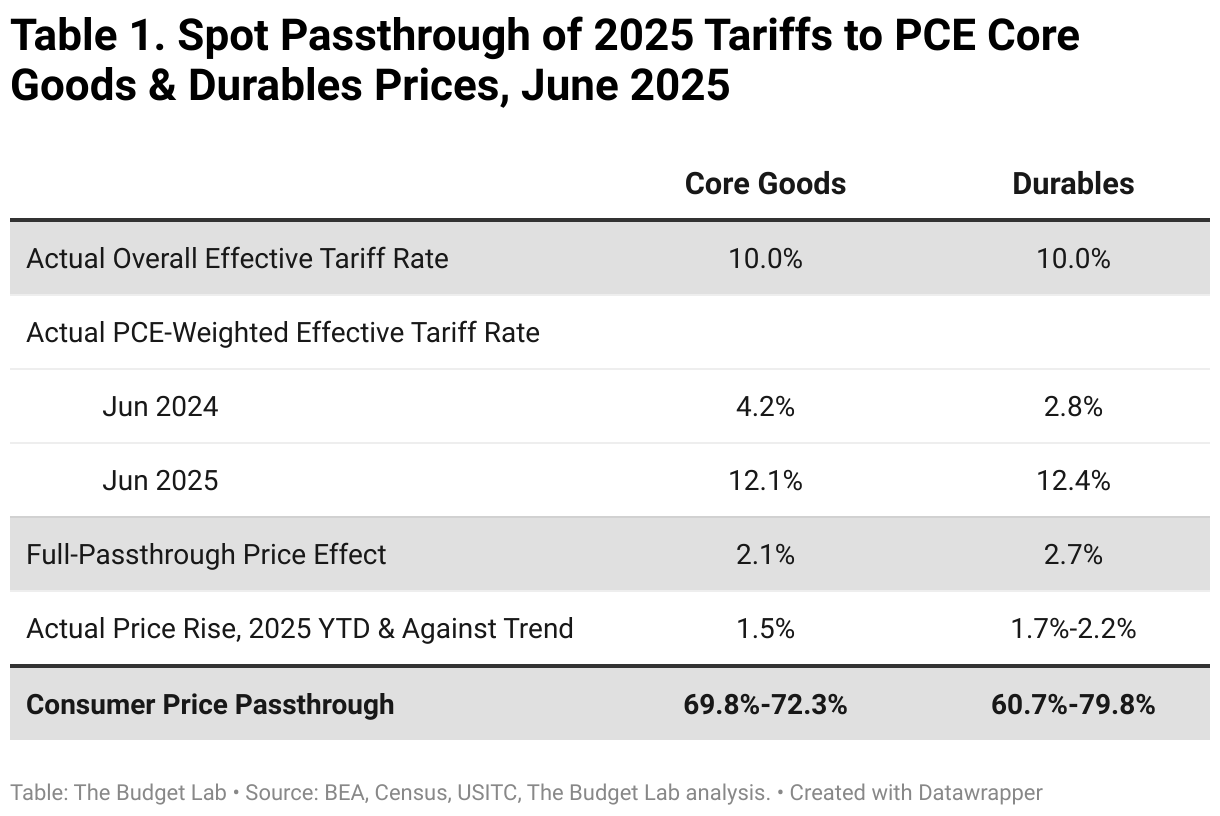
Overall and imported goods prices are up, both year-to-date and against trend. By comparing the rise in overall goods prices against what we would mechanically expect given the rise in tariffs, we can estimate an implied “spot” passthrough of actual tariffs to consumer prices as of June. In June 2025 (the month of the latest detailed Census trade data), the statutory fully-phased-in average tariff policy rate was 15.7%, but as mentioned earlier, there are several reasons why it takes time for tariff policy to fully flow through into realized revenues. A better basis for a passthrough calculation, then, is the actual average effective tariff rate, which was 10.0% that month. But this rate, calculated based on all revenues and imports, includes products and content that will not be ultimately purchased by consumers, such as business investment and exports. TBL therefore calculated average tariff rates on imported consumer goods. For imported core PCE goods, the average effective tariff rate was 12.1% in June, up from 4.2% in June 2024.8 For just imported PCE durables, the rate was 12.4%, up from 2.8%. Given these shifts and the import share of PCE (imported content is roughly a quarter of core goods spending), we would expect full passthrough price effects from the actual tariff increases in 2025 so far to add 2.1% and 2.7% through June for core goods and durables prices, respectively.
TBL’s estimates the actual rises in overall core goods and durables prices through June two different ways. A “trend estimate” approach measures price increases for each PCE goods commodity category against their pre-2025 trends using the methodology previously-illustrated in Figure 4, then reaggregates using PCE consumption weights. This is our preferred approach. Calculated this way, core goods prices are 1.5% higher and durables prices are 2.2% higher.9 Given the full passthrough estimates mentioned earlier, this suggests a passthrough rate through June of just under 72-80% for goods prices (since the 1.5% and 2.2% are 72% and 80% of the “full passthrough” rates of 2.1% and 2.7%, respectively).10 An alternative “simple estimate” uses the year-to-date change in prices through June 2025 instead of measuring against trend. We think that this approach underestimates true price increases from the tariffs by ignoring counterfactuals, but provides an easy lower-bound estimate. These 1.5% and 1.7% year-to-date price increases imply a passthrough rate of 70% and 61% respectively.
Both estimates may be affected by factors other than tariffs that could raise or lower consumer passthrough. For example, these implied passthroughs will be boosted by the weakness of the US dollar, but they could also be reduced to the extent manufacturers and retailers are substituting high-tariff imports with pre-tariff inventories for their sales.
Foreign Incidence
It is a possibility worth exploring that foreign producers could end up swallowing some of the cost of the tariffs, especially given the size of the US economy and the magnitude of the 2025 tariff changes. A signal of this possibility is how import prices behave. Import price indices from the Bureau of Labor Statistics (BLS) do not include the direct impact of tariffs at ports of entry, so they will not mechanically increase with a hike in tariffs. But import prices could still react indirectly to US tariffs. If import prices declined, for example, that could indicate that at least part of new tariffs are being absorbed by foreign producers in the form of lower producer prices.
Instead, however, import prices are essentially close to where they would have been expected pre-2025. Point estimates are, if anything, higher not lower year-to-date. Since January, non-petroleum import prices — which omit volatile, dollar-denominated oil prices — are up 0.3%. Even judged against pre-2025 trend, import prices are still 0.2% higher. This outcome is exactly the opposite of what we would expect if foreigner producers were absorbing some of the tariff costs.11
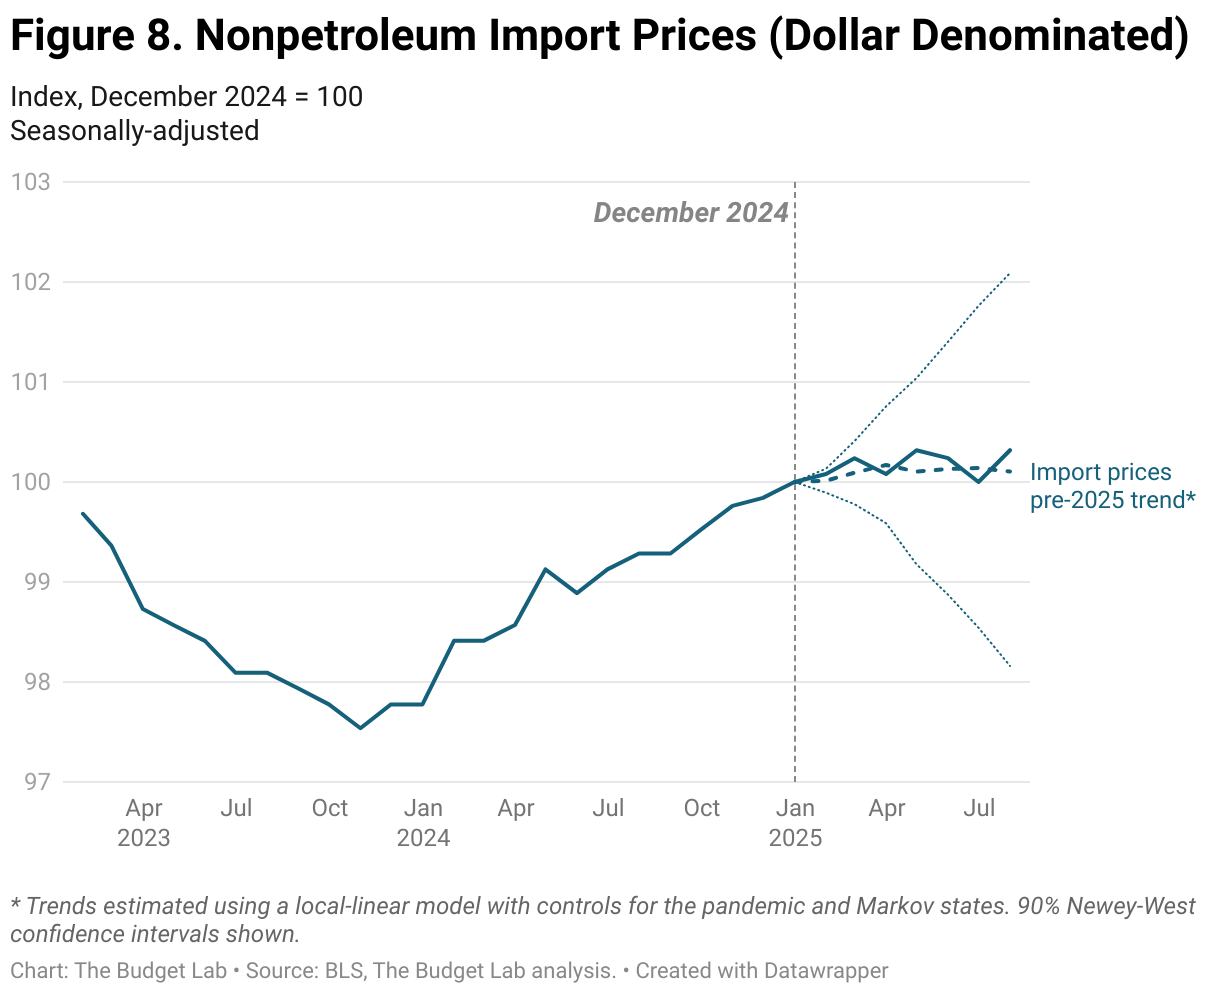
One factor potentially bolstering import prices is the weakening dollar. When we calculate import prices in foreign currency rather than US dollar-denominated,12 we see prices rising rapidly after September 2024, then falling rapidly again beginning in February. The very recent decline is more consistent with a story of foreign incidence; the decline is almost but not quite statistically-significant when judged relative to December 2024 near the peak. But foreign-currency-denominated import prices are still only back to around the level that prevailed in September 2024, having reversed all the gains since then. This makes us less confident that the declines represent proactive price adjusted on the part of foreign producers. So while the evidence is still not definitive, import price data appear to be more consistent with very low foreign incidence of tariffs to date.
Federal Reserve Policy
Another key influence on the ultimate price effect of tariffs is how, if at all, Federal Reserve policy responds. Tighter Fed policy (higher interest rates) would act as a check on inflation expectations and, eventually, inflation itself, while looser policy (lower interest rates) would have the opposite effect.
It is ambiguous how any tariff increases, particularly tariff increases of the magnitude seen in 2025, will ultimately affect monetary policy. The Fed could be concerned that tariffs raise prices and perhaps affect supply chains in a way that is persistently inflationary, which might compel them to raise interest rates or otherwise tighten policy. However, the Fed may instead could see the price level effects from tariffs as one-time and not affecting their inflation mandate meaningfully, and also be worried about tariffs weakening output and lowering employment, which could lead to lower interest rates and looser policy. TBL’s regular trade analysis makes the assumption in its macroeconomic modeling that the Fed looks through tariff-driven price increases and maintains the same stance of policy.
On the one hand, key Federal Reserve officials have suggested tariffs have affected at least very-short-term policy. Chair Powell said at a panel at the ECB’s Sintra monetary policy conference that “[i]n effect, we went on hold when we saw the size of the tariffs and essentially all inflation forecasts for the United States went up materially as a consequence of the tariffs.” This signals that spot policy rates would be lower but for tariffs. Moreover, while the FOMC’s latest Summary of Economic Projections (SEP) from June 2025 still show two 25 basis point cuts by the end of 2025 — the same as the Committee forecast last December — the latest projections do show one less cut in 2026 than the December projections did, a relative tightening. Such a tightening would put downward pressure on inflation earlier. Note though that the FOMC’s assessment of the longer-run terminal rate has stayed at 3.0% since December, showing that the change in 2026 cuts is merely a timing shift rather than a fundamental structural reassessment of the US economy.
On the other hand, markets see looser, not tighter, policy next year than they did. While market expectations of the end-2025 federal funds rate are consistent with the FOMC’s own public forecasts — and are roughly where they were at the beginning of the year — market expectations for 2026 are far more dovish than the FOMC’s (i.e. seeing lower interest rates) and have fallen over the course of the year. Fed funds forwards are currently consistent with rate expectations of 3.0% at the end of 2026, versus SEP projections of 3.6%. Moreover end-2026 projections are roughly 25 basis points — a full cut — lower than where they were the day before “Liberation Day” (April 2).
This suggests that while the FOMC itself is trying to communicate modestly tighter cumulative policy by end-2026 than they were at the beginning of the year, markets don’t agree, seeing looser policy through next year than they did in early January. Looking since April 2 instead, markets have priced in roughly one-and-a-half fewer cuts in 2025, but they think that those cuts will mostly just move into 2026.
Unlike goods prices, we do not have confidence that tariffs are the main driver of market movements in policy expectations. For example, market are almost certainly pricing in anticipations of the new Fed chair and new FOMC participants. To the extent tariffs are weighing on markets, however, they may be betting that, net net, the Fed sees tariffs as a greater risk to its employment mandate than its inflation mandate, and that the Fed ends up cutting as a result, though it’s impossible to distinguish this from other market factors. Either way, there is little indication that policy expectations have tightened appreciably since the beginning of the year.
The Labor Market
Like prices, the effect of tariffs on the labor market depends on different factors. In the very short run — over the first several months after a tariff hike — the labor market may show little to no reaction if they are not affecting business and consumer behavior yet; in fact, the labor market is often thought to be a lagging indicator of broader macroeconomic shocks in general. In the medium-to-long run — several years out and beyond — employment may not be substantially lower if tariffs primarily act affect the economy through lower productivity (which would affect wages but not necessarily employment) and/or if the Federal Reserve acts to keep the economy at full employment.13
But over a year or two, tariffs may weaken demand, and even if Federal Reserve lowers interest rates early, if monetary policy works with a lag then employment could fall and the unemployment rate could rise. There are also important sectoral distinctions. Tariffs could, for example, boost employment in some sectors like manufacturing while decreasing it in other sectors, such as construction.
So far, there is not definitive indication of any effect of tariffs on the labor market, either positive or negative, though there is some suggestive and preliminary evidence of modest cooling. Between January and July, the unemployment rate ticked up 0.24 percentage point, just below the 0.26 percentage point threshold for statistical significance over this period. Underpinning this small rise in the unemployment rate has been a 0.53 percentage point fall in the employment-population ratio and a 0.40 percentage point fall in the labor force participation rate, both statistically significant. Since falls in the employment-population ratio otherwise raise the unemployment rate, while falls in participation otherwise lower it, these two falls partially offset one another.
Tariff-sensitive employment — private payroll employment weighted by each industry’s dependence on imports and actual effective tariff rates in June — has grown by 0.3% so far this year. That is only a third as fast as a pre-2025 trend would have predicted, but still well within a 90% confidence interval. When we just look at tariff-sensitive manufacturing employment rather than all private industries, it has fallen 0.3% year-to-date through July, worse than the 0.6% pre-2025 trend growth (though almost exactly the same decline as overall manufacturing employment). The manufacturing decline is also still well-within a 90% confidence interval.
Industrial Output
Interestingly, while tariff-sensitive manufacturing employment is down this year — albeit not significantly — tariff-sensitive industrial output is up and close to significantly higher than December 2024 levels, though mean-reversion may be a factor. The figure below weights monthly industrial production data from the Federal Reserve by a combination of each subindustry’s import share of output and actual effective tariff rates on individual commodities as of June 2025. The resulting index was volatile so we take a 3-month moving average. As you can see, tariff-sensitive industrial production has grown 3½% since December 2024, almost significant and well above the 0.7% growth implied by pre-2025 trends. It is worth noting however that production is returning to early 2024 levels after having fallen in late 2024, so it is not dispositive that tariffs have been a proactive factor raising output in these industries, especially using a three-month moving average.
The Strength of the US Dollar
A conventional assumption in economics is that tariffs, when faced with incomplete retaliation from other countries, will cause either an appreciation in the levying country’s currency and/or a depreciation in the currencies of the other countries. This is because the relative demand for the levying country’s currency rises as their consumers and businesses buy fewer imports. The Budget Lab’s tariff modeling has assumed that currency adjustments offset roughly one-third of the cost of US tariffs to US consumers & businesses without foreign retaliation.14
The reality, however, has been different so far. The US dollar is still more than 5% weaker from last December’s monthly average, and 3% weaker than it was the day before Election Day in 2024. There’s also been inconsistent depreciation among the targets of US tariffs. While China’s currency is down almost 4% from last December, Mexico’s is up by more than 5% and Canada’s is up by almost 1%.
These currency movements will affect the price of imports for consumers. While stronger currencies make imported goods cheaper for residents, weaker currencies have the opposite effect, making imports more expensive. The weakening US dollar and Chinese renminbi is thus otherwise raising the price of imports in those countries, while the appreciating Mexican peso and Canadian dollar are lowering import prices.
It is unclear what explains these currency movements. As a first order effect, US tariffs may indeed be putting upward pressure on the US dollar and downward pressure on other currencies (the US dollar strengthened by 7% between September and mid-January, perhaps in anticipation of tariffs), but that effect is not dominating final market pricing, especially year-to-date. Factors that may be putting downward pressure on the US dollar include a deteriorating economic outlook, shifting views on the credibility of US institutions and the role of the US dollar in the global economy, and expectations of lower interest rates. The real trade-weighted dollar also entered 2025 roughly 20% stronger than its long-run average level, so mean reversion may also be a factor in dollar movement.
Import & Export
In a world where the currency of the levying country appreciates as expected, it is difficult for tariffs to persistently reduce the trade deficit over the long-run. This is because even though tariffs disincentivize import purchases, this effect is offset by appreciation of the country’s currency, which otherwise makes imports cheaper.
As we have already seen, however, the reaction of the US dollar and other currencies has not been consistent with this story. A weaker dollar adds to the cost of imports while reducing the cost of US exports to other countries; likewise the appreciation of currencies like Canada’s and Mexico’s makes their exports more expensive to the US and US exports less expensive to them.
Despite these dynamics, real imports surged in the wake of the tariff announcements, as consumers and businesses sought to make purchases ahead of tariffs taking effect, before plunging in April. As of June, real imports were more than 7% below 2023-24 trend. TBL calculates that in the long-run (over many years), real imports will be persistently 19% lower as a result of the 2025 tariffs. Real exports also rose initially but much more modestly than imports, peaking at 7% above trend in April before falling in May and June, where they ended up 0.6% below trend; eventually, Budget Lab modeling suggests that real exports will fall too in the long-run, by roughly 18%, due to a combination of a stronger dollar, retaliation, and a weaker global economy. The real trade deficit was $18 billion lower in June in 2017 dollars versus trend, while it was $88 billion higher against trend over the first six months of the year.
Conclusion
It has only been a few months since widespread and substantial tariffs were imposed, from a 2.4% effective rate at the beginning of the year to a nearly-12% actual effective rate as of August and an even higher implied average statutory rate. Countries, businesses, consumers, and policymakers are still determining how to respond to the new operating environment. Modeling can help us think about medium-to-long-run effects from tariffs but are much more uncertain during periods of short-run transition. Nevertheless, one can begin to see the impacts of tariffs in the economic data. The way those impacts show up over time may change and Budget Lab plans to continue monitoring the data to see how tariffs are impacting the economy over time.
Footnotes
- This does not include the 23% income & payroll tax offset that both TBL and the Congressional Budget Office assume when scoring the fiscal effects of indirect taxes like tariffs, since that effect manifests as lower income and payroll tax revenues. See this CBO report.
- See e.g. this Trade Commissioner Service page and this Bank of Canada report.
- This is not to say that the price channel and the nominal income channels lead to equivalent after-tax real income outcomes. One reason why they might differ is because of inflation-adjusted transfers: if prices rise as a result of tariffs, transfer programs that are automatically-adjusted for inflation such as Social Security will respond, helping to mitigate the final effect on real incomes.
- The Budget Lab calculates trends in this report using local linear models calibrated through December 2024, with dynamic forecasts beginning in January 2025. The models incorporate 12 months of lags and forecast out 6 months. They are augmented with probabilities from a two-state Markov switching model, allowing the trend model to differentiate between high- and low-inflation regimes for each commodity. Controls for the pandemic period are also included.
- We use the methodology of Barbiero & Stein (2025), which is similar to the methodology employed by the White House Council of Economic Advisers (2025). The Barbiero & Stein and TBL approaches use the 2023 releases of BEA’s Input-Output & PCE Bridge tables, while CEA’s index uses the benchmark tables published in 2017.
- All such import indices constructed this way understate the impact of tariffs on import prices. Since the individual component PCE price indices do not distinguish between imported and domestic content, applying a pre-2025 import weight to each tariff-inclusive consumer price category will very likely incorporate only a portion of the true tariff effect into the resulting import prices. This approach is only unbiased if tariffs have exactly the same effect on both domestic and imported prices, which is implausible, though prior research has shown nonzero domestic price spillovers of tariffs.
- Disaggregated COICOP data for Japan was unavailable from the ILO.
- TBL calculates PCE tariff rates using actual effective tariff rates weighted using BEA’s 2023 Input-Output matrices and the PCE Bridge table.
- The overall price effect is a better basis for comparison than our constructed PCE import price index, since as mentioned earlier the import price index will understate tariff effects. Moreover, overall prices will include important potential domestic price effects.
- A spot passthrough of 73-80% in June is in the middle of recent estimates. It is consistent with the passthrough assumption currently made by the Goldman Sachs economics team. It is higher than the Minton & Somale (2025) estimate of a 54% passthrough on core goods PCE through March from 2025 tariffs, but this is not surprising as it is plausible that passthrough would rise over time, especially in the initial months of the new tariff regime. It is also much lower than Minton & Somale’s 212% estimate for the ultimate passthrough of 2018-19 tariffs. Flaaen, Hortaçsu & Tintelnot (2020) found that the 2018 US washing machine tariffs had a 60% passthrough on washers alone, but 108-225% when including dryers, a complimentary good — our approach measuring broad goods price effects against pre-trend will capture such complimentary goods as well as domestic price effects. Cavallo et al (2021) finds heterogenous but very low passthrough into retail prices when looking at daily prices from two large US retailers. Data for 2024 and 2025 from Cavallo, Llamas, and Vazquez show that imported prices at several large online retailers were 4.0% above pre-2025 trend as of early August, while domestic prices were 2.0% above trend. Their data suggest overall goods prices were 3.4% above trend, larger than the 1.9-2.3% we calculate through June using PCE data. Cuba-Borda et al (2025) finds more persistent tariff effects on inflation due to the intermediate inputs channel, raising the ultimate passthrough by up to 30% more than studies that assume a single point in time impact.
- It’s also entirely consistent with prior literature: Amiti et al (2019), Cavallo et al (2021), Fajgelbaum et al (2019), and Minton & Somale (2025) all find 100% or near-100% burden of US tariffs on US importers (which they may then pass on to consumers).
- Nonpetroleum imports multiplied by the Federal Reserve’s broad nominal trade-weighted dollar index, then reindexed.
- Note however that easing policy for employment purposes could conflict with the Fed’s inflation mandate. Moreover, if tariffs weaken the economy’s supply-side potential, then the level of payrolls consistent with full-employment would still fall even under appropriate Federal Reserve policy.
- This is consistent with Jeanne (2020).