Who Is Paying Their Fair Share of Taxes? A New Analysis and Interactive Tool
Key Takeaways
-
Today, there is a broadly held public perception that high-income earners use the intricacies of the tax code to reduce their tax burden, often paying an effective tax rate that is far less than statutory tax rates. While this is often true, what is less commonly recognized is that even among the top 1 percent of income earners there is a wide range of tax burdens. For example, some among this group pay an effective tax rate of 3% while others pay as high as 45%. The combination of deductions, credits, and how different forms of income are taxed results in filers of similar incomes paying different amounts in taxes. Those at the very top of the income distribution experience a wide range of tax rates, with 80 percent of filers paying between 16% and 37%. For middle-income families, this range is narrower (about 5% to 13%).
-
The tax code enables many filers to pay less in taxes than would be expected by their statutory rates. The gap between effective tax rates and statutory rates results in lost revenue. The Budget Lab’s analysis below shows that eliminating the tax provisions that contribute to these gaps between statutory rates and effective rates would raise $560 billion in 2026. Because these provisions affect different filers differently, their repeal would reduce dispersion in effective tax rates within income groups.
-
Tax preferences like deductions, credits, and preferential rates are the drivers of gaps between effective tax rates and statutory tax rates. For example, the existing tax code implements lower tax rates for certain kinds of personal income, like capital gains and business profits, compared to wage earnings. Similarly, certain expenses like mortgage interest and state and local taxes are deductible when determining taxable income. These provisions, which are only available to certain tax filers, generate divergent tax burdens (even among those with similar incomes). Because these types of provisions are not equally available to low-income and high-income filers, the ability to pay lower than one’s statutory rate is not uniform.
-
Whether gaps between effective and statutory tax rates reflect “unfairness” is a normative question. One big driver of tax rate dispersion among low- and middle-income families is tax credits that adjust for family size, like the Child Tax Credit and the Earned Income Tax Credit. These tax breaks recognize that a family of four earning the same income as a childless person has a lower income on a per-person basis. Therefore, tax rate dispersion by income is lower when accounting for family size.
Summary
The scheduled expiration of key provisions of the Tax Cut and Jobs Act (TCJA) in 2025 has renewed public debate on whether top earners, corporations, and other entities are paying their “fair share” in taxes. A great deal of attention is often given to how much the ultra-wealthy pay in taxes relative to the typical family. Relatedly, some people have scrutinized how higher-income filers are able to harness the tax code’s uneven treatment of different forms of income to lower their tax burden. As Congress considers what, if any, changes to make to the tax code next year—and as presidential candidates propose new tax breaks for specific kinds of income like tips or overtime pay—fairness in the tax code is a timely and important policy topic as these proposals would exacerbate horizontal inequity. In the analysis below and companion interactive tool, the Budget Lab explains why certain parts of the tax code may lead to tax filers paying less than their fair share and highlights how similarly situated tax filers may in fact have divergent tax burdens.
Introduction
Imagine you’ve just submitted your tax return and you’re getting a drink and a bite with two friends. One friend is describing what they’re going to buy with their refund, while you ended up owing even more than what was withheld from your paycheck. You both make about the same amount of money, so it might seem unfair that you had to pay more than your friend. Your other friend, who has a high-paying job, remarks that they owed about the same amount as you in taxes. Later, the bill comes, and, since you each ordered a drink and shared an appetizer, you agree to split the bill. Your friend with that high-paying job tosses down their card and says they’ll pick up the appetizer since they ate most of it and to just send them the cost of the drinks. Is this fair? Why don’t your taxes work the same way?
With the expiration of key provisions of the Tax Cut and Jobs Act (TCJA) in 2025, there is renewed attention in academic research on inequality and distributional analyses on whether top earners, corporations, and other entities are paying their “fair share” in taxes. Some may believe that tax burdens should scale proportionally with income, as in a flat tax, while others support a progressive tax system, with higher-income Americans paying higher tax rates than their lower-income counterparts.
While reasonable minds may disagree about how best to achieve greater fairness in tax code, it’s clear that many filers today aren’t paying their fair share of taxes. This outcome, however, is in some instances the direct result of the tax code itself. For example, the existing tax code treats certain kinds of personal income, like capital gains and business profits, more favorably compared to wage earnings. Similarly, certain expenses like mortgage interest and state and local taxes are deductible when determining taxable income. And both 2024 presidential candidates have proposed tax breaks on certain forms of income like tips and overtime pay, which would exacerbate horizontal inequities. Together, these provisions, which are only available to some taxpayers, mean that filers with the same income can vary widely in their owed taxes.
In the analysis below, we ask: to what extent does the tax code treat filers with similar income differently. To help answer this question, the Budget Lab has built a new interactive tool to look at variation in average effective tax rates (taxes as a percentage of income). This report highlights some of the key drivers of unfairness in the tax code (particularly among similarly situated filers), and the potential impacts of creating greater fairness among taxpayers.
Revenue Costs of Tax Preferences
Across the income distribution, certain deductions, credits, and preferential tax rates result in tax filers paying a different effective tax rate (ETR) than what statutory tax rates imply. To quantify how these provisions affect revenue we compare actual average ETRs to the hypothetical rate that statutory rates on ordinary income (“effective statutory rate”) imply.1 Our results suggest that more than half of the people in the bottom two brackets pay their effective statutory rate, while about half or less pay below it. Less than one percent of those in these brackets pay above their statutory rates. The trend reverses itself in the upper brackets, with the overwhelming majority of filers paying below their normal rates, though about 3% of filers in the 5th bracket pay above that rate due to the Alternative Minimum Tax (AMT).
Figure 1. Distribution of Tax Filers with Respect to their Statutory Rates
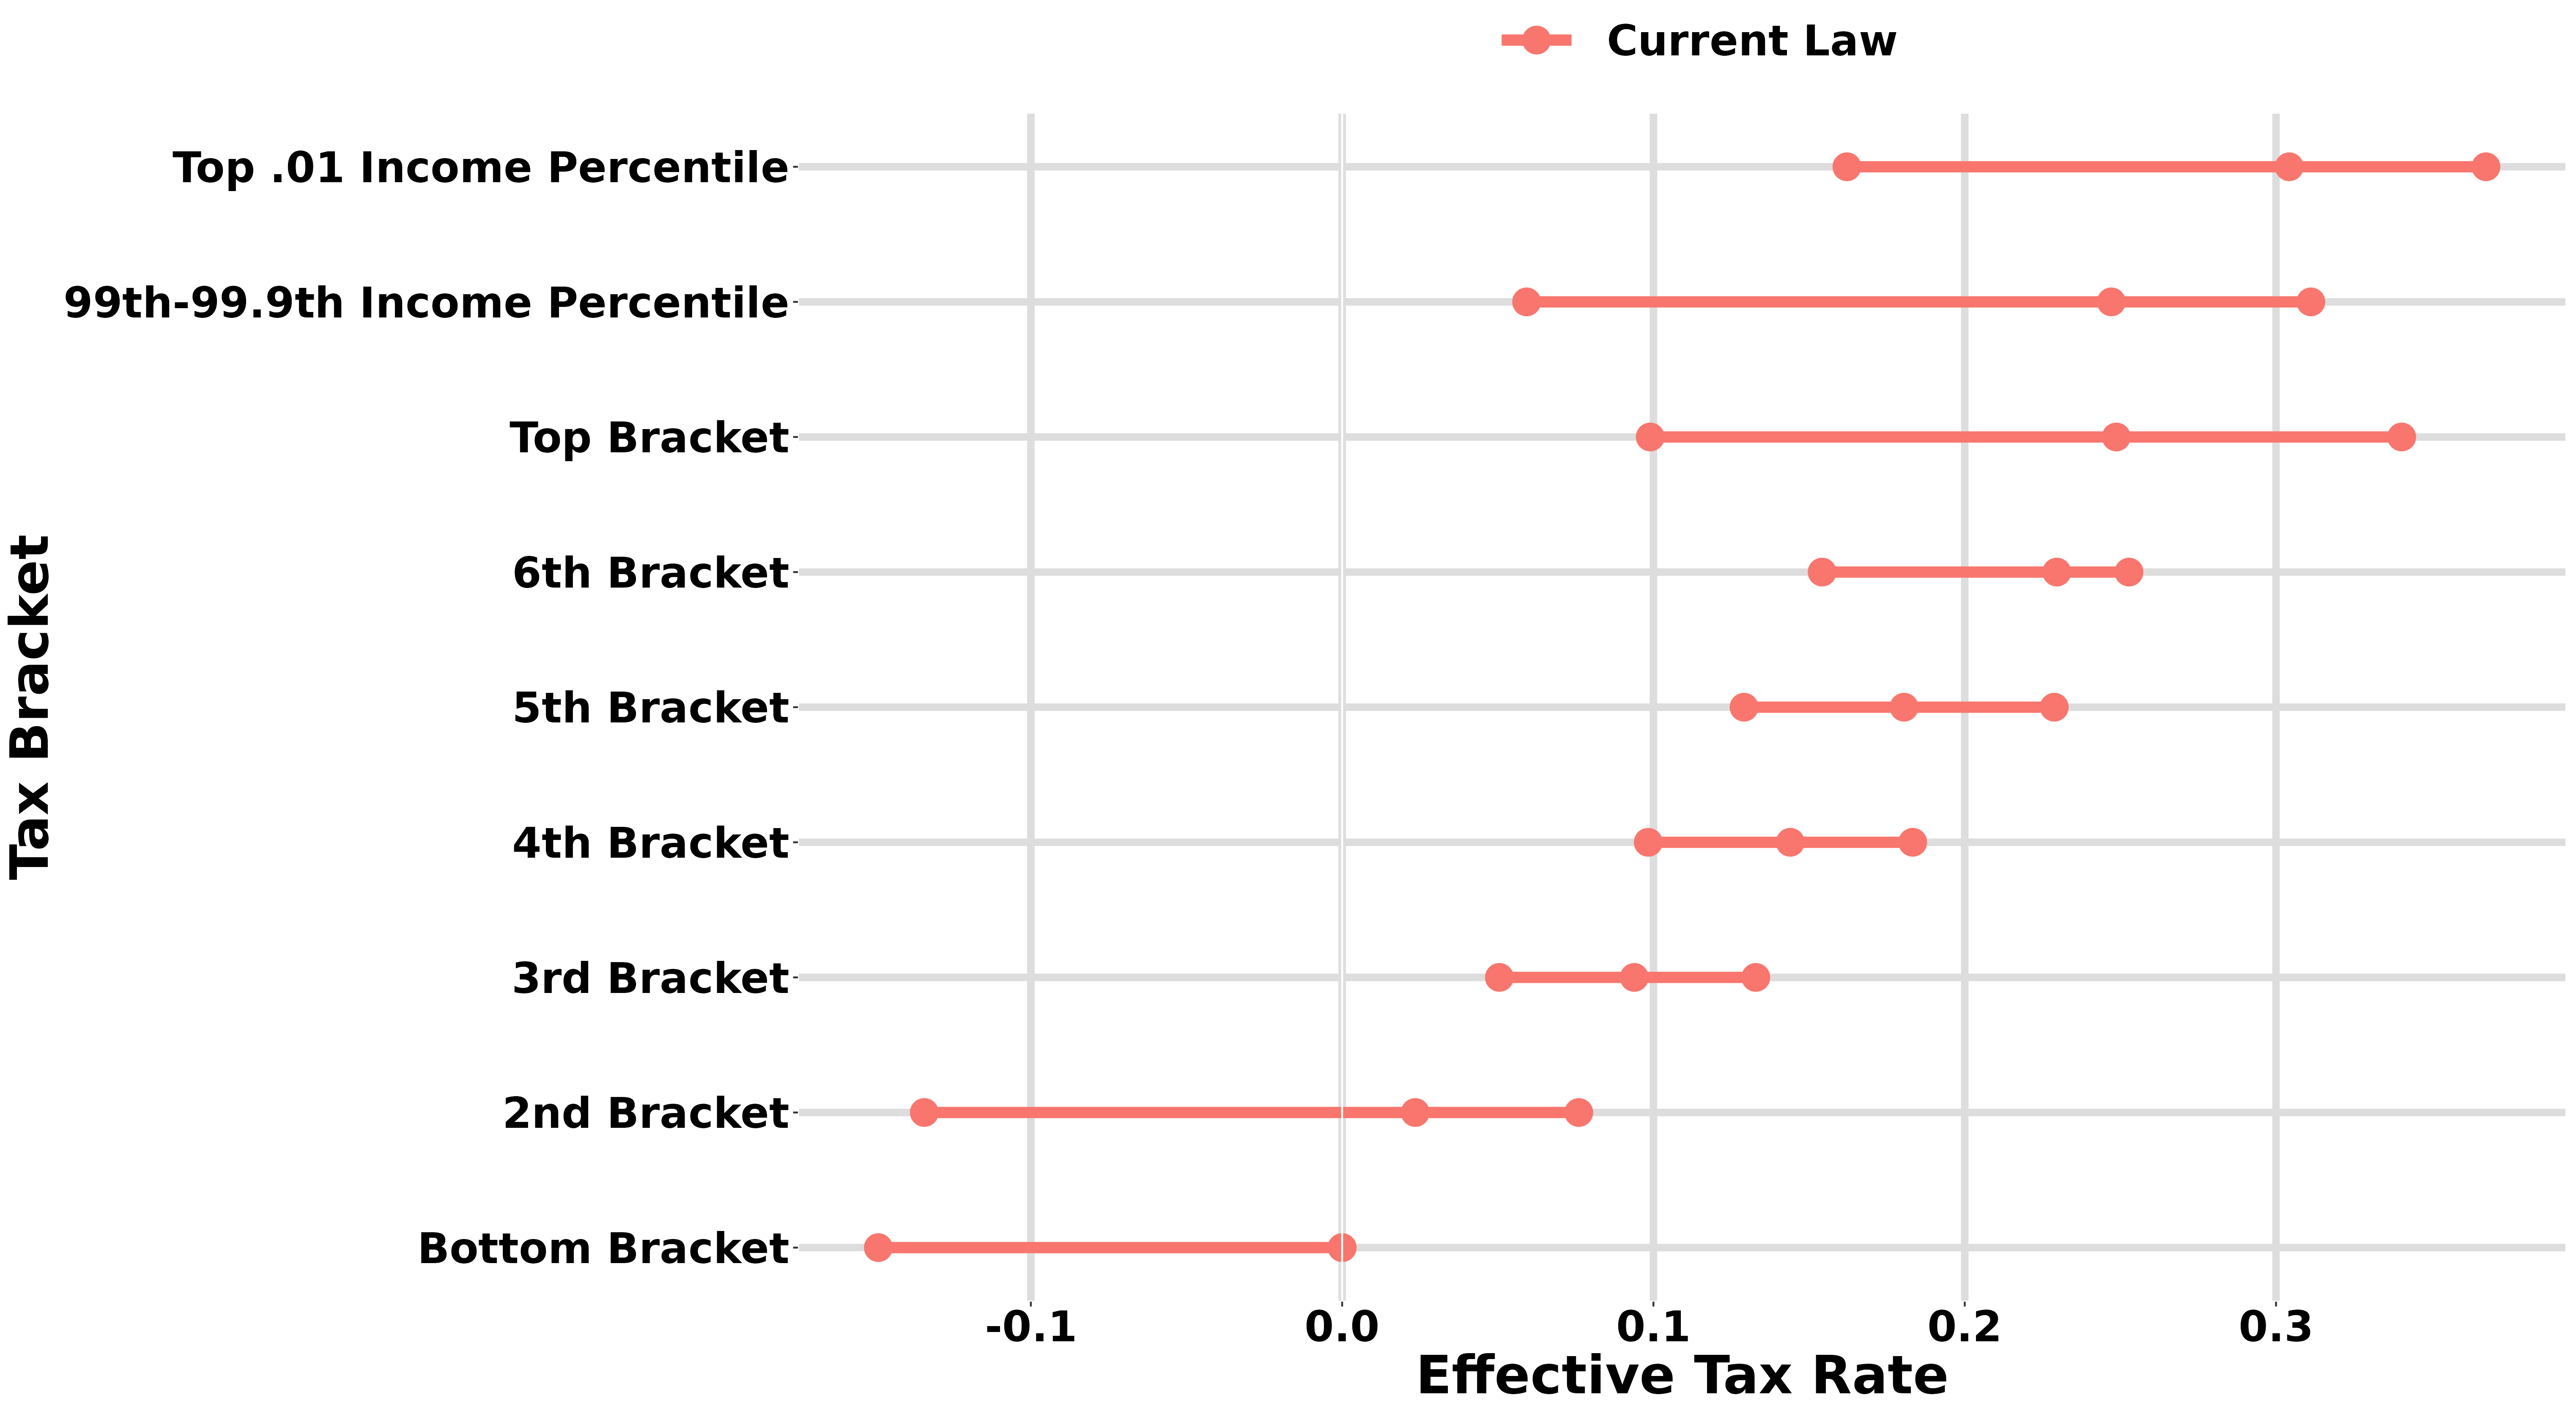
Even within a given income bracket, deductions, credits, and preferential tax rates have varying effects on different families. As such, eliminating these tax preferences would reduce tax rate dispersion, particularly below the top three tax brackets.
Figure 2: 10th, 50th, and 90th Percentile of Effective Tax Rates
But some of these tax preferences are explicitly designed to adjust tax burdens for family size. For example, the Child Tax Credit (CTC) is a recognition that families with children have less income on a per-person basis—and therefore should be taxed more lightly than childless filers with the same total income. If ETRs are instead calculated after adjusting incomes for family size, the effect of repealing these tax preferences on tax rate dispersion is more ambiguous, especially for middle-income families who benefit most from these child-related tax provisions.
Figure 3: 10th, 50th, and 90th Percentile of Effective Tax Rates, Adjusted for Family Size
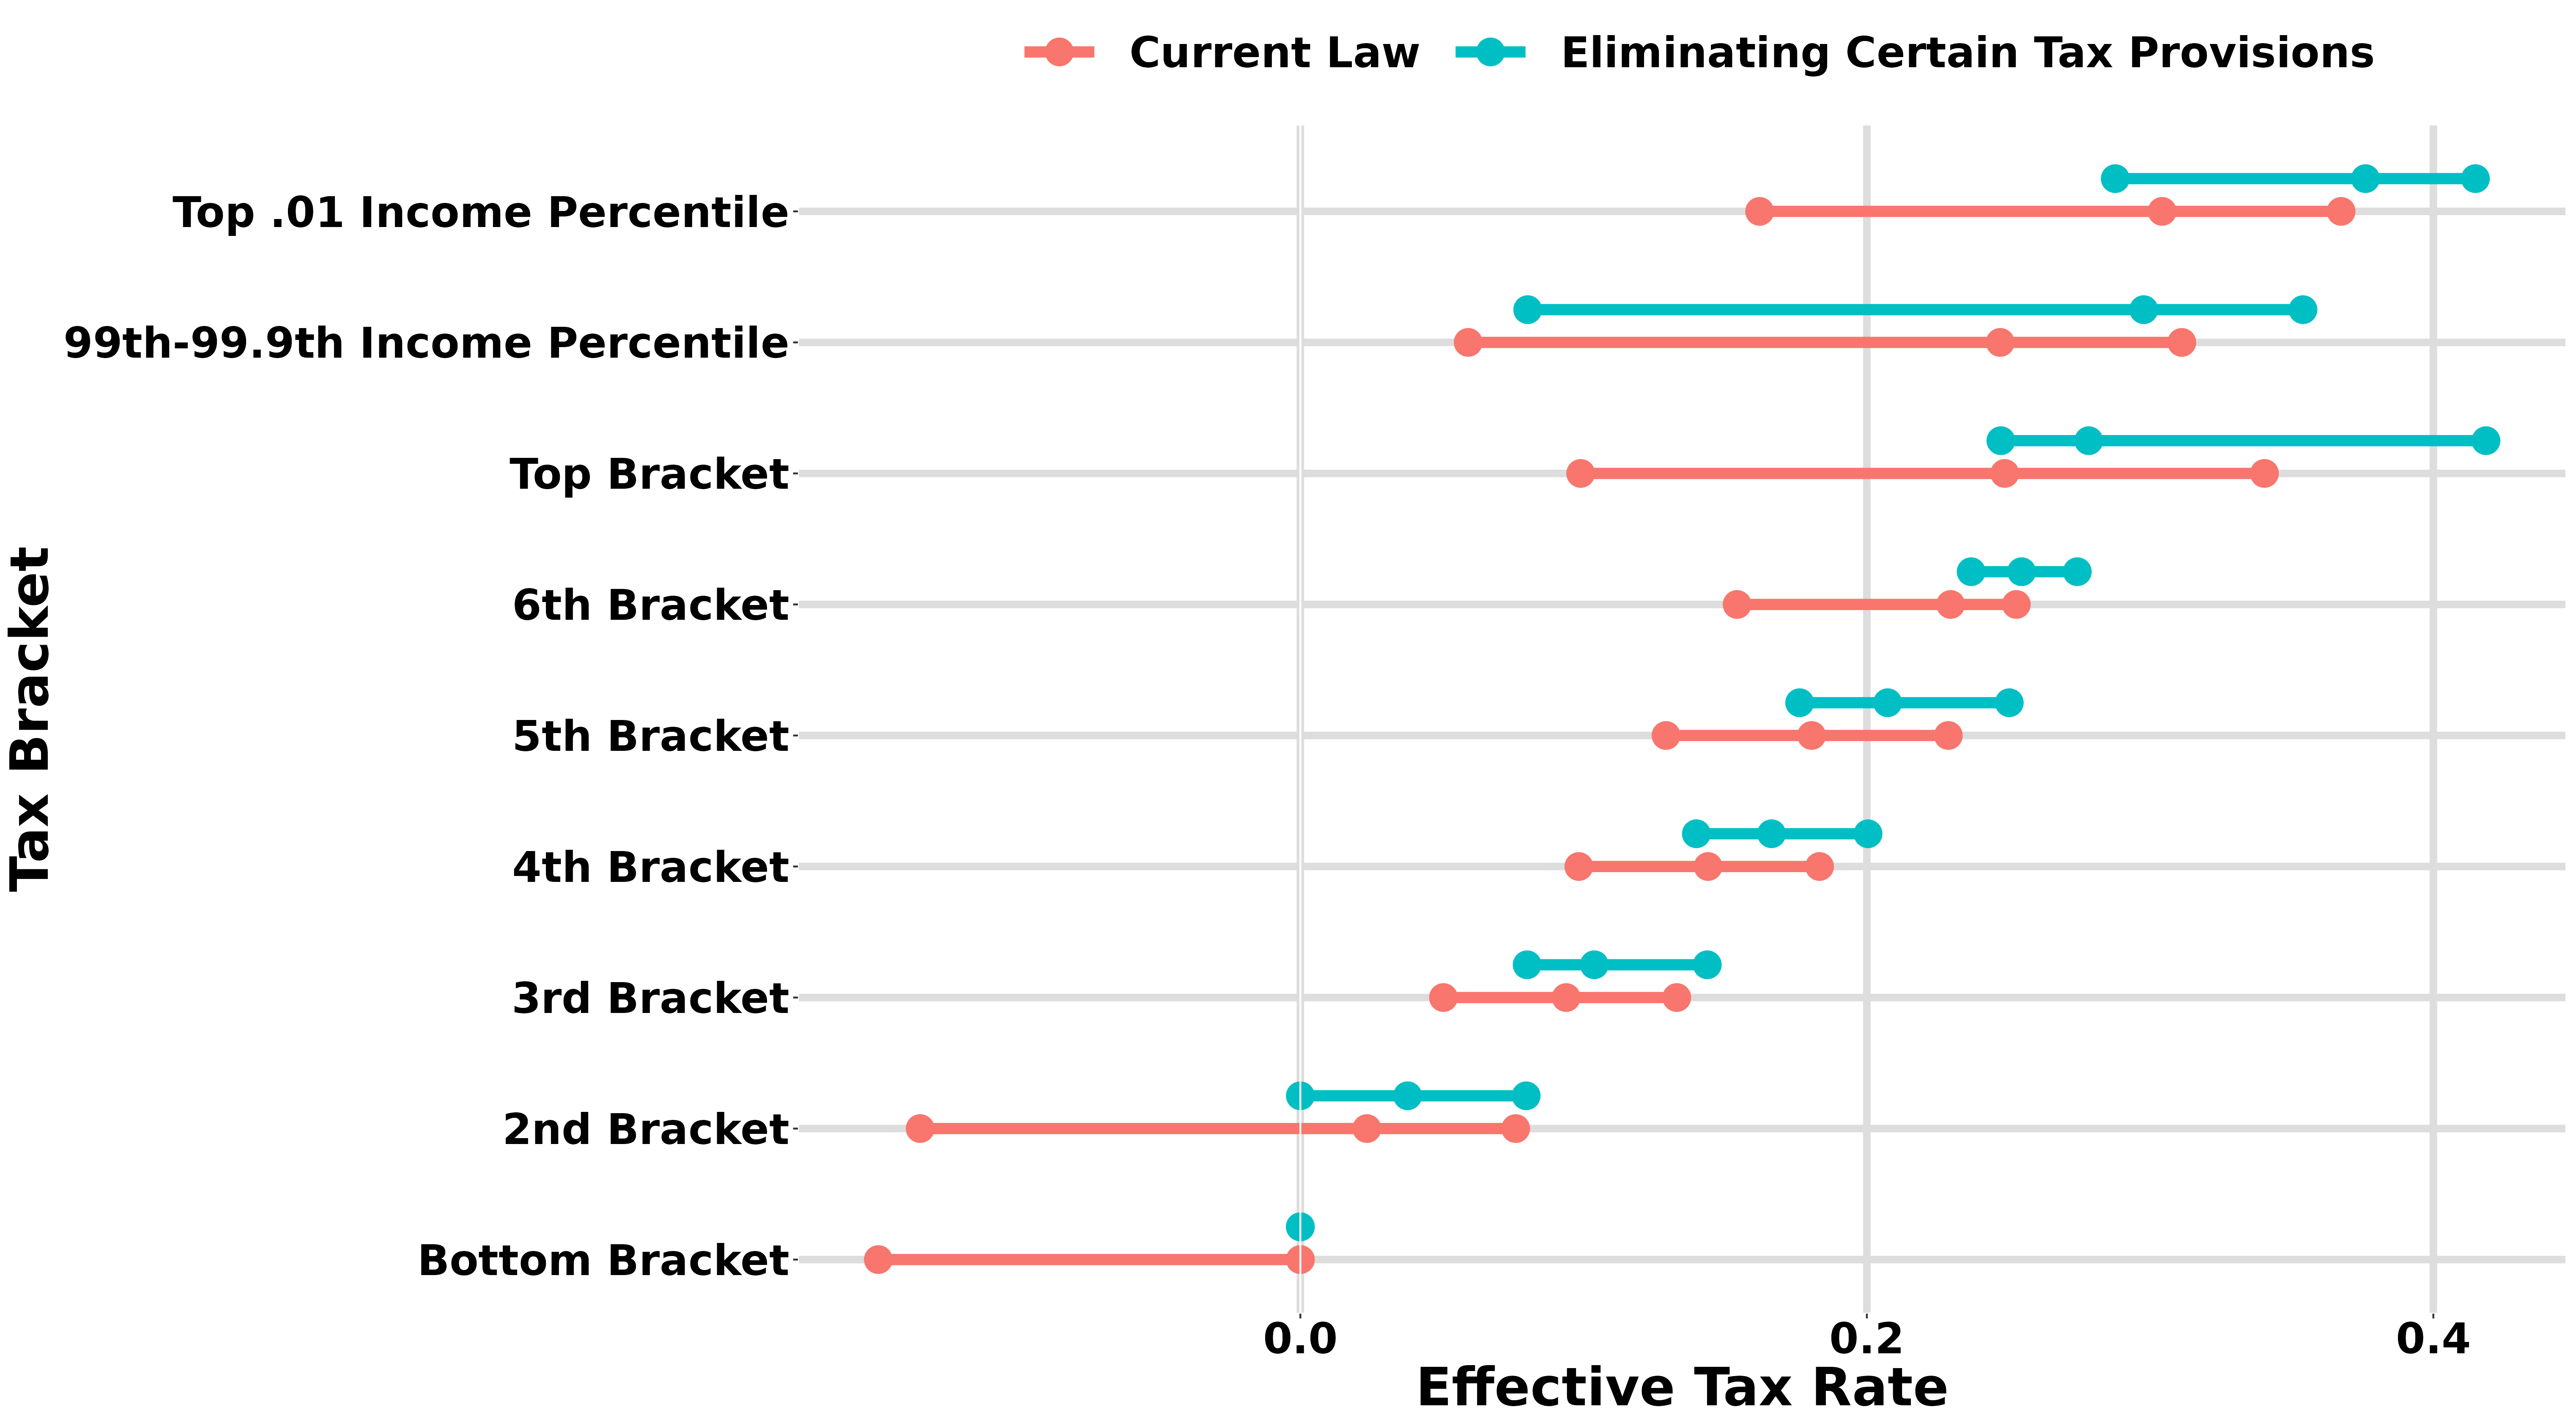
Eliminating these provisions would generate large increases in tax liability at all income levels, particularly those from the top 3 brackets. This result reflects the fact that filers with higher incomes are more likely to itemize deductions and earn income from nonwage sources that are taxed at preferred rates. Conversely, the increased revenue from lower income Americans, particularly for the bottom two brackets, comes from eliminating the CTC and EITC—two credits which reduce taxes for families with children, especially low- to middle-income families.2 Summed up, we estimate that eliminating these tax expenditures would generate an additional $560 billion (1.8% of GDP) of revenue in 2026, the year for which we estimated the distributional effects.
After calculating these results, we tested how much ordinary tax rates could be lowered while maintaining current-law revenue and progressivity. This test follows the maxim common in fiscal analysis: “broaden the base and lower the rates.” Taking it together, we calculate the following rates per income bracket:3
This rate schedule ensures that every filer within a bracket has the same ETR as under current law while maintaining the same revenue. The bottom rate is negative because these rates are inclusive of refundable credits found in current law. Readers may be surprised to see that rates actually decrease at two points in these new brackets. This reflects (a) phaseouts of low-income tax credits, which create high effective marginal rates for middle income filers, and (b) the fact that tax-preferred investment income comprises a larger fraction of AGI for high-income households, which lowers ETRs.
Analyzing Horizontal Equity
Next, we quantify dispersion in tax rates by calculating the standard deviation in ETRs by income group, both under current law and counterfactual reform scenarios. Here, we grapple with the fact that some households with the same income do not necessarily have the same ability to pay taxes. For example, a family of four that earns $30,000 has less income per person than a single filer earning the same total income. To account for this dynamic, we adjust income for family size; see the Appendix for further details.
Our results indicate that, under current law in 2026 after the expiration of TCJA’s individual tax cuts, variation in tax rates is higher at both low levels of income (due to tax credits which vary based on family size) and high levels of income (due to differential tax rates for different types of income). The analysis also allows us to measure the effect of policy reforms on tax rate dispersion. For example, under a scenario where the expiring provisions of TCJA are extended, the standard deviation of ETRs in the top decile would decrease by 13 percent. This result reflects a core goal of TCJA—to simplify and broaden the individual income tax base by curtailing itemized deductions and consolidating tax benefits for children.
How does tax rate dispersion vary across the income distribution?
Our estimates show that under the existing tax code, standard deviations in ETRs are higher on both ends of the distribution, particularly for tax units with low incomes. Our analysis of how changes in the tax code affect our measures of horizontal equity shed light on the mechanisms for this U-shaped distribution. Let’s look at a few examples to understand what’s going on.
1. Team player or a partnership
Shohei Ohtani signed to the Dodgers for a staggering $700 million contract, the biggest in Major League Baseball history. Even though currently he’s only taking home around $2 million, that’s entirely wage income, and most of it is taxed at the top rate of 37%. The same amount earned as a partnership, though, is a whole different ball game. Structuring income this way lets people deduct their losses, pass credits to their personal returns, and transfer assets back and forth to their business tax-free. With all these options, it’s easy to significantly reduce what would usually be a $695,000 income tax bill on $2 million into something much smaller.
This tactic also skirts another tax. All income above $250,000 is generally subject to a 3.8% tax either through Medicare payroll taxes or the Net Investment Income Tax (NIIT). However, taxpayers who both own and are employed by certain types of businesses can reallocate their compensation as “income from an activity in which the owner materially participates.” which isn’t subject to the 3.8% added tax. Other forms of business ownership/employment enable the same reclassification. This strategy is common and is one driving force of tax rate dispersion at higher incomes, as it is only available to some taxpayers.
Figure 4. Change in Standard Deviation of Effective Tax Rates from Baseline
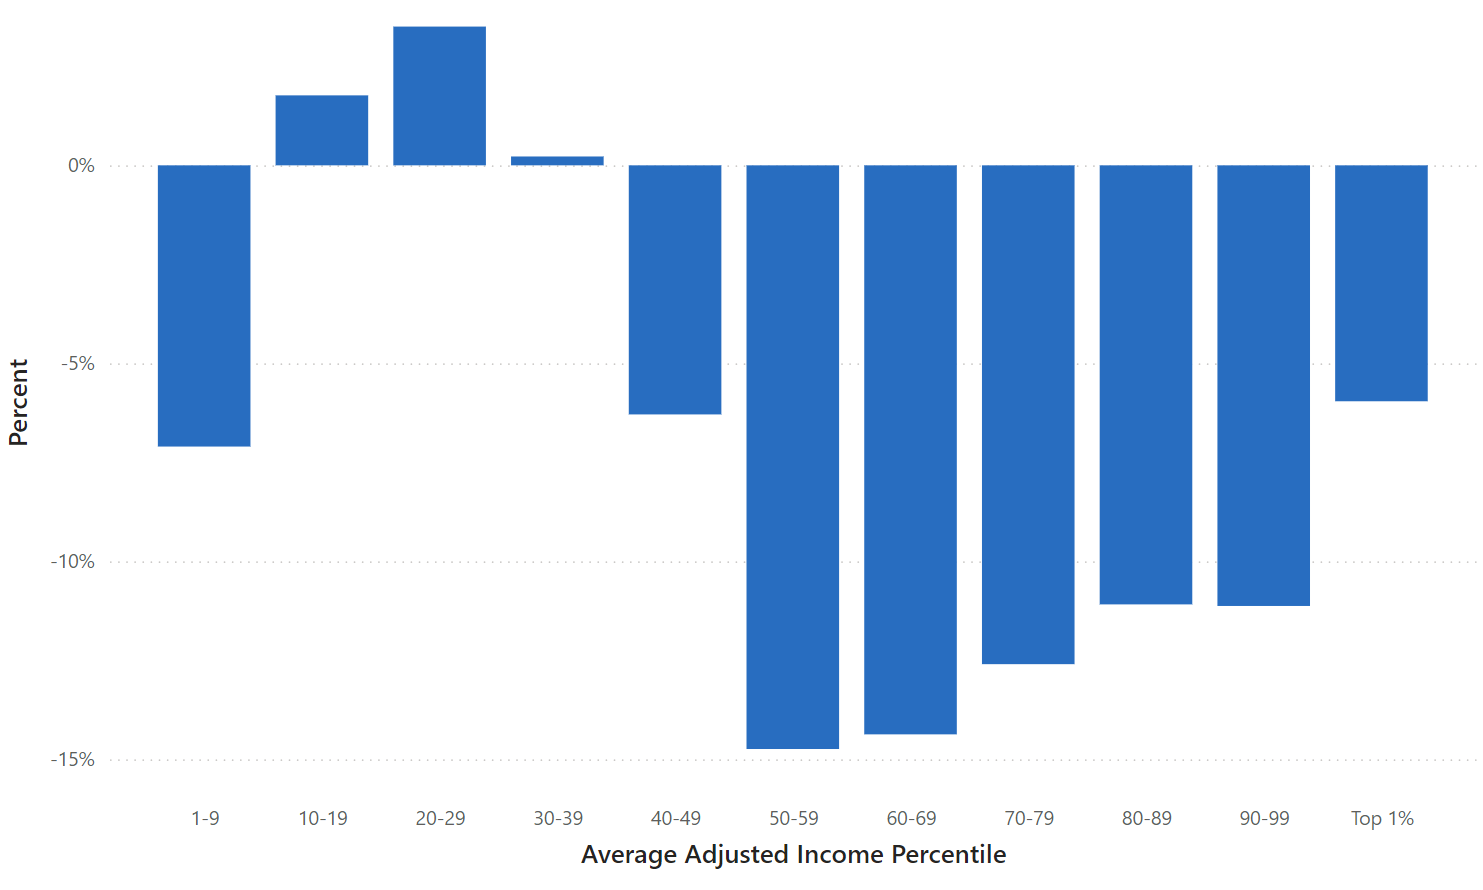
There is less horizontal equity in the U.S. tax code for those at the top of the income distribution than for those in the middle. However, it’s important to remember that horizontal equity isn’t the only metric by which a tax reform should be judged. In the TCJA extension scenario, for instance, tax rate variation at the top declines—the standard deviation of ETRs for those in the top decile drops by about one-eighth—because those at the top of the income distribution are now more likely to pay the same lower tax rate.
2. My son, the tax credit
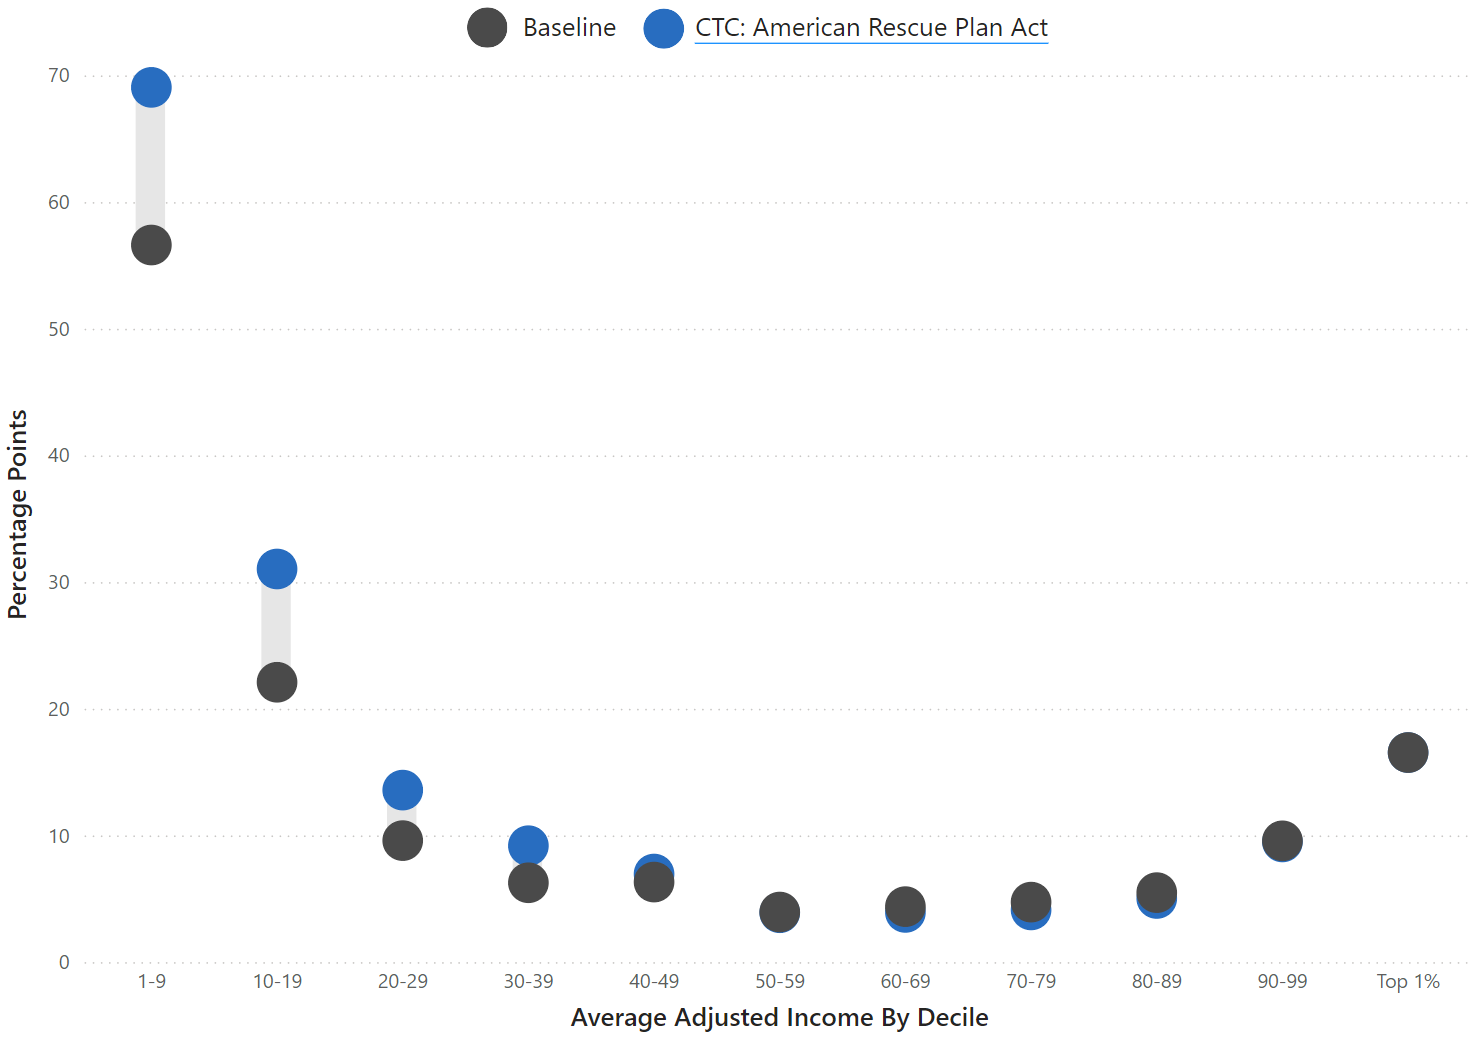
Two families are struggling to make ends meet, each earning around $25,000 a year. At that income, every penny counts, and tax time is even more stressful than usual. However, one family gets a refund while the other doesn’t. What’s the difference? One of them has a child, making them eligible for the Child Tax Credit. Under current law, this lowers their tax burden by $2,000, a big chunk of their yearly liability (about $3,000). (Under the 2021 law design of the CTC, the burden would be lowered by up to $3,600.) This is why the dots are so far apart for the low-income groups below. If you have a child, then the credit can substantially decrease your tax burden. Of course, this difference in tax treatment is the point of the CTC: while at first glance the two families are similar, in fact one of them faces more expenses every year because they have a child and is thus poorer on a per-person basis. This is why our analysis adjusts incomes in the data for family size and composition. By accounting for the higher expenses that families with children face, we can equate families with similar economic means rather than those that receive a similar dollar amount. Along this axis, we can see if policies like the CTC accomplish their goal of easing financial strain on families with children.
Figure 5: Standard Deviation of Effective Tax Rates by Adjusted Income Group
3. Sole proprietor? Solely responsible
Say you've spent years as a salaried employee making around $75,000 when you decide to strike out on your own. You become a contractor to set your own hours and work from home, and you’re lucky enough to make just about the same as when you had a boss. When tax time comes, you owe about 15% of that income in payroll taxes. Remember when your pay stubs had FICA taken out? Turns out your employer had to also pay that same amount every month. Now that you’re your own boss, you get to pay both. Now, our measure of income accounts for this discrepancy (see the Appendix for how we did it), which is why the dots are close to zero on the graph at this income level – but who’s directly paying that amount can change depending on your employment situation. Further, while tax rate dispersion is generated by differences in family size at the low end and income composition at the high end, middle-income families tend to be in similar situations. The income they tend to generate is taxed in the same way, and having another child does not significantly affect ETRs. To sum up, the ETRs of earners and families tend to be similar in the middle, with people living at comparable means and shouldering the same expenses as their peers.
Other forms of tax rate dispersion
The Budget Lab’s analysis is based on anonymized data derived from individual tax returns. That means that the measures of different types of income that we use are based on their definitions in U.S. tax law. But occasionally, the U.S. tax code is horizontally inequitable not only because different types of income are taxed at different rates – but because some forms of income are not treated as (taxable) income at all. While our analysis doesn’t account for these instances of horizontal inequity at the moment, incorporating them is on our agenda.
4. “Live, laugh, love” or “Buy, borrow, die”?
Wealth provides a lot of options to limit what you owe come Tax Day, and it can be as simple as this three-step process. First, buy something that’s going to appreciate, be it stocks, a third home, or the Ferrari you’ve wanted since you were 12. (If your annual compensation is in stock options, you can skip this step.) Second, borrow against that asset, which doesn’t count as taxable income or towards capital gains. Finally, die. Your heirs can settle your debts with the assets you leave in your estate – and won’t have to pay capital gains taxes when you die because of the “step-up” provision in the tax code. It’s important to enjoy your tax-free money in between steps two and three, but you can do that however you see fit. If you are already rich or can take deferred compensation in stock options, then this is a great way to make sure you pay little in income taxes. If you’re lucky, your children won’t have to, either.
As Zachary Liscow and Edward Fox detail, billionaires like Larry Ellison get to use this quirk of tax law to spend their unrealize assets as if they were cash. Rather than sell the asset and face capital gains, their appreciating stock funds everything from yachts to islands in Hawaii. The richer they get on paper, the more they can borrow tax-free.
5. Fly Me to the Moon
There are many ways to become super rich. You could found a hedge fund, write the song of the summer, or be an NBA superstar, but not all income is created equal in the eyes of tax law. Consider Frank Sinatra and Walmart founder Sam Walton. Sinatra earned much of his wealth onstage, being paid for his labor singing and performing. Conversely, Walton generated his wealth by holding stock. Under current tax law, Sinatra would owe 37% on his labor income, while Walton would only owe capital gains taxes on whatever stock he had sold, even after accounting for corporate income taxes. If Walton became much wealthier through ownership than Sinatra had by singing, and even if Walton sold stock worth as much as Sinatra had been paid, Sinatra would still owe more because of how he’d made it.
6. Do Corporations Dream of Financial Sheep?
The profits of corporations are taxed at the business level, but ultimately people – shareholders and workers – bear the economic incidence of corporate taxes. Because these profits are taxed at the corporate level before flowing to individuals, and because individuals at the same income level may own different amounts of stock, the corporate tax rate can have important implications for horizontal equity. While our tool doesn’t account for horizontal inequity caused by differences in corporate ownership within income groups, this remains an ongoing field of research that we are excited to continue examining.
Conclusion
As Congress considers what, if any, changes to make to the tax code next year, there are many places to improve fairness in the code. While a lot of attention will likely be given to how much corporations or high-income earners pay in taxes relative to the typical filer, this is significant variation in tax burdens among filers who earn the same amount of income too. The analysis above, highlights that the tax burdens for high income earners, for example, can diverge widely simply due to the type of income they receive, with their effective tax rates varying by as many as 50 percentage points. While tax liability varies between lower income Americans earning similar incomes, it stems predominantly from credits and exemptions rather than income formation. For policymakers, considering horizontal equity during the upcoming tax debate will allow them to see unfairness that otherwise may not be as apparent, and can help raise as much as $560 billion in additional revenue.
Appendix
Gravelle and Gravelle (2006) provide a methodology to examine the tax code’s equity along this line of inquiry. The authors address whether the tax code is equitable across family types and develop a methodology for equalizing income along said metric. Their index is quantified in the following equation:
with A being the number of adults, K the number of children, and P and e being coefficients for the rates at which a family’s expenses grow based on the number and composition of the family unit. INCraw is the income we observe in tax data, inclusive of employer’s share of payroll tax. We then solve the equation for INCnorm, normalized income. At e = 0, the above equation equals 1, and income remains unadjusted, implying that tax burden ought not to change based on family composition. If P = 0, then children pose no financial burden on parents, whereas if P = 1, a child is just as expensive as an adult. Gravelle and Gravelle set P = e = 0.7 for their analysis, but we can test whatever combinations we reason are appropriate.
Gravelle and Gravelle use their index to normalize income across family types to be in terms of a 2-adult household with no children. Consider the following equivalency used to equalize the income of a married household with one child:
The solution to the equation, about $50,000, implies that the family with a child and an income of $61,688 has the same ability to pay as a family without children earning $50,000.
The Budget Lab’s Measures of Horizontal Equity
In our analysis, we use Gravelle and Gravelle’s method to normalize income for each tax unit in our Tax Simulator (so that it is expressed in terms of equivalent income for a two-adult, zero-child household), and then consider each tax unit’s net individual income tax liability. Importantly, we do not normalize liability. We then group tax units within comparable normalized income categories and calculate summary statistics with regards to their liability, including average tax rate for the group, the lowest and highest ETRs, interquantile ranges, and the standard deviation of the group’s ETR.
We use the resulting output to create several charts: first, a “barbell” chart depicting the standard deviations for the baseline and scenario for each income group, with a bar measuring the delta between them. Second, we produce a chart depicting the deltas between the baseline and scenario standard deviations. Finally, we produce the same level chart, but measured as a percent change relative to the baseline. (For example, a standard deviation going from .04 in baseline to .05 in scenario is a small level difference, but a meaningful percentage change.)
For all these charts, users can select income group(s), toggle various aspects of tax law, and see how different tax codes affect horizontal equity. Further, users may select their own values for P and e, letting them explore how measures of horizontal equity vary depending on income, ability to pay, and child expenditure.
Using both levels and deltas in standard deviations neatly demonstrates the horizontal equity of each policy setting. If levels are low, then the policy is more horizontally equitable; if a scenario increases the standard deviation, then the tax code less horizontally equitable relative to the baseline. Importantly, Gravelle and Gravelle’s methodology allows us to control for family composition and size, while leaving out other variables that might have important consequences for equity. As Dorothy Brown notes in The Whiteness of Wealth, the marginal benefit of filing jointly is more beneficial for a household with one earner than two, even at the same combined income level. Future analysis could take this into consideration and control for other tax-pertinent characteristics.
Footnotes
- We ran a counterfactual policy reform in which we eliminated most items that could be considered tax expenditures under the individual income tax code. This includes the QBI deduction, itemized deductions, preferential rates for capital gains and dividends, the AMT, and all personal credits, including the CTC, EITC, CDCTC, education credits, and more. The amount of tax paid under this scenario is defined as the “effective statutory rate” and is the benchmark against which current law ETRs are compared. Because Adjusted Gross Income (AGI) is generally equal to taxable income under this scenario, bracket assignment is based on AGI.
- We also simulated a reform scenario where we eliminated all preferences except those two credits, the results of which looks very different for the lower end and nearly identical at higher incomes (see Appendix).
- Put simply, this test aims to generate the same amount and distribution of tax liability as our current tax code, but to do so exclusively by way of marginal tax rates rather than the more complex system of deductions, credits, and preferred income. We still distinguish between filing statuses (single/married filing single, married jointly, head of household), keep their accompanying income bracket cutoffs, and generate the same amount of revenue from each bracket.