
Evaluating the Impact of AI on the Labor Market: Current State of Affairs
Key Takeaways
-
While the occupational mix is changing more quickly than it has in the past, it is not a large difference and predates the widespread introduction of AI in the workforce.
-
Currently, measures of exposure, automation, and augmentation show no sign of being related to changes in employment or unemployment.
-
Better data is needed to fully understand the impact of AI on the labor market.
-
We plan on updating this analysis regularly moving forward to see how the impact of AI on the labor market changes over time.
How has AI impacted the labor market? Since generative AI was first introduced nearly three years ago, surveys show widespread public anxiety about AI’s potential for job losses. While it is impossible to accurately predict the future, we can examine how U.S. employment has changed since ChatGPT’s release in November 2022.
Our analysis complements other recent studies that provide nascent evidence of possible AI impacts on specific occupations and sub-populations, such as early career workers. We took a broader lens, widening the aperture to the whole labor market, and asked two main questions.
First, is the pace of labor market change in this 33-month period of employment disruption different from past periods of early technological change? Second, is there evidence of economy-wide employment effects? To answer these questions, we compare how quickly the occupational mix has changed across a range of measures since ChatGPT’s launch, and compare this to past disruptions from computers and the internet.
Overall, our metrics indicate that the broader labor market has not experienced a discernible disruption since ChatGPT’s release 33 months ago, undercutting fears that AI automation is currently eroding the demand for cognitive labor across the economy.1
While this finding may contradict the most alarming headlines, it is not surprising given past precedents. Historically, widespread technological disruption in workplaces tends to occur over decades, rather than months or years. Computers didn’t become commonplace in offices until nearly a decade after their release to the public, and it took even longer for them to transform office workflows. Even if new AI technologies will go on to impact the labor market as much, or more, dramatically, it is reasonable to expect that widespread effects will take longer than 33 months to materialize.
Of course, our analysis is not predictive of the future. We plan to continue monitoring these trends monthly to assess how AI’s job impacts might change. It is important to remember that the effects of new technologies are evolving and a simple snapshot in time is not enough to explicitly determine what the future holds.
Is this Time Different? Changes in the Occupational Mix
The current rhetoric about AI mirrors the anxiety over earlier generations of technological progress. So far, is this time different?
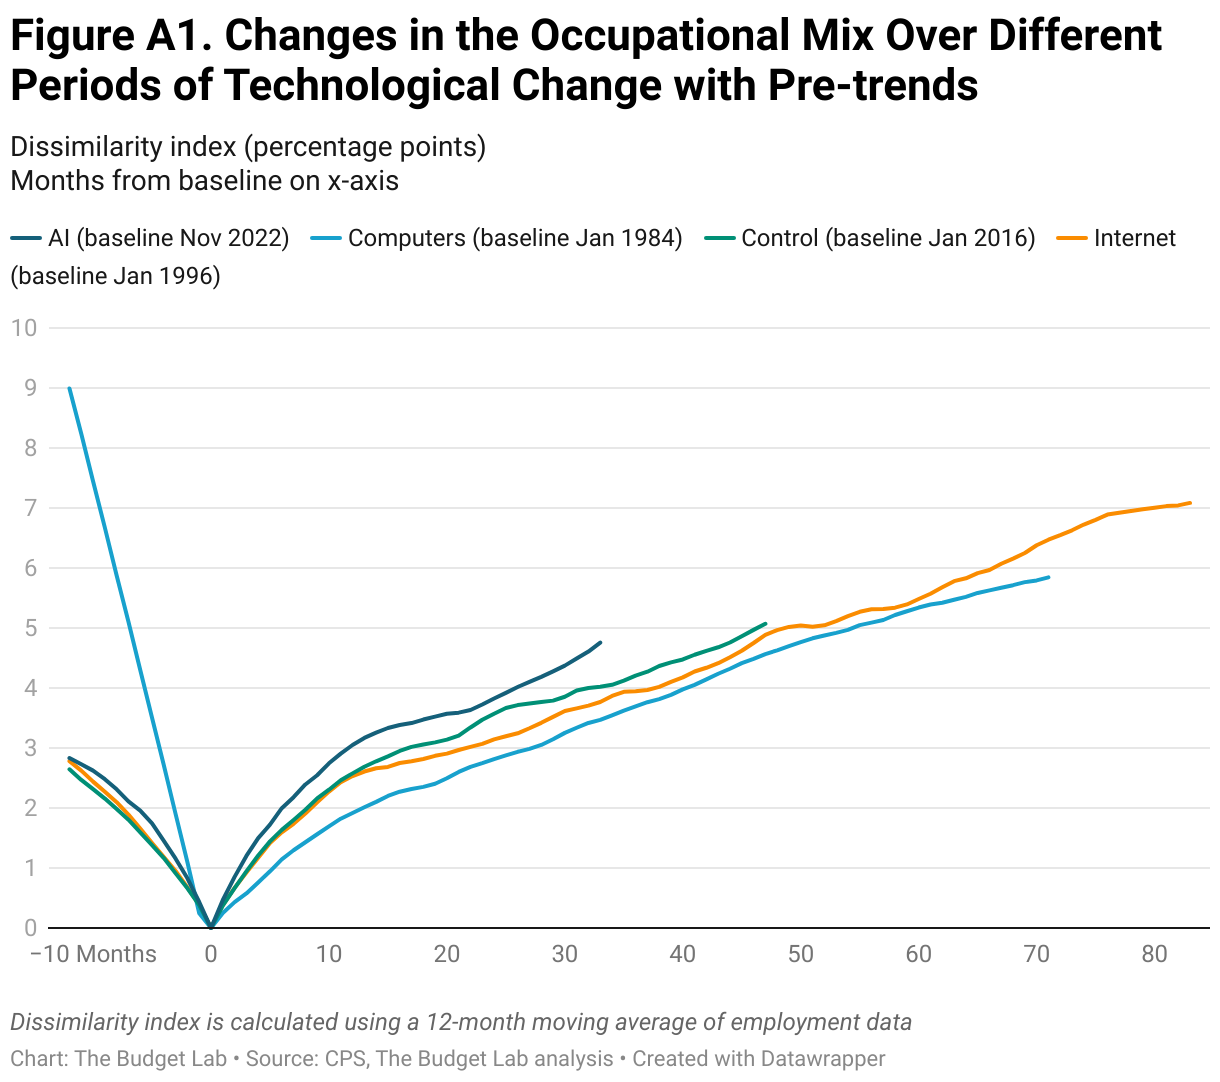
First, we look at how quickly the overall occupational mix changed in the first 33 months since ChatGPT’s relative to previous periods of technological change. Figure 1 compares the occupational mix by month to the mix in a baseline period at the start of a major technological development (e.g. January 1996 is the baseline month for the growing adoption of the internet). The job mix for AI appears to be changing faster than it has in the past, although not markedly so. (See the appendix for a discussion of pre-trends.)
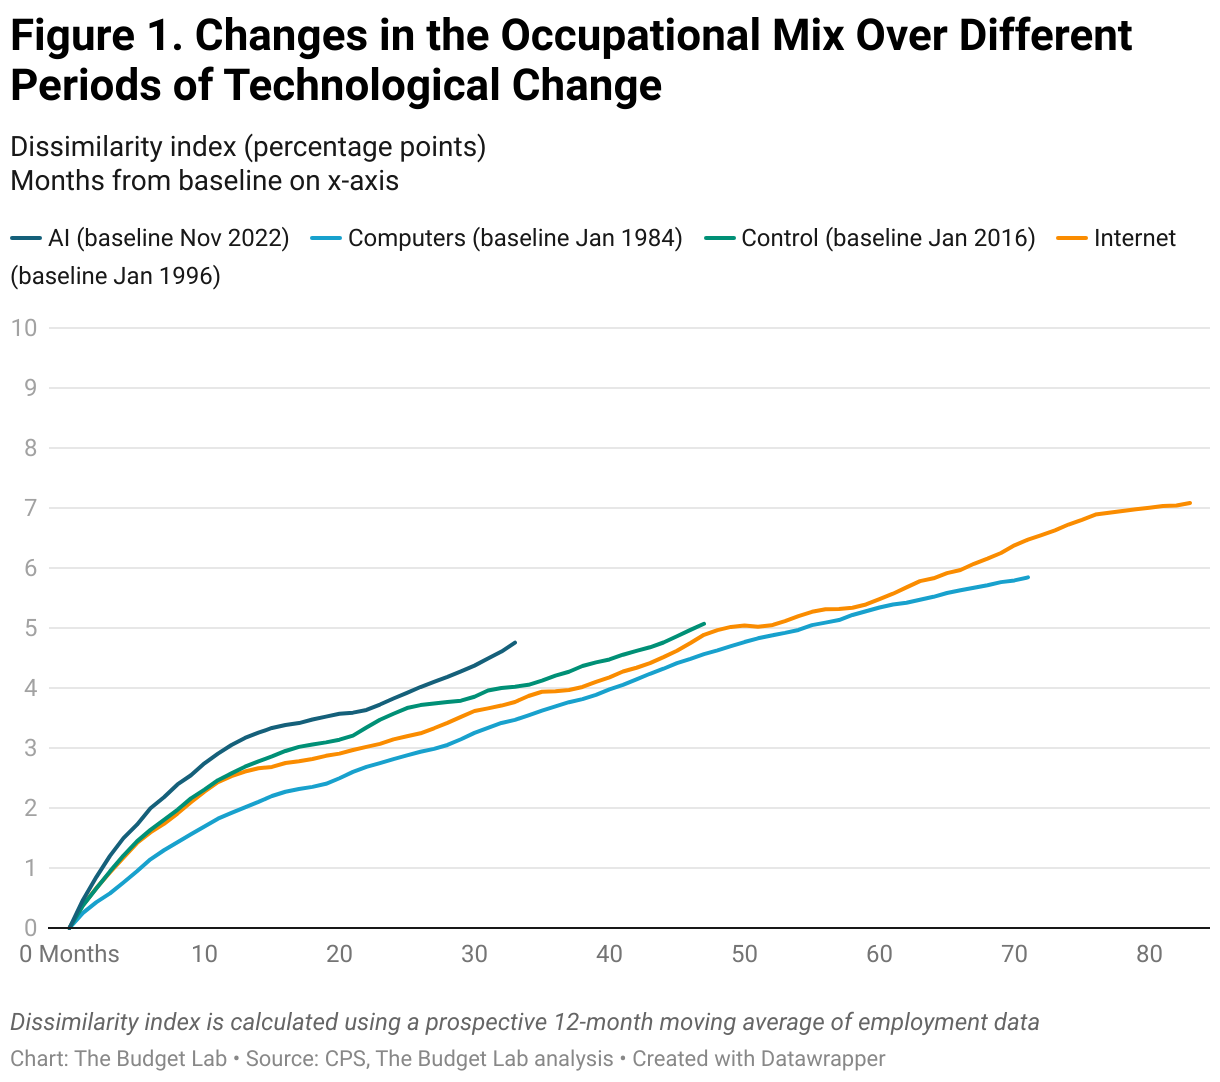
The occupational mix refers to the distribution of workers amongst all the jobs in the economy. In this context, a percentage point difference means that, relative to the start point, that percent of workers are in new occupations. This can occur by workers changing jobs, losing jobs, or unemployed people getting a new job. As such, this metric attempts to capture how different the sum of occupations that make up the labor force is relative to another point in time. By measuring this over the time generative AI has been publicly available, we can test the claim that AI is substantially changing the workforce by any of the methods mentioned above (pushing workers from one job to another, automating workers out of a job, or creating new jobs). Note that a change over this time period simply reflects change — it does not take a stance on the cause of that change. Note that if recent grads are not getting hired, that would show up in this measure in as much as recent grads (as discussed below) are often in different occupations than older workers.
With the development of the internet and the growing prevalence of computers, the turn of the 21st century gave rise to concerns over an imminent computerization of many jobs. Despite this automation anxiety, the occupational mix by 2002 was at most around 7 percentage points different than it was in 1996; i.e., only 7 percent of workers in 2002 would need to switch occupations to match the composition of the 1996 labor market.
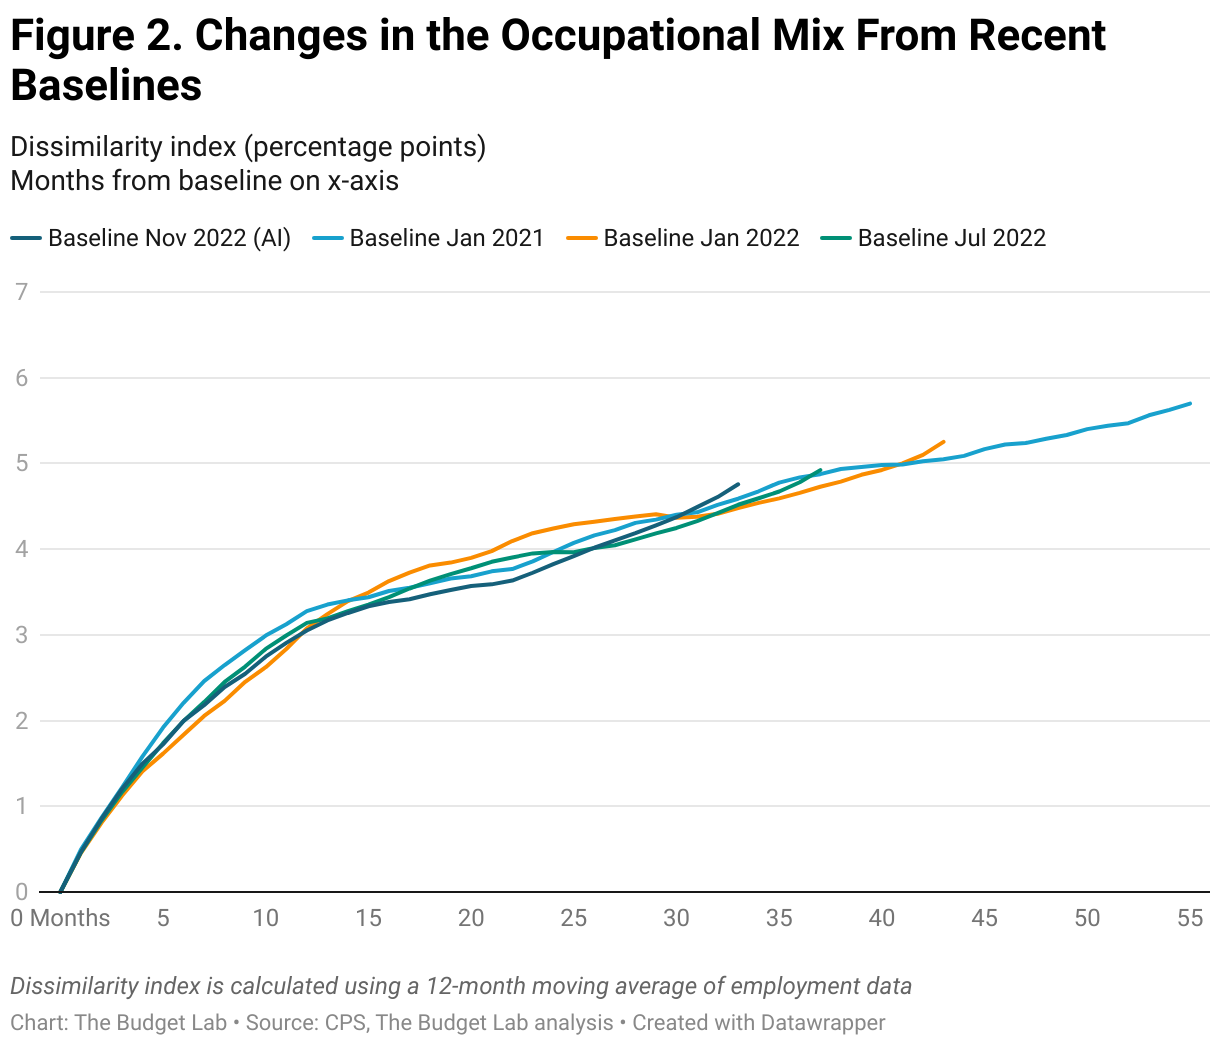
Changes in the occupational mix since the advent of generative AI in 2022 seem to mirror the trends seen during the three comparison periods. The recent changes appear to be on a path only about 1 percentage point higher than it was at the turn of the 21st century with the adoption of the internet. Although recent trends seemingly outpace historical shifts in the occupational mix, the potential effects of AI on the labor market so far are not out of the ordinary. In fact, taking a closer look at recent years, the data suggests that this recent trend is not necessarily attributable to AI (Figure 2). Shifts in the occupational mix were well on their way during 2021, before the release of generative AI, and more recent changes do not seem any more pronounced, even as the use of AI continues to grow in popularity.
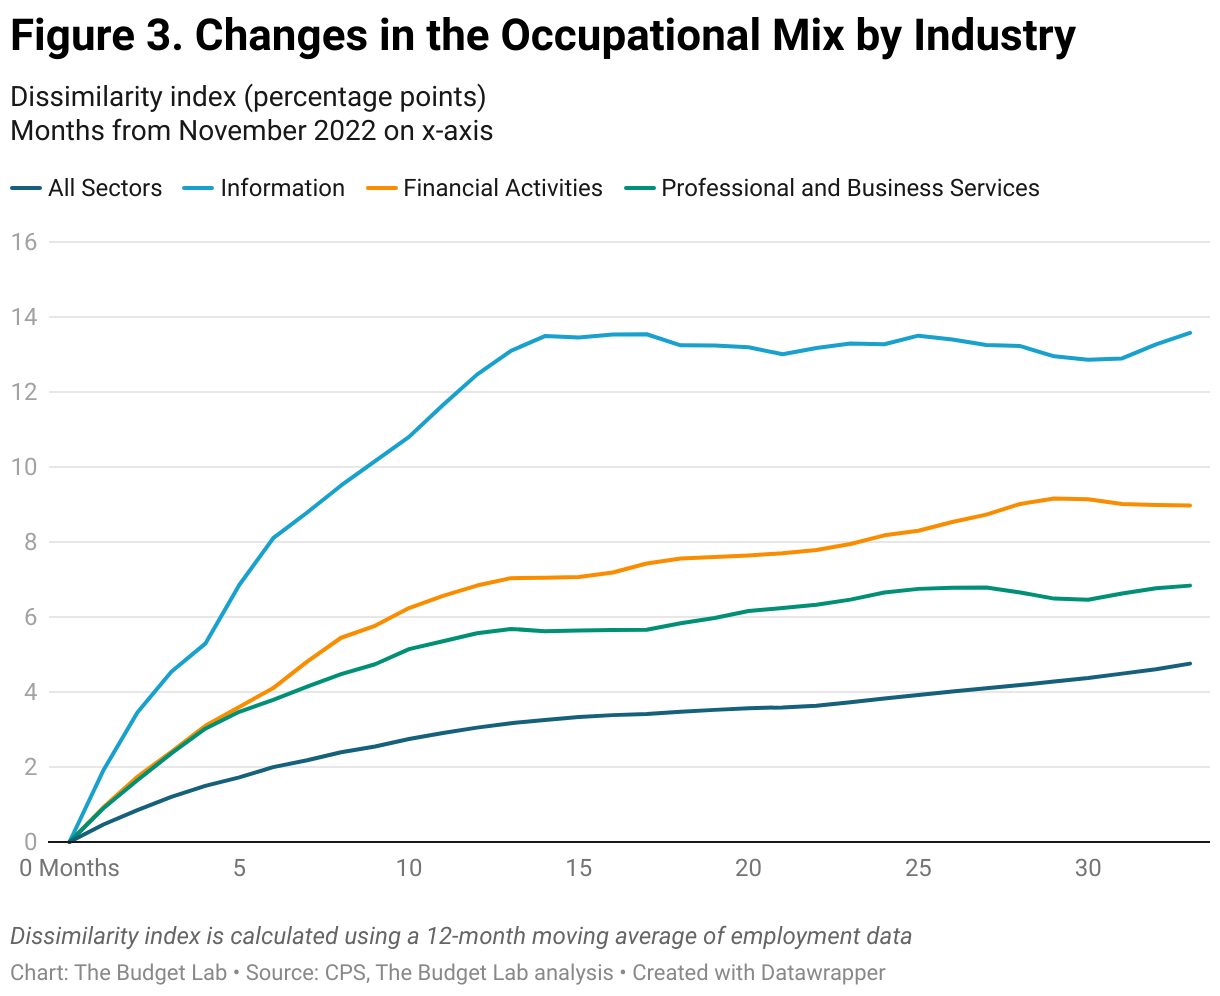
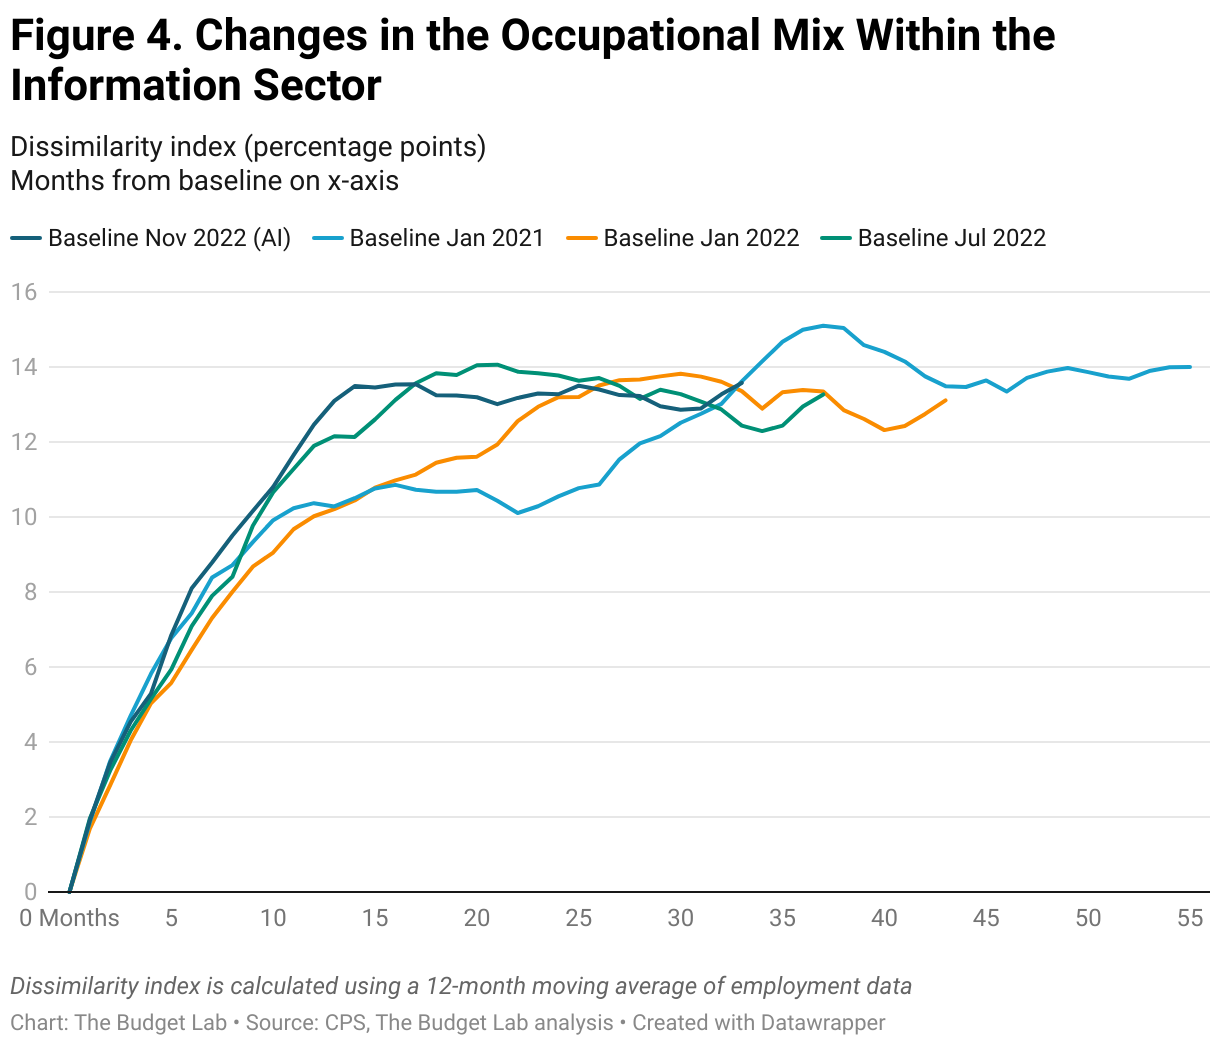
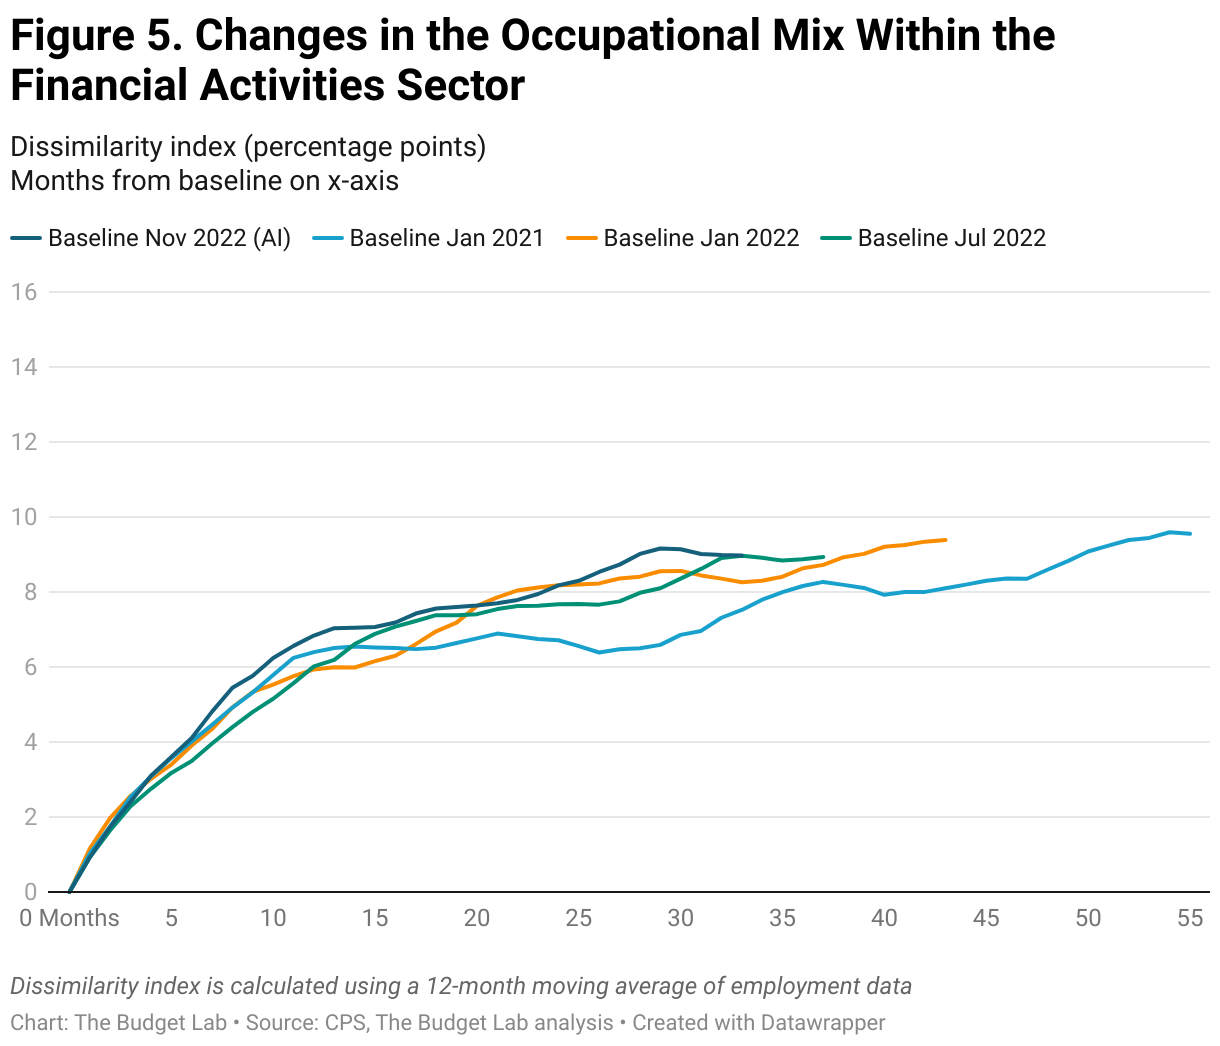
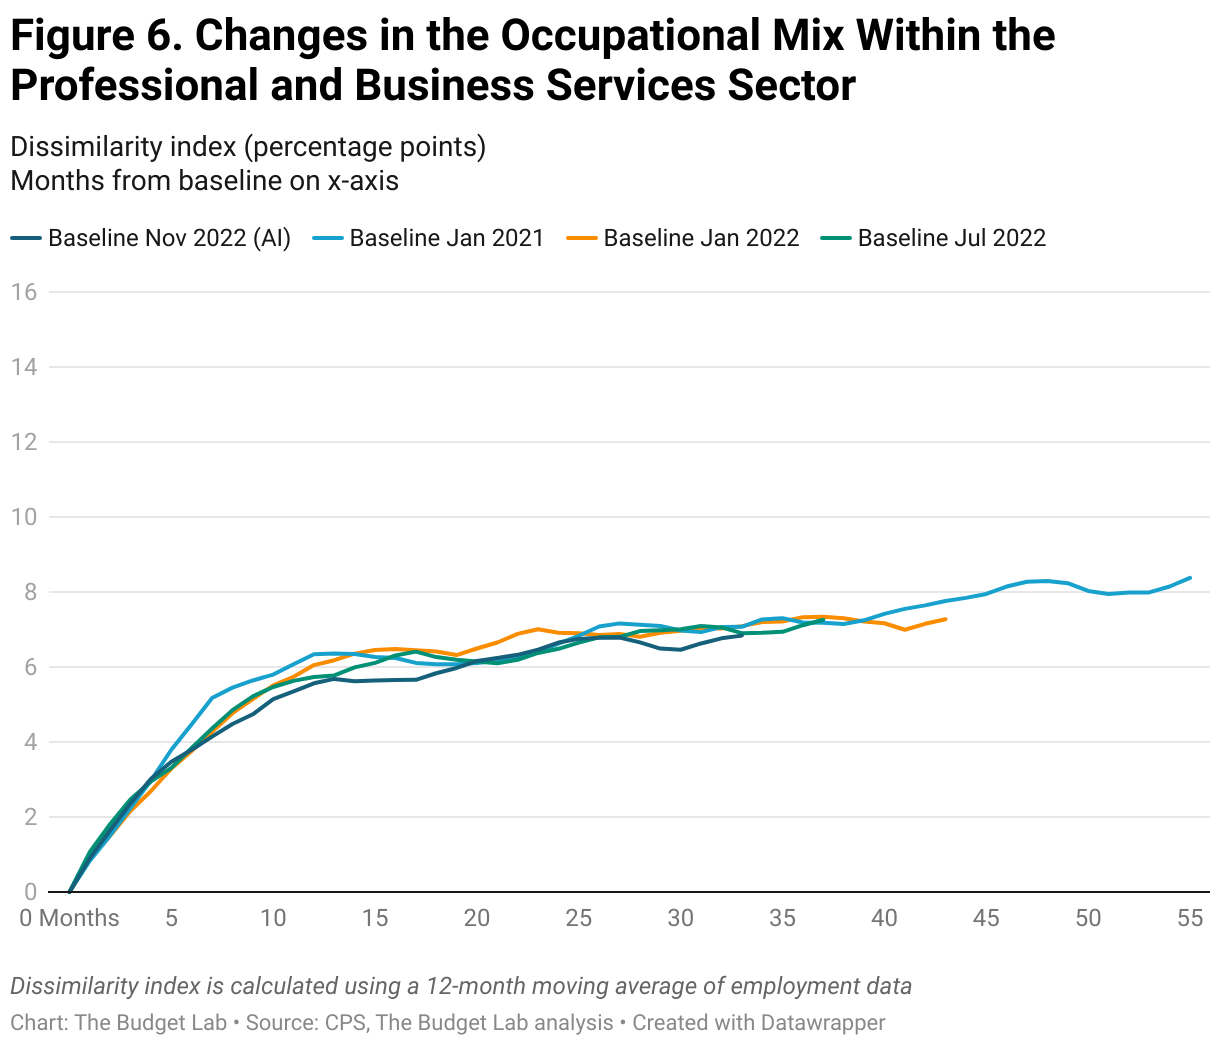
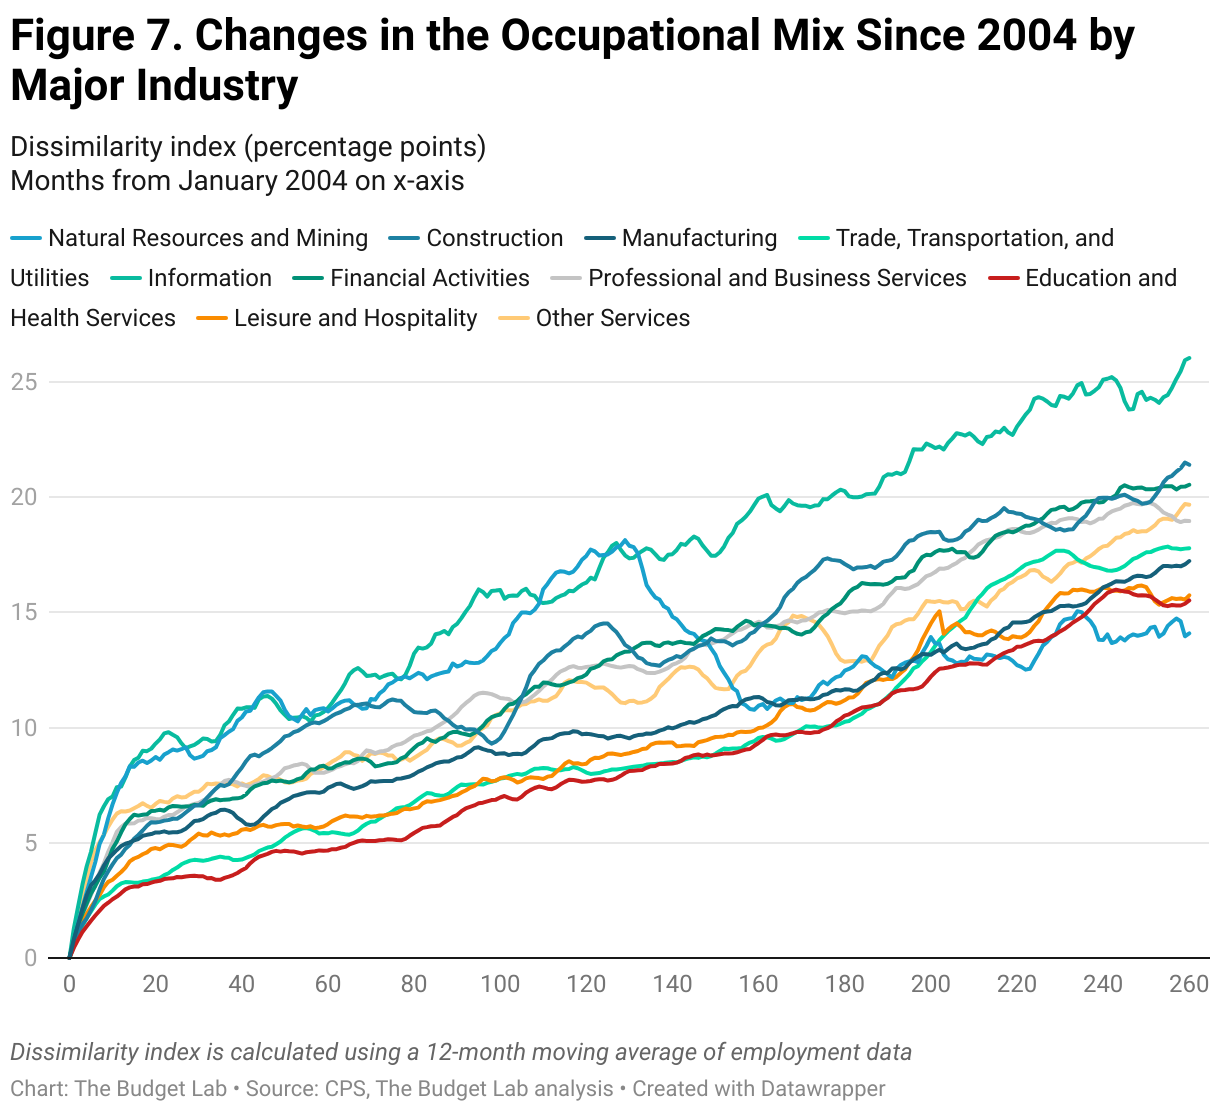
Repeating this analysis by industry similarly suggests a limited effect of AI. Figure 3 reports the change in the occupational mix from November 2022 within different industries. The Information, Financial Activities, and Professional and Business Services sectors have all seen larger shifts in the job mix compared to the shifts in the aggregate labor market, with the largest changes in the Information sector. (As a reminder the information sector includes things like newspapers, movies, and data processing.) These industries are among those with the highest exposure to generative AI. Although at first glance these changes may seem attributable to generative AI, the data again suggests that the trends within these industries started before the release of ChatGPT (Figures 4-6). In fact, over a broader time horizon, the large shifts in the Information Industry seem to be a feature of the industry itself rather than a consequence of any one technological development (Figure 7).
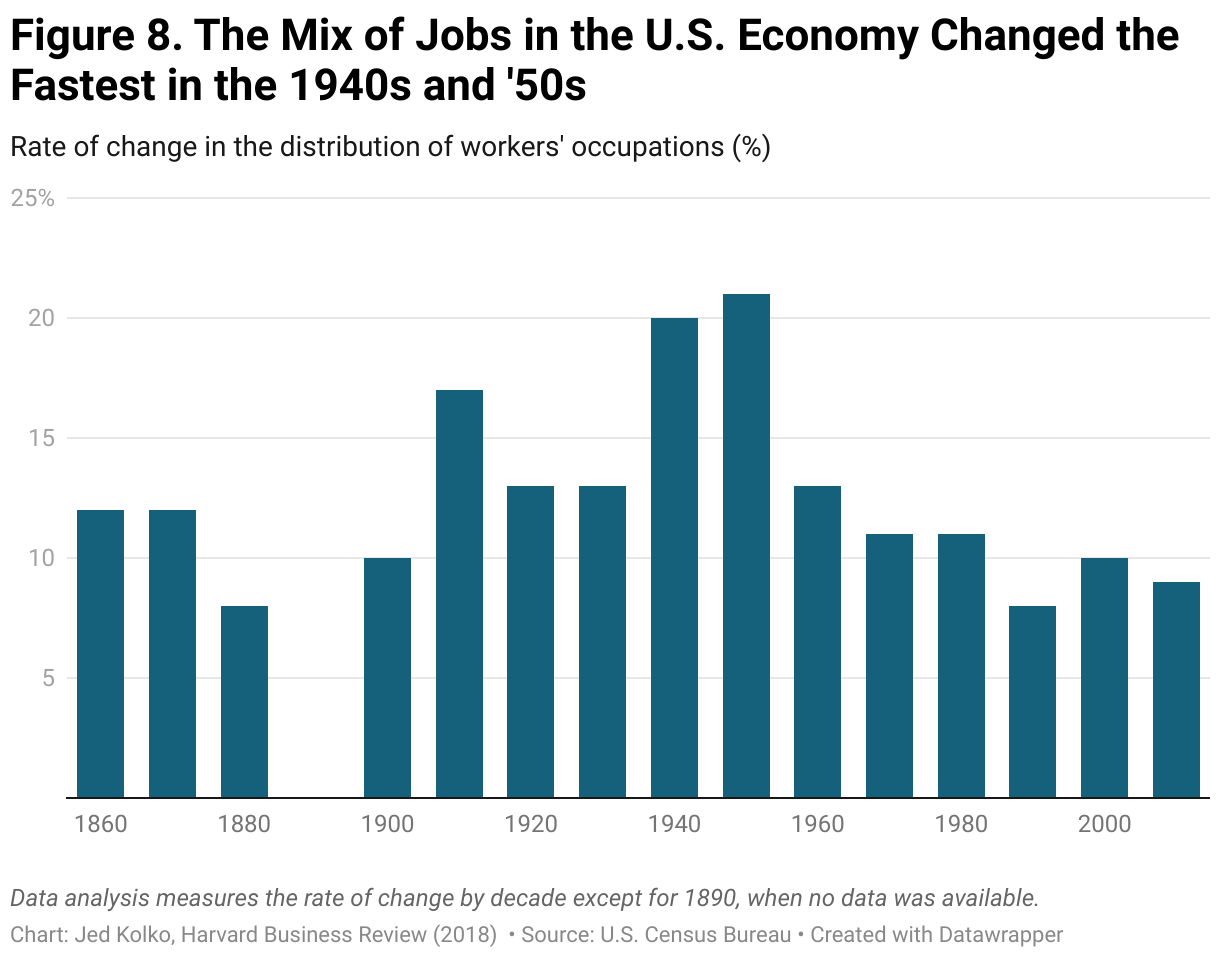
Looking over an even longer horizon, labor market volatility appears rather low. As a chart Jed Kolko shows, the change in the occupational mix seen in Figure 1 is sluggish compared to the change seen in the 40s and 50s (which reflected mass labor market changes due to world events). Kolko cautioned that “we simply don’t know for sure whether automation, algorithms, and AI will ultimately create more jobs than they destroy.”
The dissimilarity data we have examined indicates that there is no substantial acceleration in the rate of change in the composition of the labor market since the introduction of ChatGPT. Lacking that, there is nothing meaningful we can either attribute or misattribute to AI.
Recent College Graduates
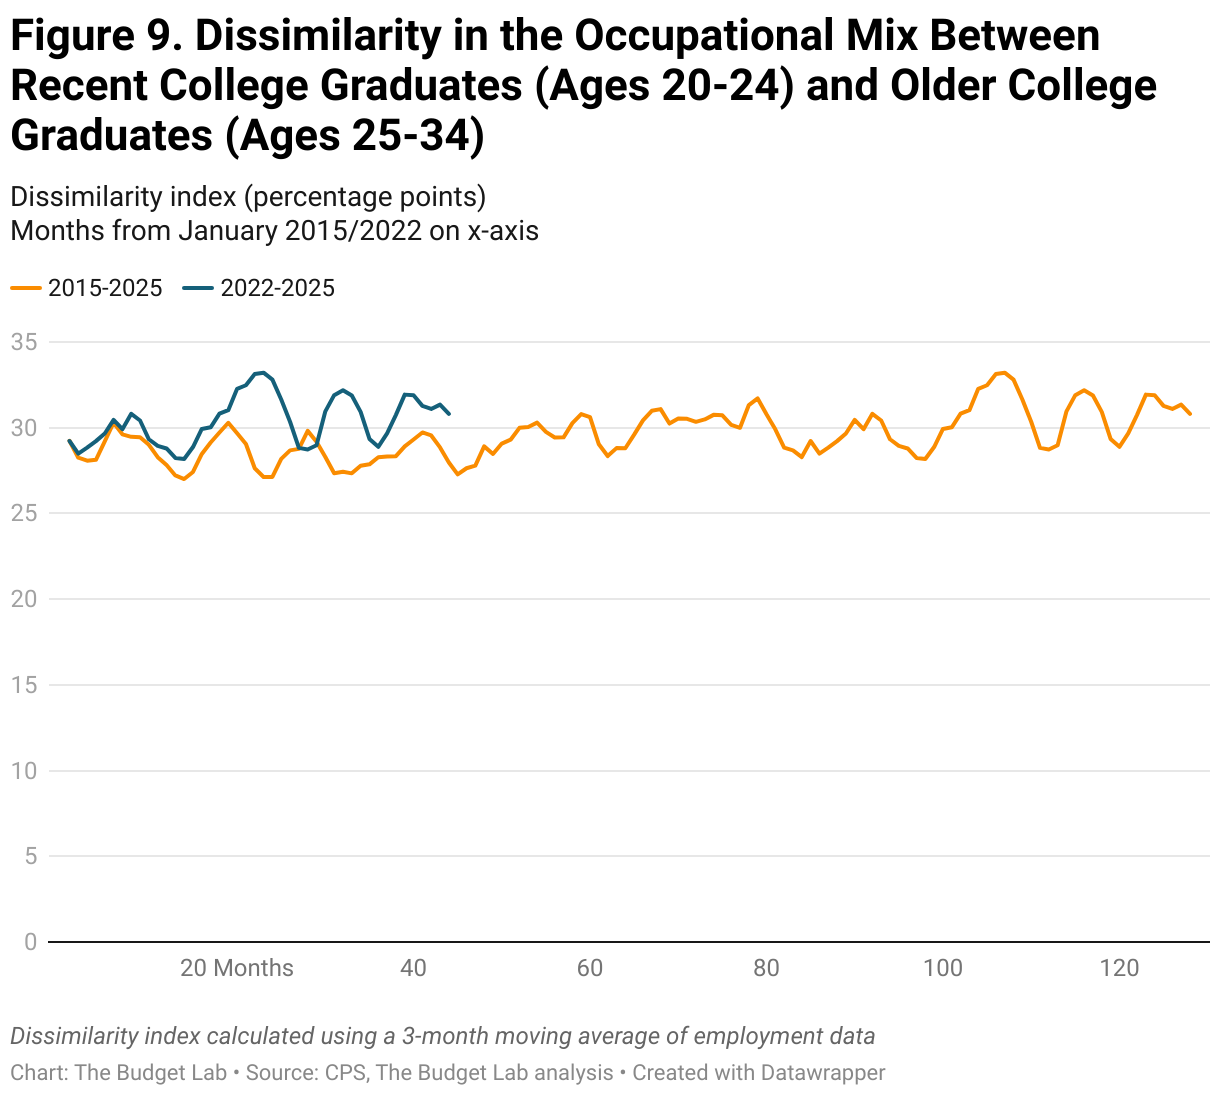
Figure 9 compares the occupational mix for recent college graduates (ages 20-24) to that of their older counterparts (ages 25-34).2 If generative AI were in fact substantially changing the labor market for recent college graduates, we would expect to see a growing dissimilarity in the occupational mix between these two groups. The dissimilarity has increased slightly faster in recent months than it did in a previous time period, which could be consistent with a recent paper from Brynjolfsson et al. showing a possible impact of AI on employment of early career workers. It could also simply reflect a slowing labor market. However, our results should be interpreted with caution particularly given small sample sizes.
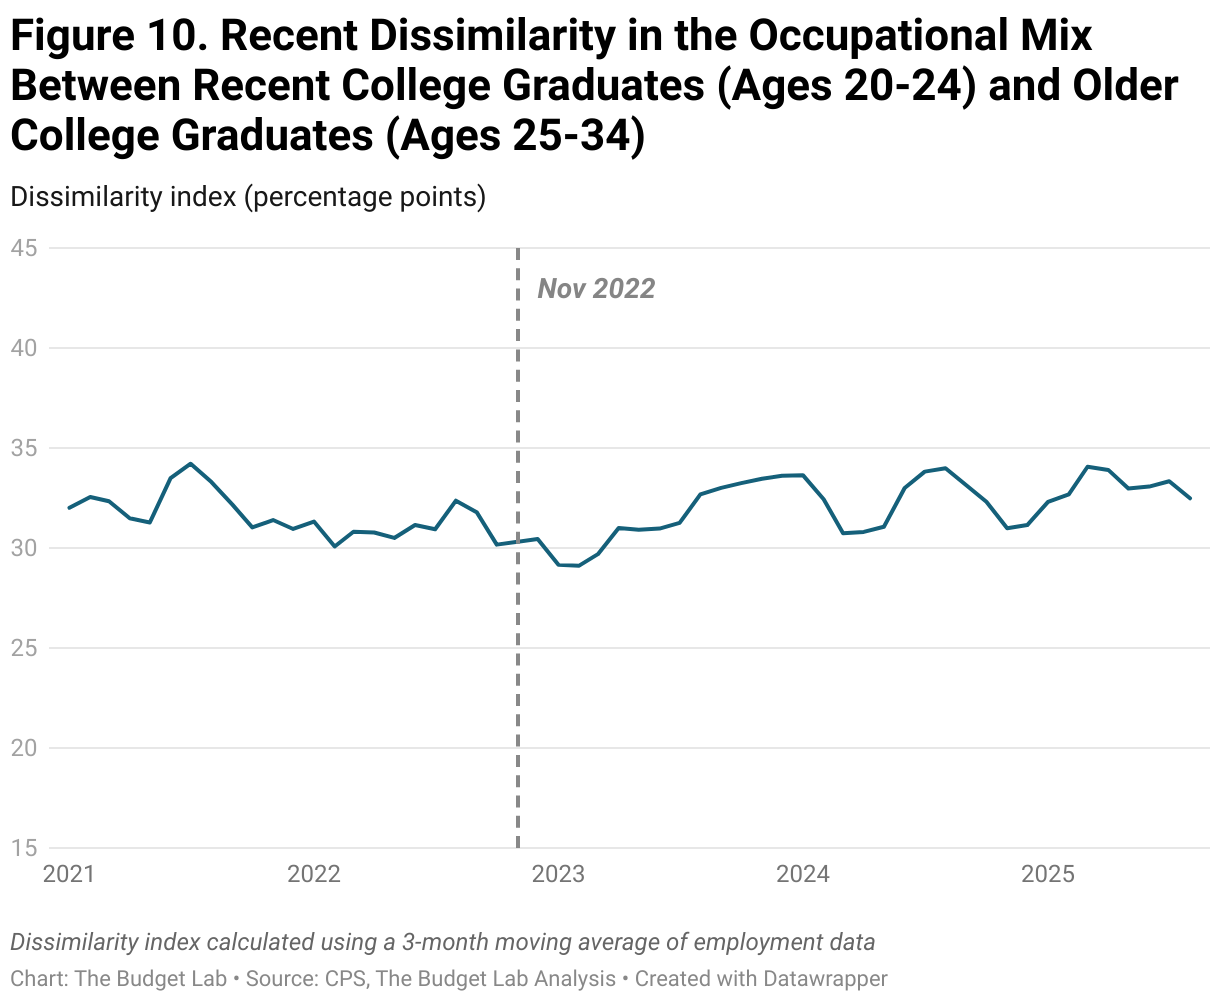
Taking a closer look at the trend since January 2021, the dissimilarity between older and more recent college graduates rarely deviates outside of the 30-33% range (Figure 10). This implies that these trends of growing dissimilarity may pre-date ChatGPT’s release and may not be attributable to AI. However, there is perhaps some slight upward momentum more recently, though this is consistent with both Brynjolfsson et al.’s work and the CPS’s noisiness (and a slowing labor market hitting younger workers). Further, the same caution in interpretation given the small sample sizes holds in this figure as well.
Insights from AI "Exposure" and Usage
To better understand whether AI is impacting the labor market, we would want to analyze whether the share of workers in occupations that are most impacted by AI usage is changing over time. If AI were automating jobs at scale, we would expect to see a smaller share of workers in some of the jobs that are most negatively impacted.
Unfortunately, comprehensive usage data is not publicly available. The best available data we have is from OpenAI and Anthropic, respectively, that detail the occupations that are most “exposed” to genAI tools (a theoretical, forward-looking metric across all jobs) and that have the highest actual usage of one specific AI tool, Claude (a more narrow, present-focused metric). While imperfect, these data are our best approximation of AI job “risk”. (See discussion of limitations in the next section and in the appendix.)
Importantly, OpenAI and Anthropic are measuring different things and we look at them separately.
OpenAI's "Exposure" Data
We use data from OpenAI that shows a measure of “exposure” to ChatGPT technology. This refers, generally, to whether utilizing ChatGPT4 technology can help reduce the time it takes to complete the occupation’s tasks by at least 50%. (The data appendix describes this metric in more detail.)
We utilize the “Beta” exposure metric, which also accounts for if a model with additional software built on top of it can help reduce task completion time, though this capability is weighted half that of “direct” exposure. An exposure score is created on a scale from 0 to 1 based on a percent of an occupation’s tasks that are “exposed” to genAI. The data appendix describes this metric in more detail.
For our purposes, we categorize occupations into three groups using their exposure score quintile; an occupation has the lowest degree of exposure if it falls in the first two quintiles, a medium degree if in the 3rd and 4th quintiles, and the highest degree if in the top quintile. In other words, these metrics look at relative not absolute exposure. We provide a further discussion of this in the appendix.
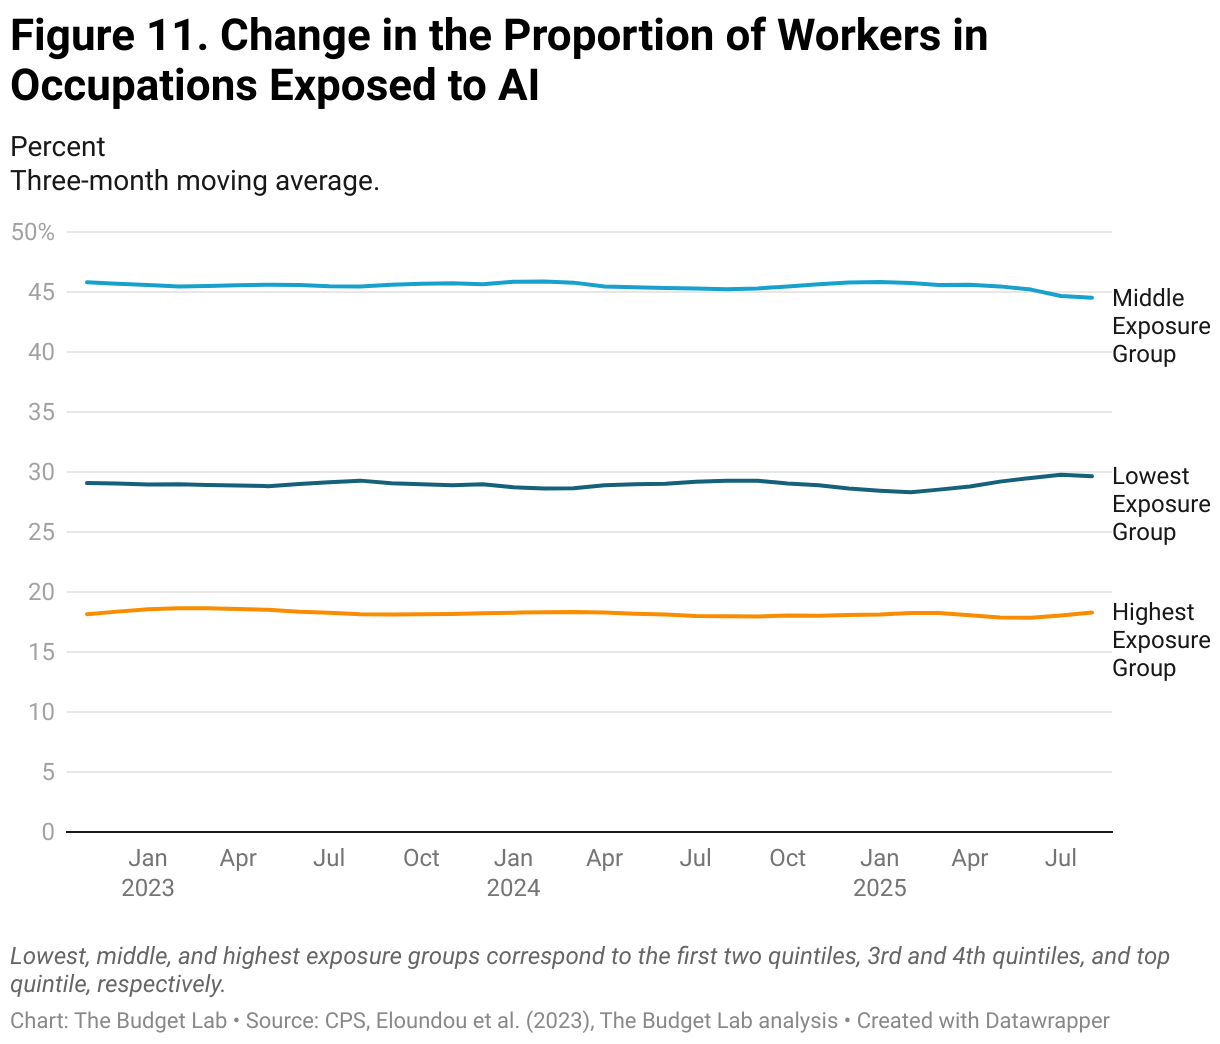
We ask: has the share of workers in occupational exposure quintiles changed since ChatGPT’s launch? Our analysis shows that it has not (Figure 11). The share of workers in the lowest, middle, and highest occupational exposure groups stay stable at around 29%, 46% and 18%, respectively.
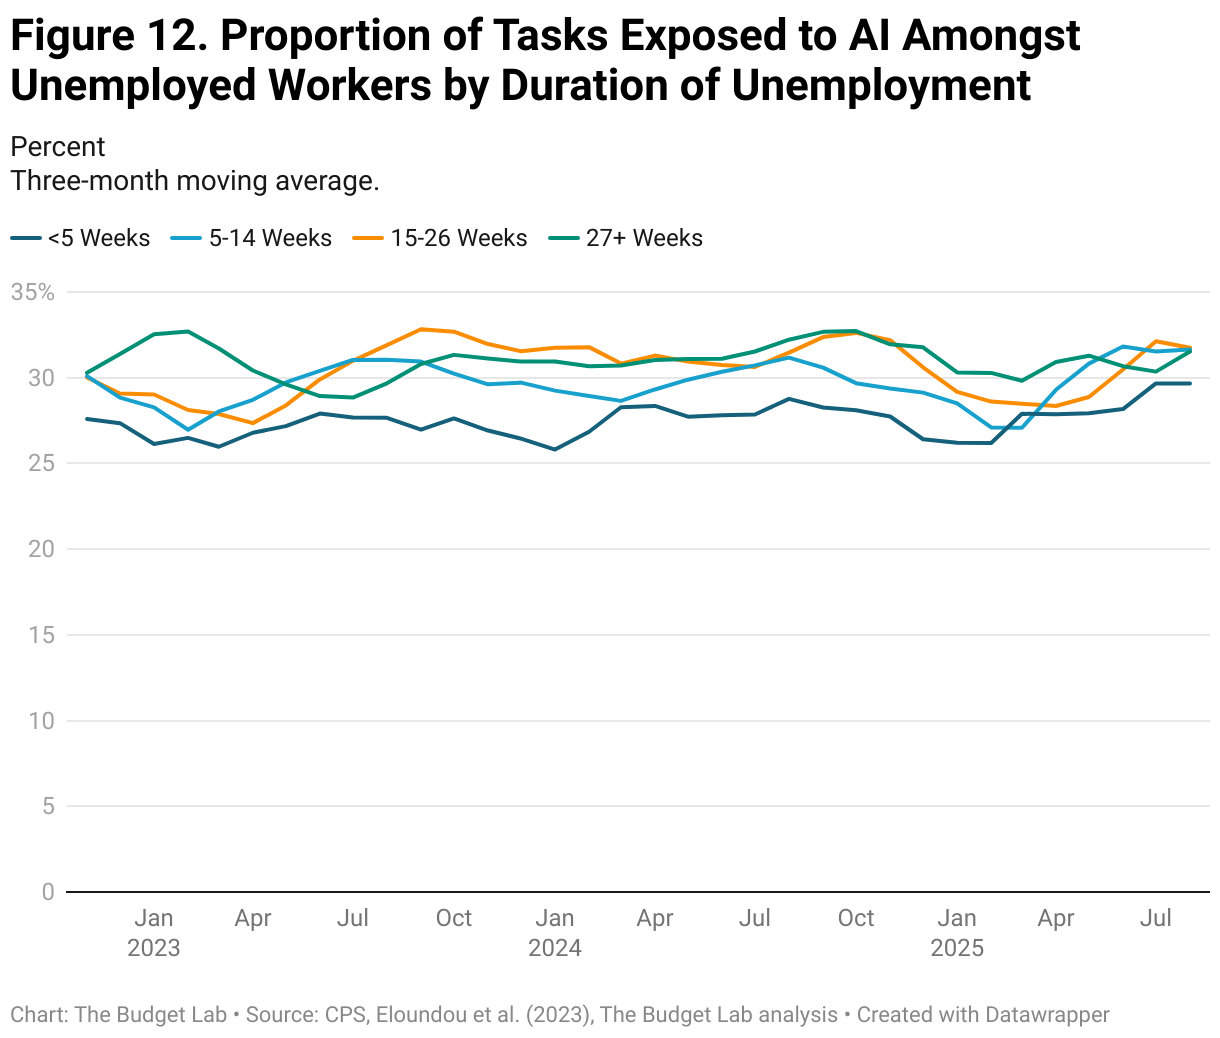
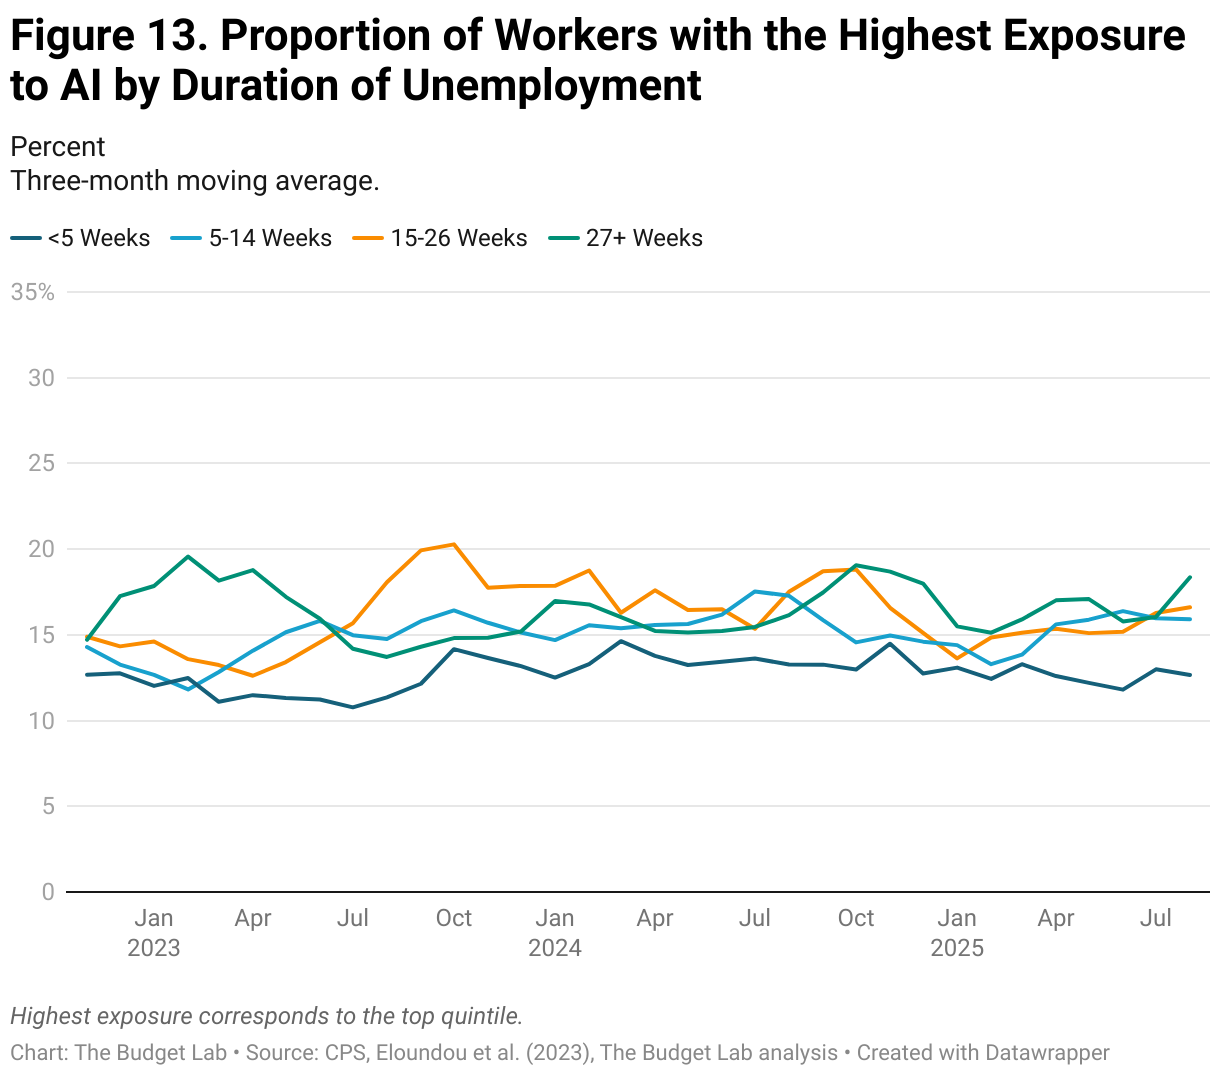
Even when specifically examining the unemployed population, there is no clear growth in exposure to generative AI. Figure 12 depicts the average percentage of tasks exposed amongst unemployed workers by duration of unemployment. AI-driven displacement might suggest a growth in the proportion of exposed tasks amongst recently unemployed workers. Irrespective of the duration of unemployment, however, unemployed workers were in occupations where about 25 to 35 percent of tasks, on average, could be performed by generative AI. Although there is some variation between months, the data demonstrate no clear upward trend and no clear difference by the duration of unemployment.
Anthropic's Usage Measure
Given Anthropic’s usage data’s novelty and uniqueness, there is no established standard for how to aggregate it. The usage Anthropic observes does not contain every single task in the O*NET task database, so the question of how to handle the missing tasks remains ambiguous. We proceed in two ways:
First, we ignore tasks that are not included in the Anthropic data and aggregate following the method detailed in the appendix. This method makes no assumption about how workers are using or could utilize Claude to perform the task, or how workers in occupations with tasks like those observed would use Claude. However, this method significantly limits the number of tasks and therefore occupations we can include. Further, an occupation may appear to have very high usage while in fact only a single of that occupation’s tasks were observed in the data.
Alternatively, we include all of the missing tasks and assume their usage is zero. There is some truth to this, as those tasks were not observed in Claude during the period in which the data was collected. However, it makes strong assumptions about those tasks’ potential usage. Two comparable tasks, where one appears in the data and one does not, would have totally different usage values. Given how the observed Claude data is a representation of the users who happened to utilize the model over a sample period, the following period could have had that similar task included.
In pursuit of a balanced and well-informed exploration of this data, we include results from both methods below.
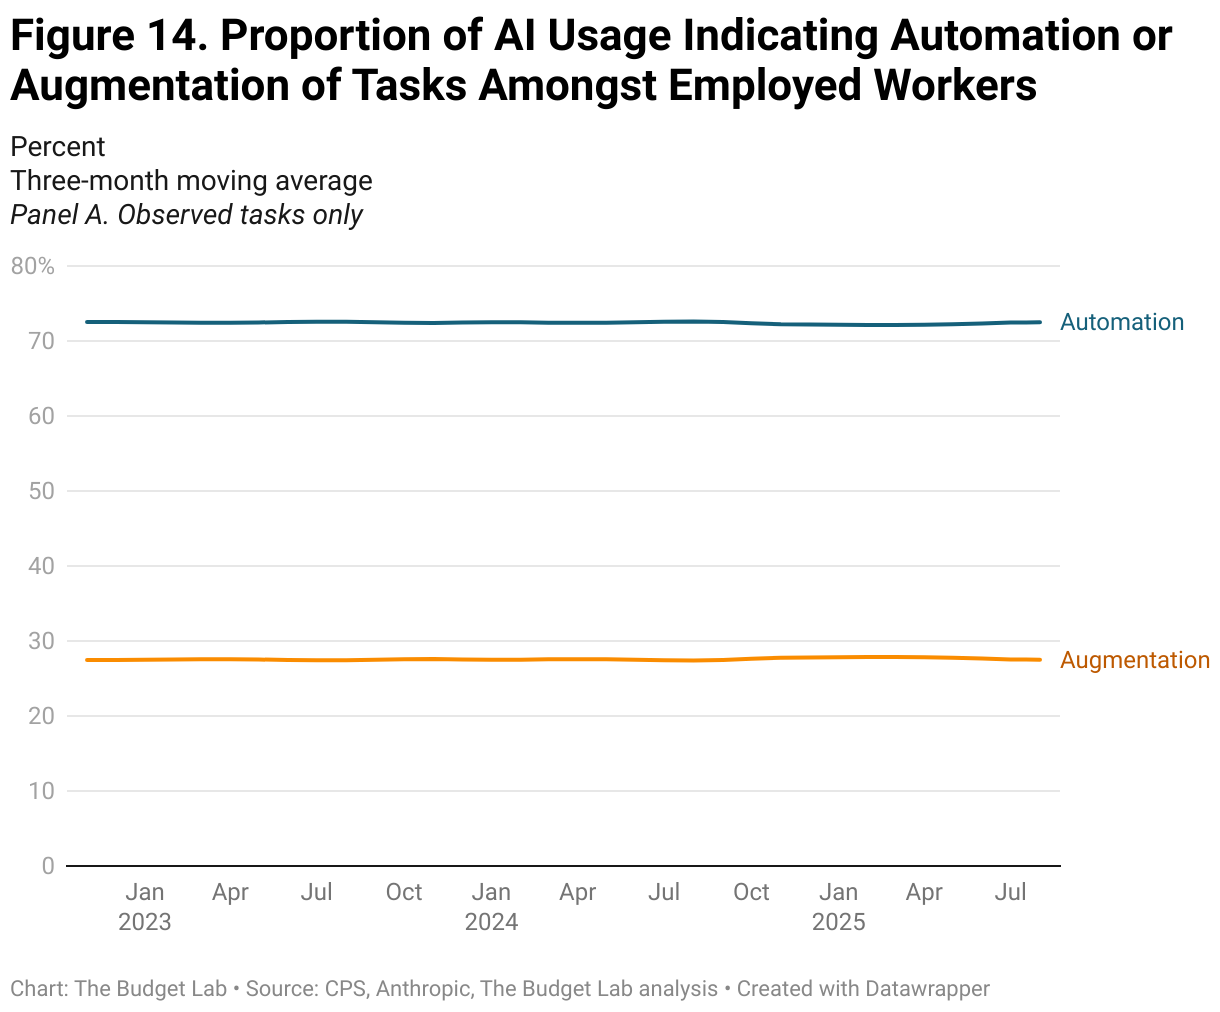
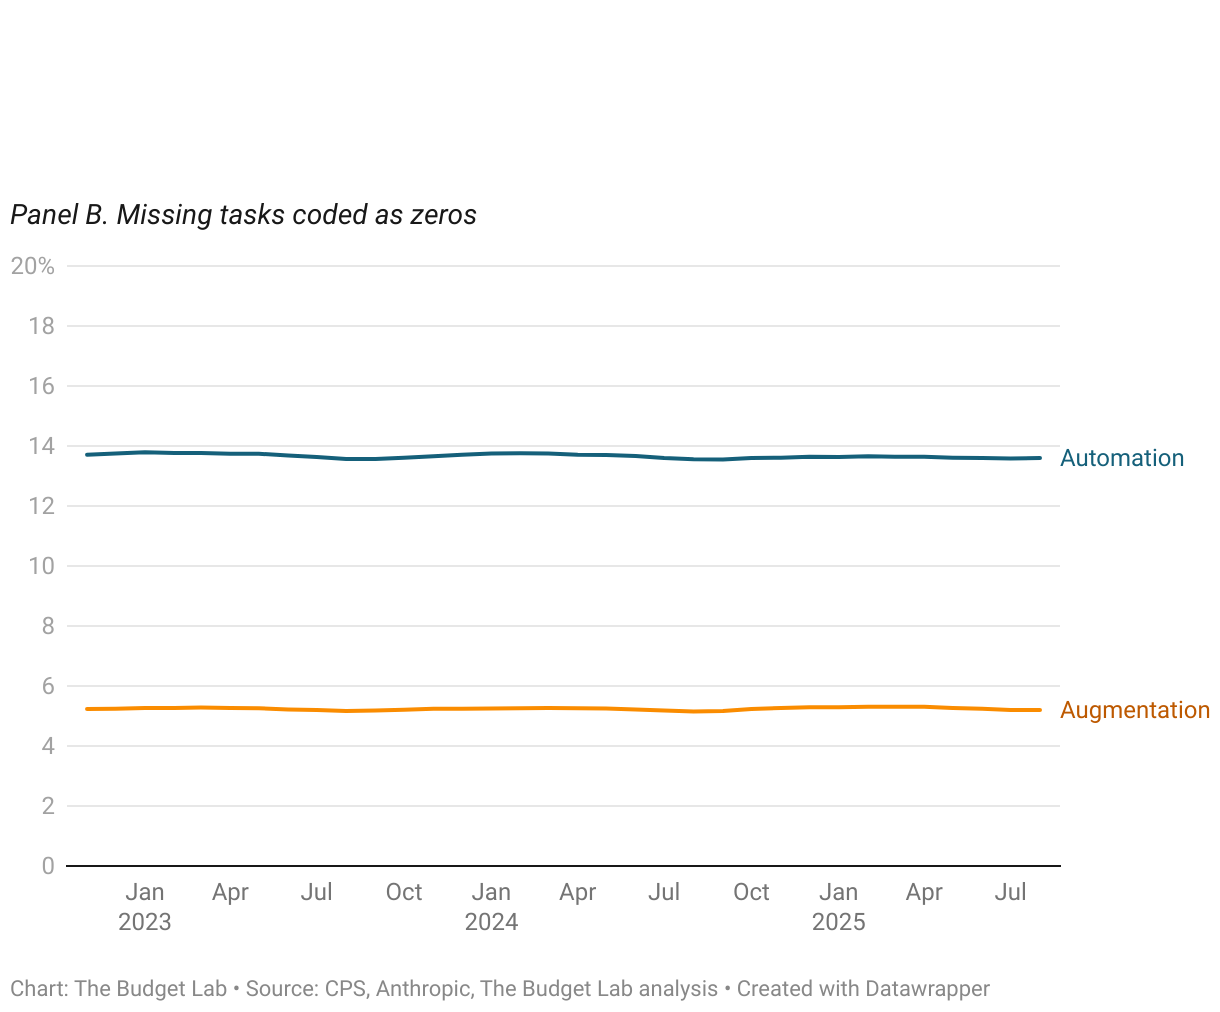
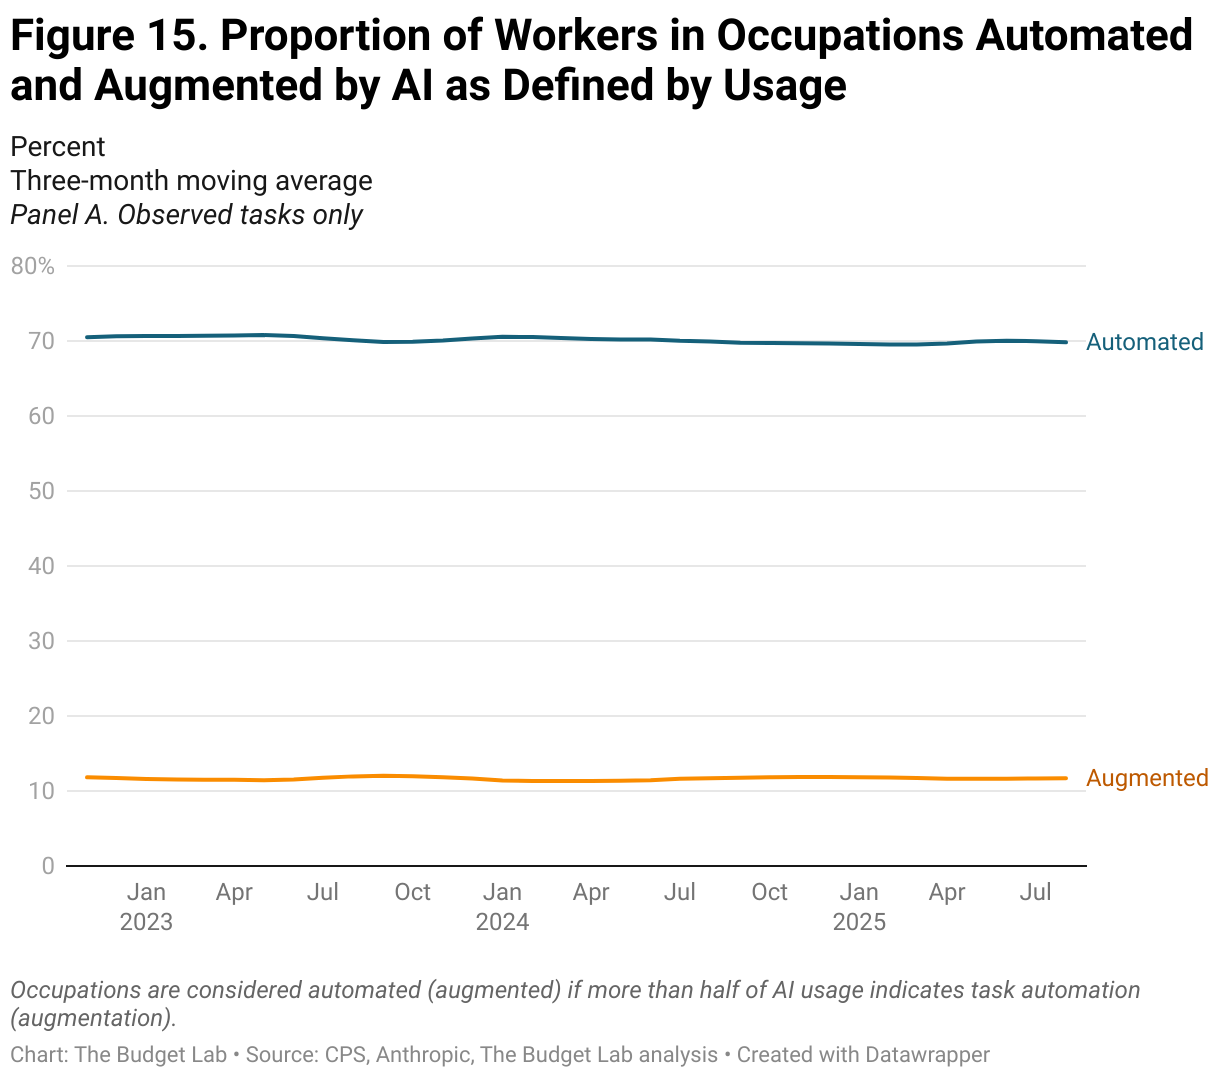
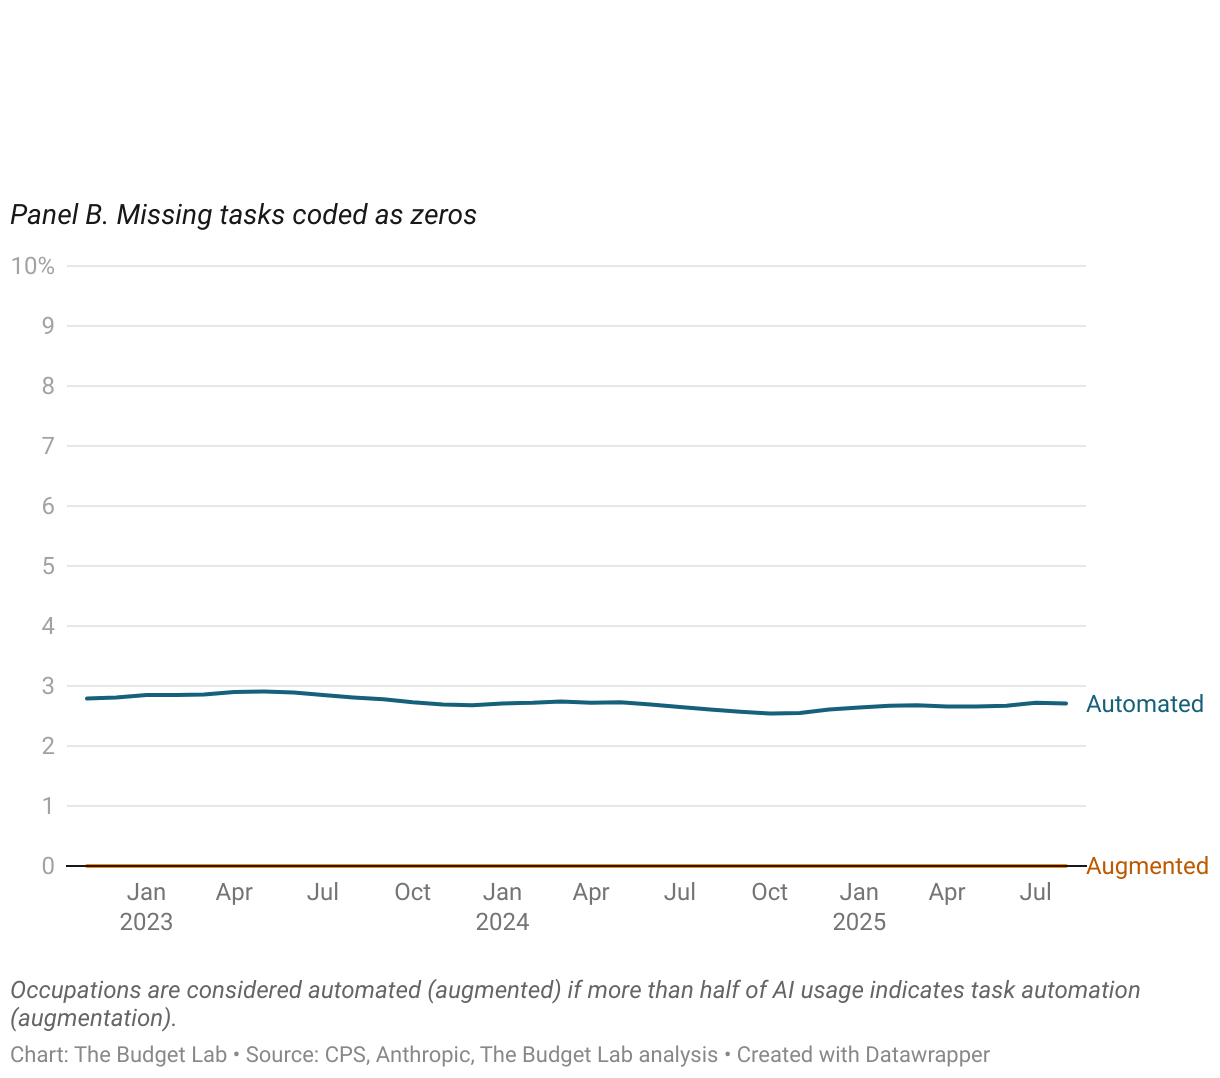
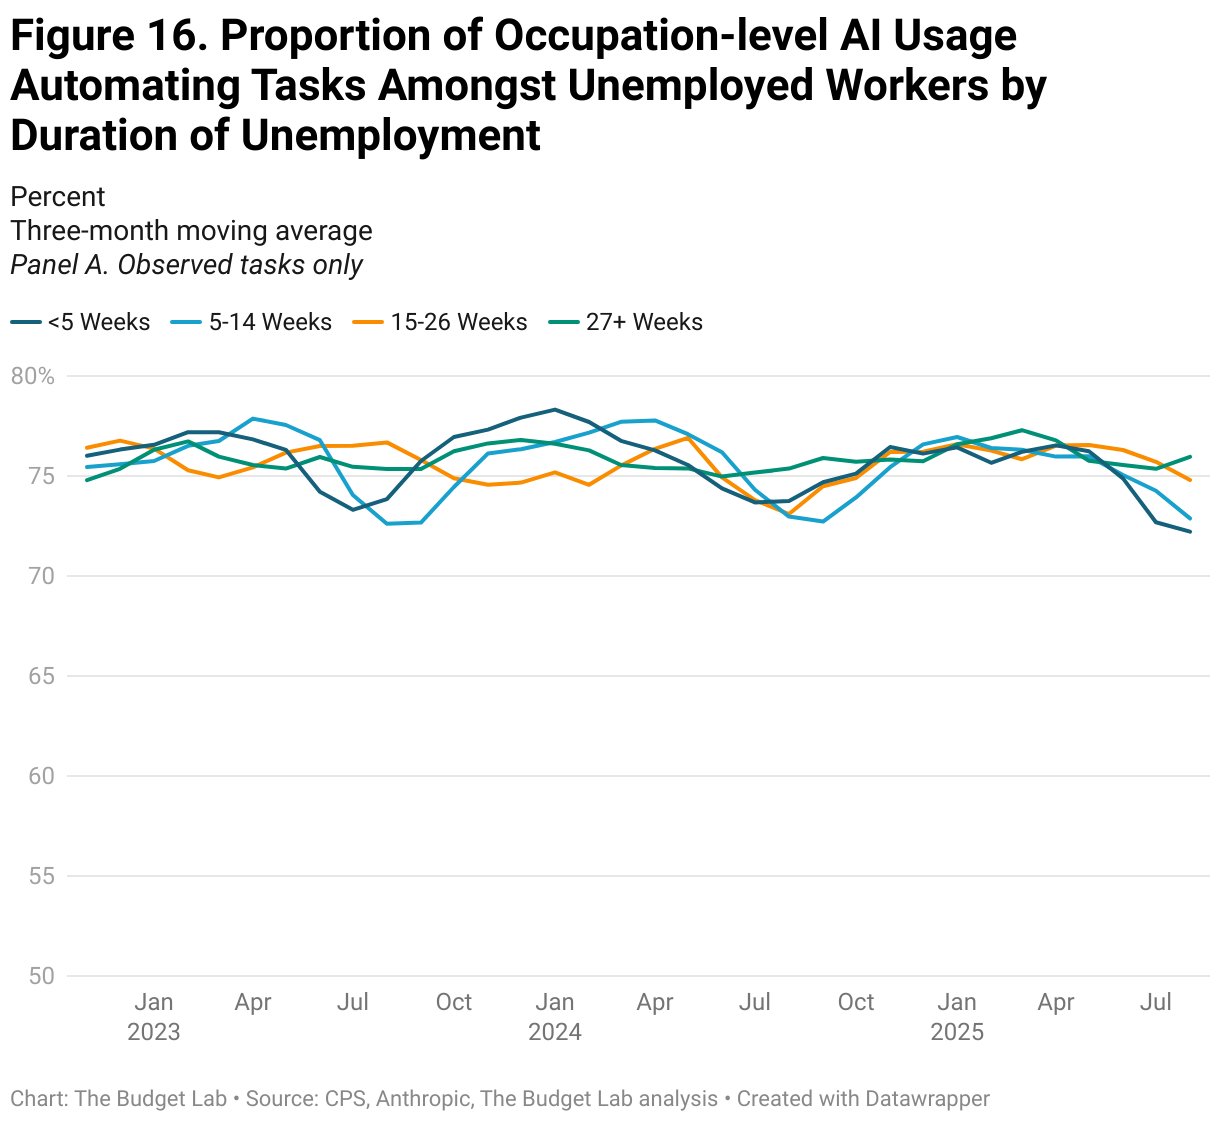
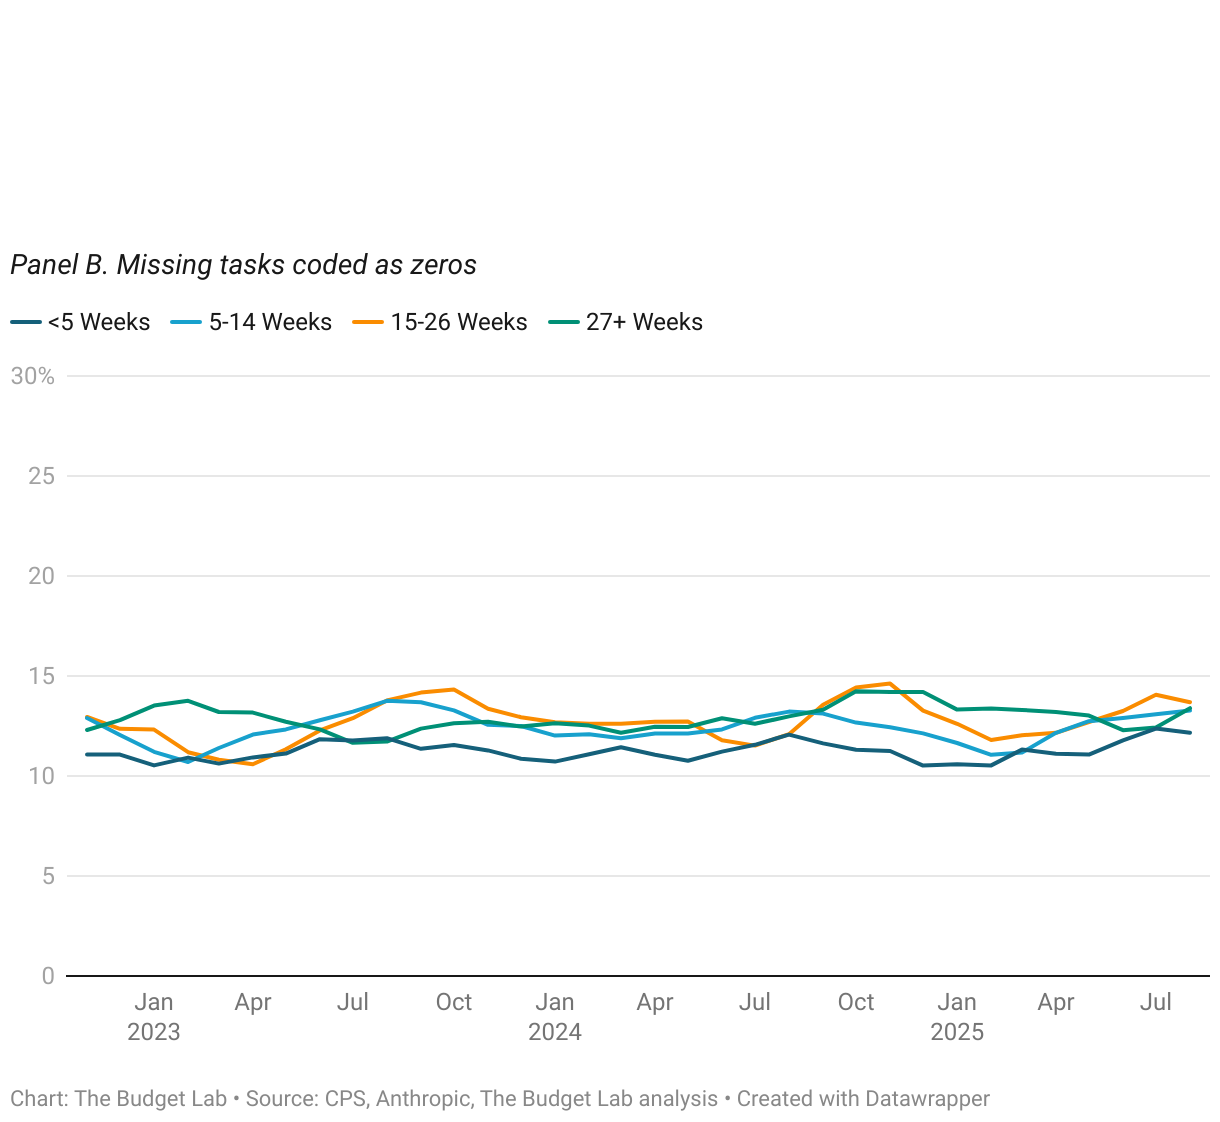
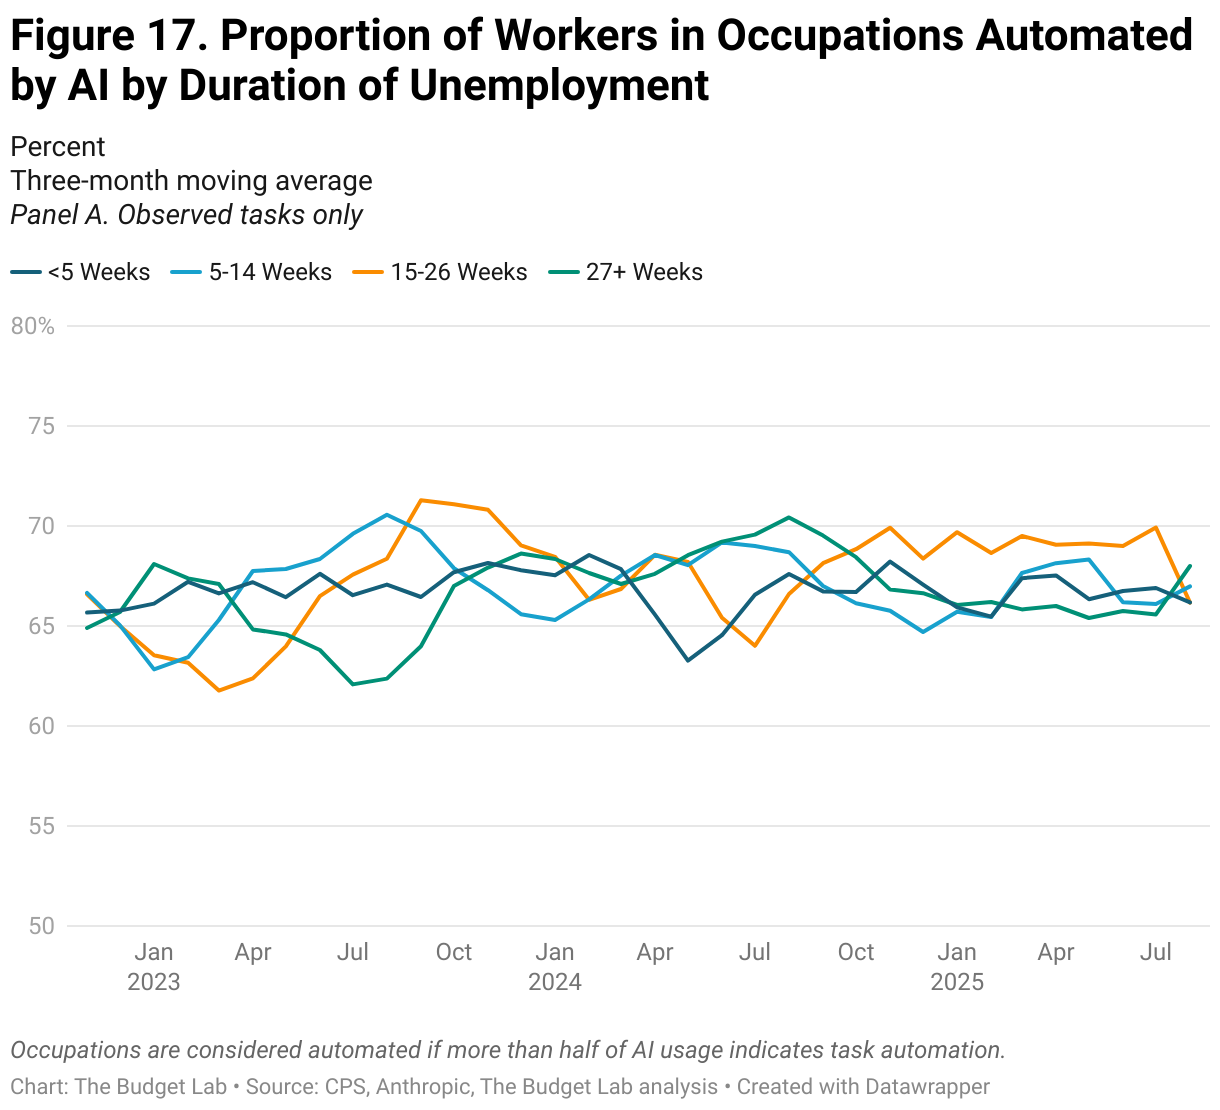
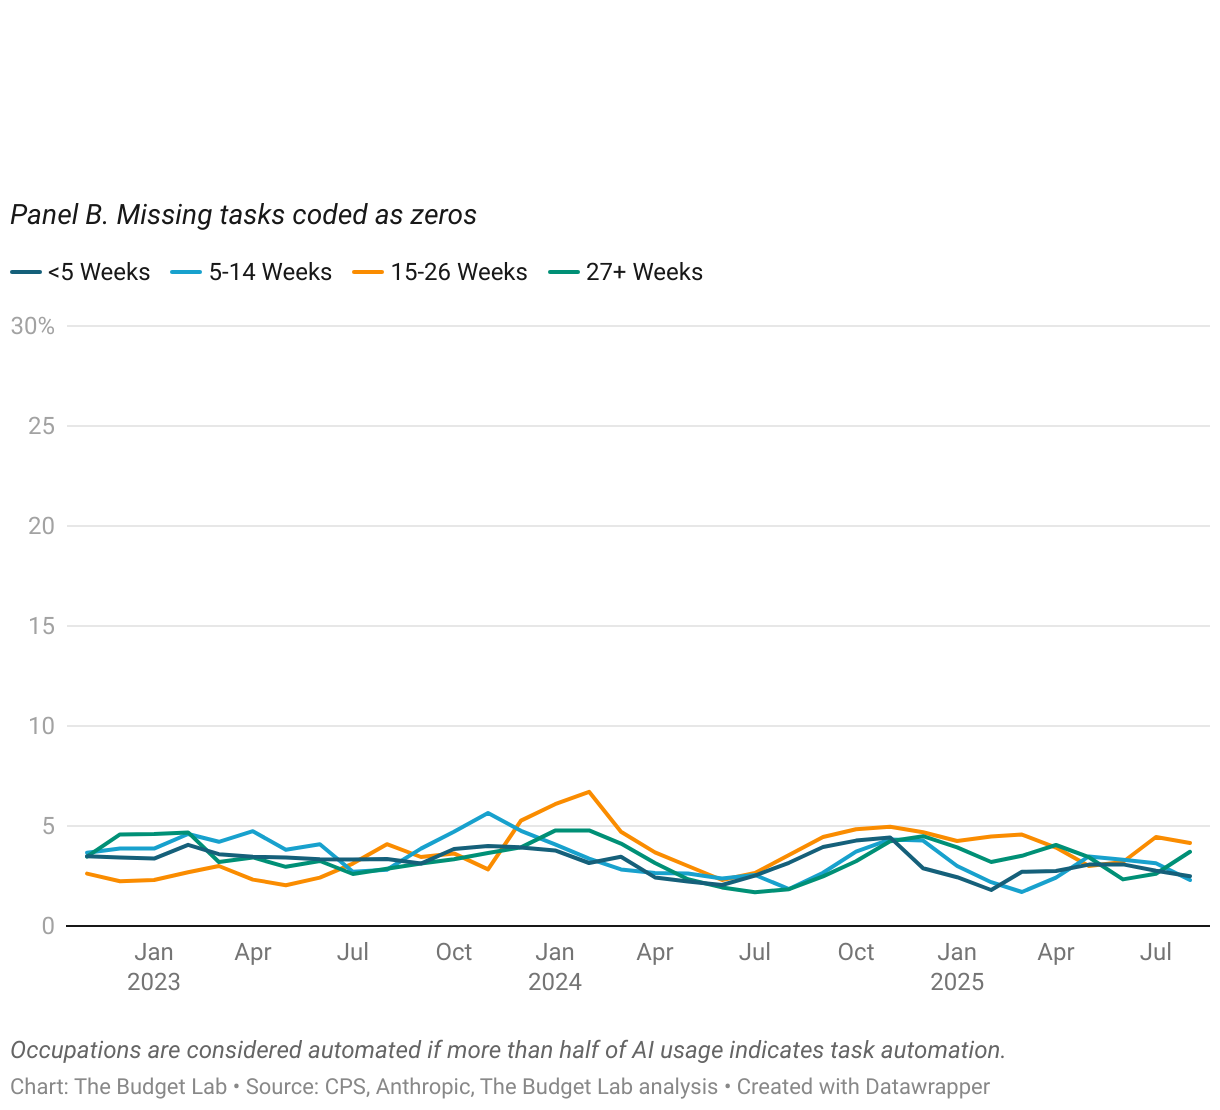
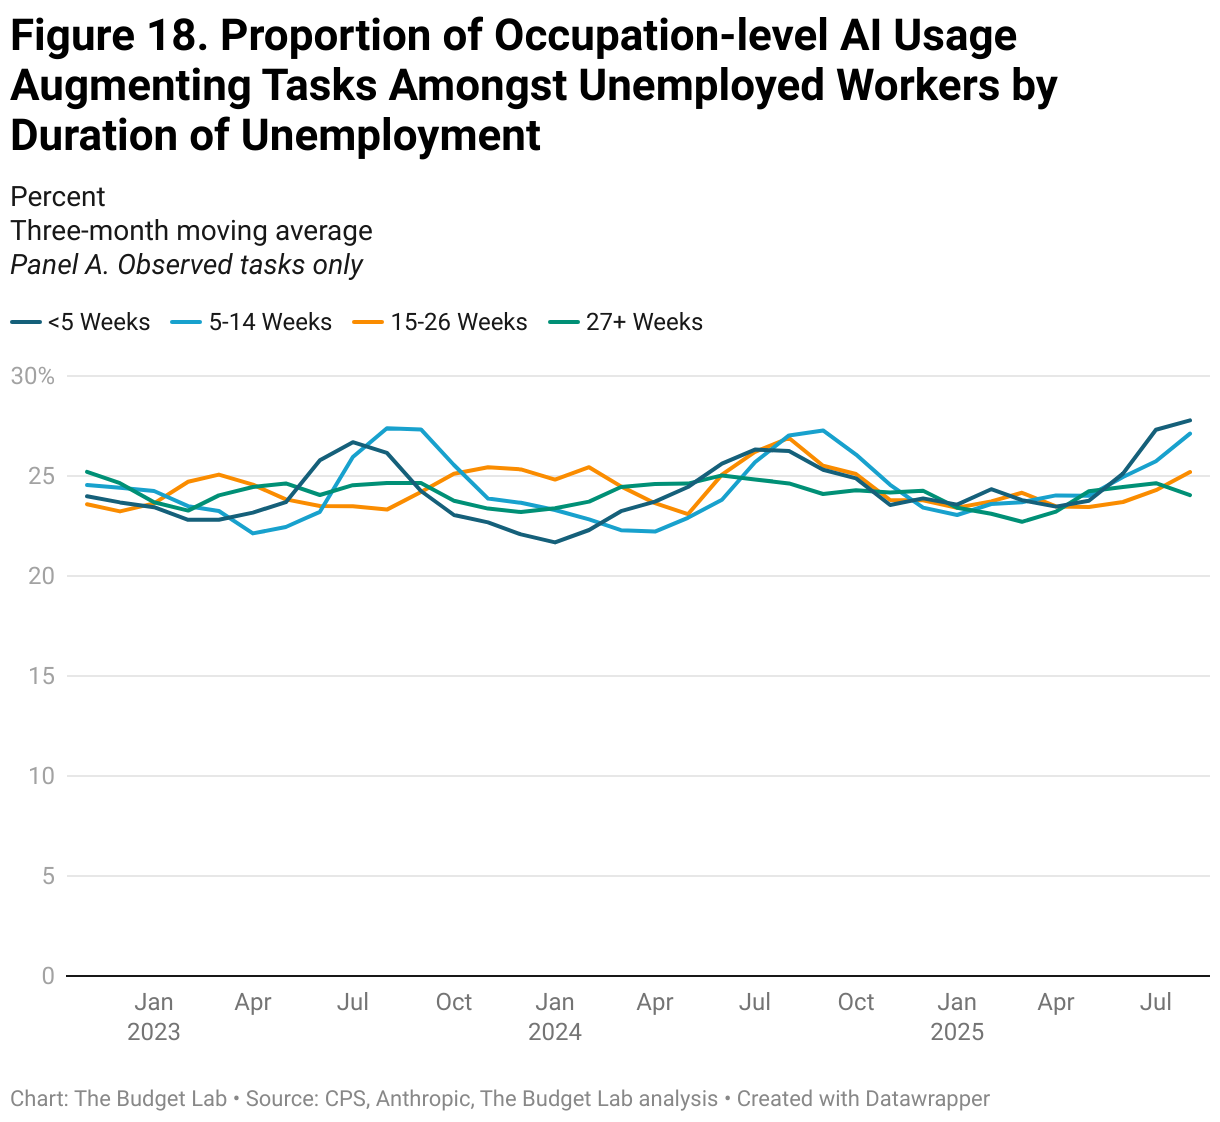
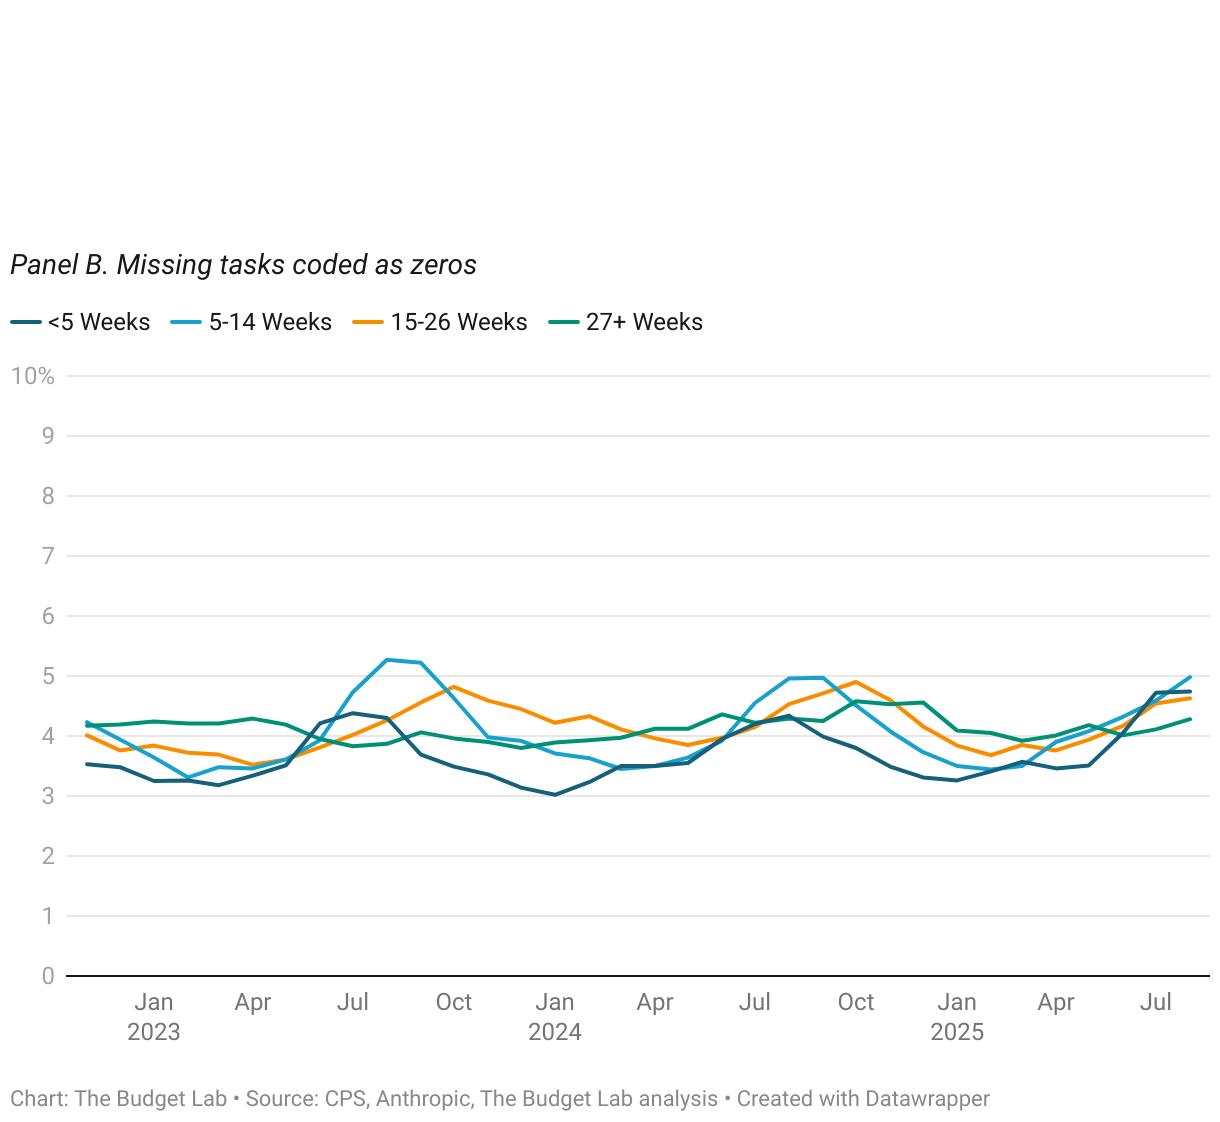
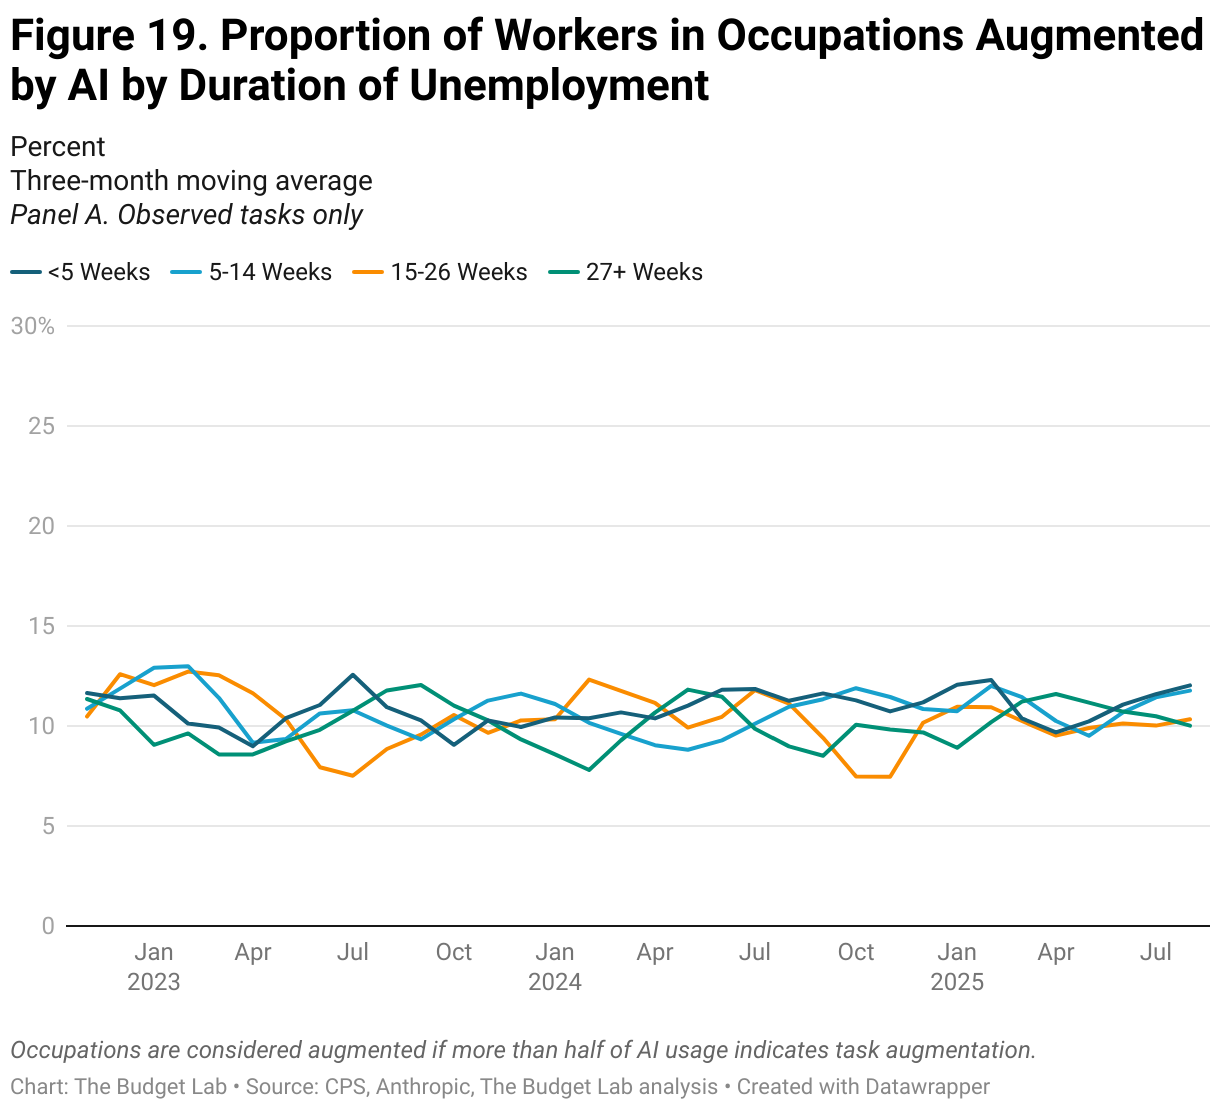
Anthropic’s data on AI usage shows similar trends of stability over time, rather than disruption. The proportion of employment in occupations with high levels of task AI usage, whether automation or augmentation (as defined as more than half of AI usage), is stable at around 70% or 11%, respectively (Figure 15). When assuming that unobserved tasks indicate zero usage, however, these proportions drop to 3% and 0%, respectively. Repeating a similar analysis as above, Figures 16 and 18 report the occupation-level share of tasks that are automation or augmentation, respectively, amongst unemployed workers by duration of unemployment. Note: for this analysis, we use Anthropic’s most recent data on AI usage, which was released in mid-September. We discuss Anthropic’s data vintages more fully in the Appendix.
Data Limitations — and Why Better Data is Needed
As previously noted, the metrics from OpenAI and Anthropic are imperfect proxies for AI risk and usage, while still being the best available.
A key limitation of OpenAI’s “exposure” data is that it is not based on actual usage, and should therefore be interpreted as a theoretical estimate of the jobs and sectors that could, in theory, be impacted. In reality, actual AI usage and workplace diffusion has varied dramatically between sectors and occupations with similar levels of “exposure.” For instance, generative AI tools were adopted extremely quickly and at mass scale among coders and software developers, who are in the top quintile of exposure. Meanwhile, adoption has lagged considerably in clerical sectors, despite a similar level of exposure. Thus analyzing occupations by exposure alone likely under-estimates potential labor market disruption, as the top quintiles of exposure will include occupations that are theoretically exposed but not actively using AI at a meaningful scale, and thus unlikely to see AI impacts.
A comparison of the OpenAI “exposure” data with the Anthropic usage data makes this limitation clear. The two measures appear to have only a limited correlation with one another (Figure 20).
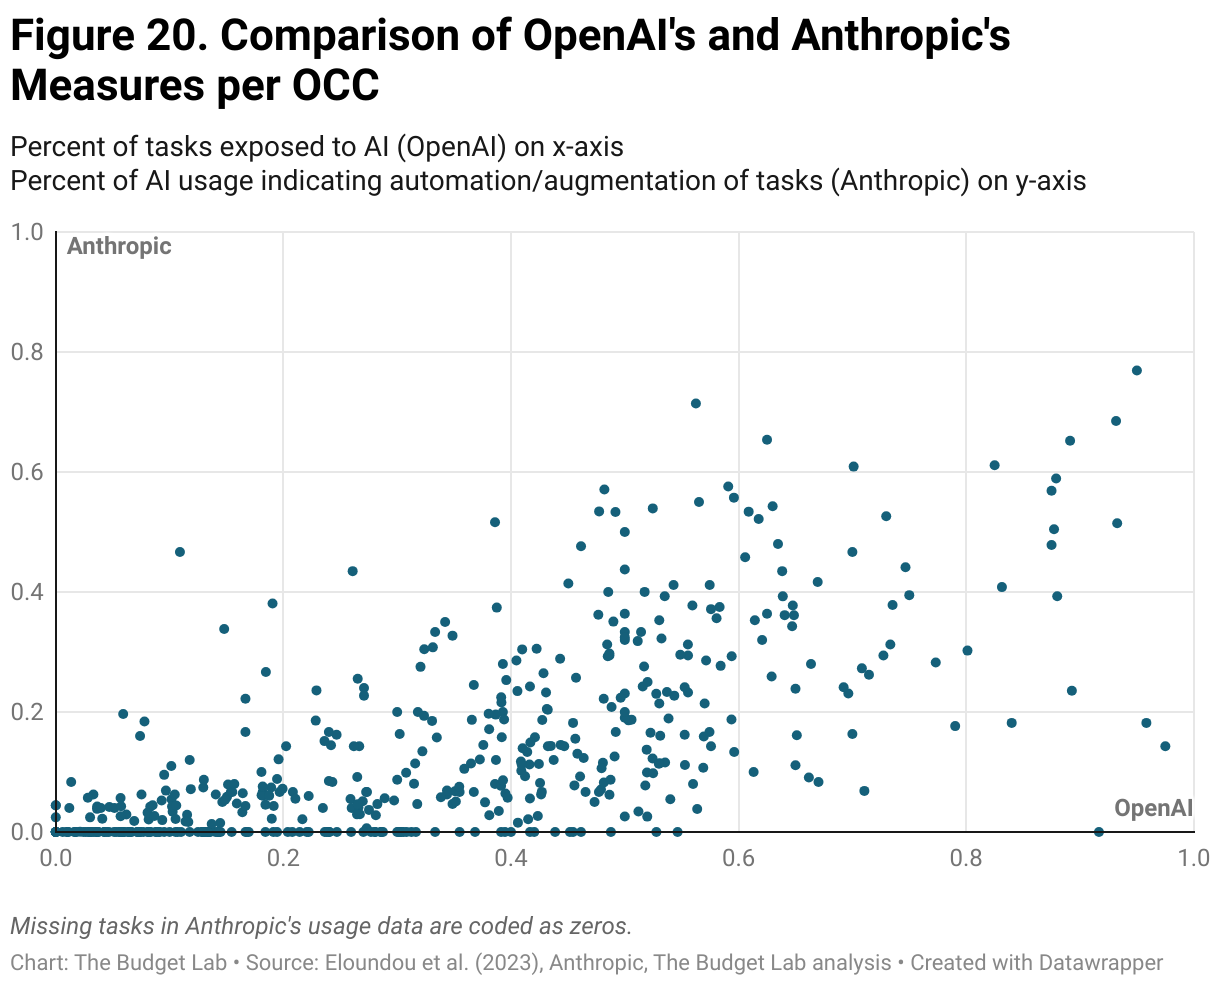
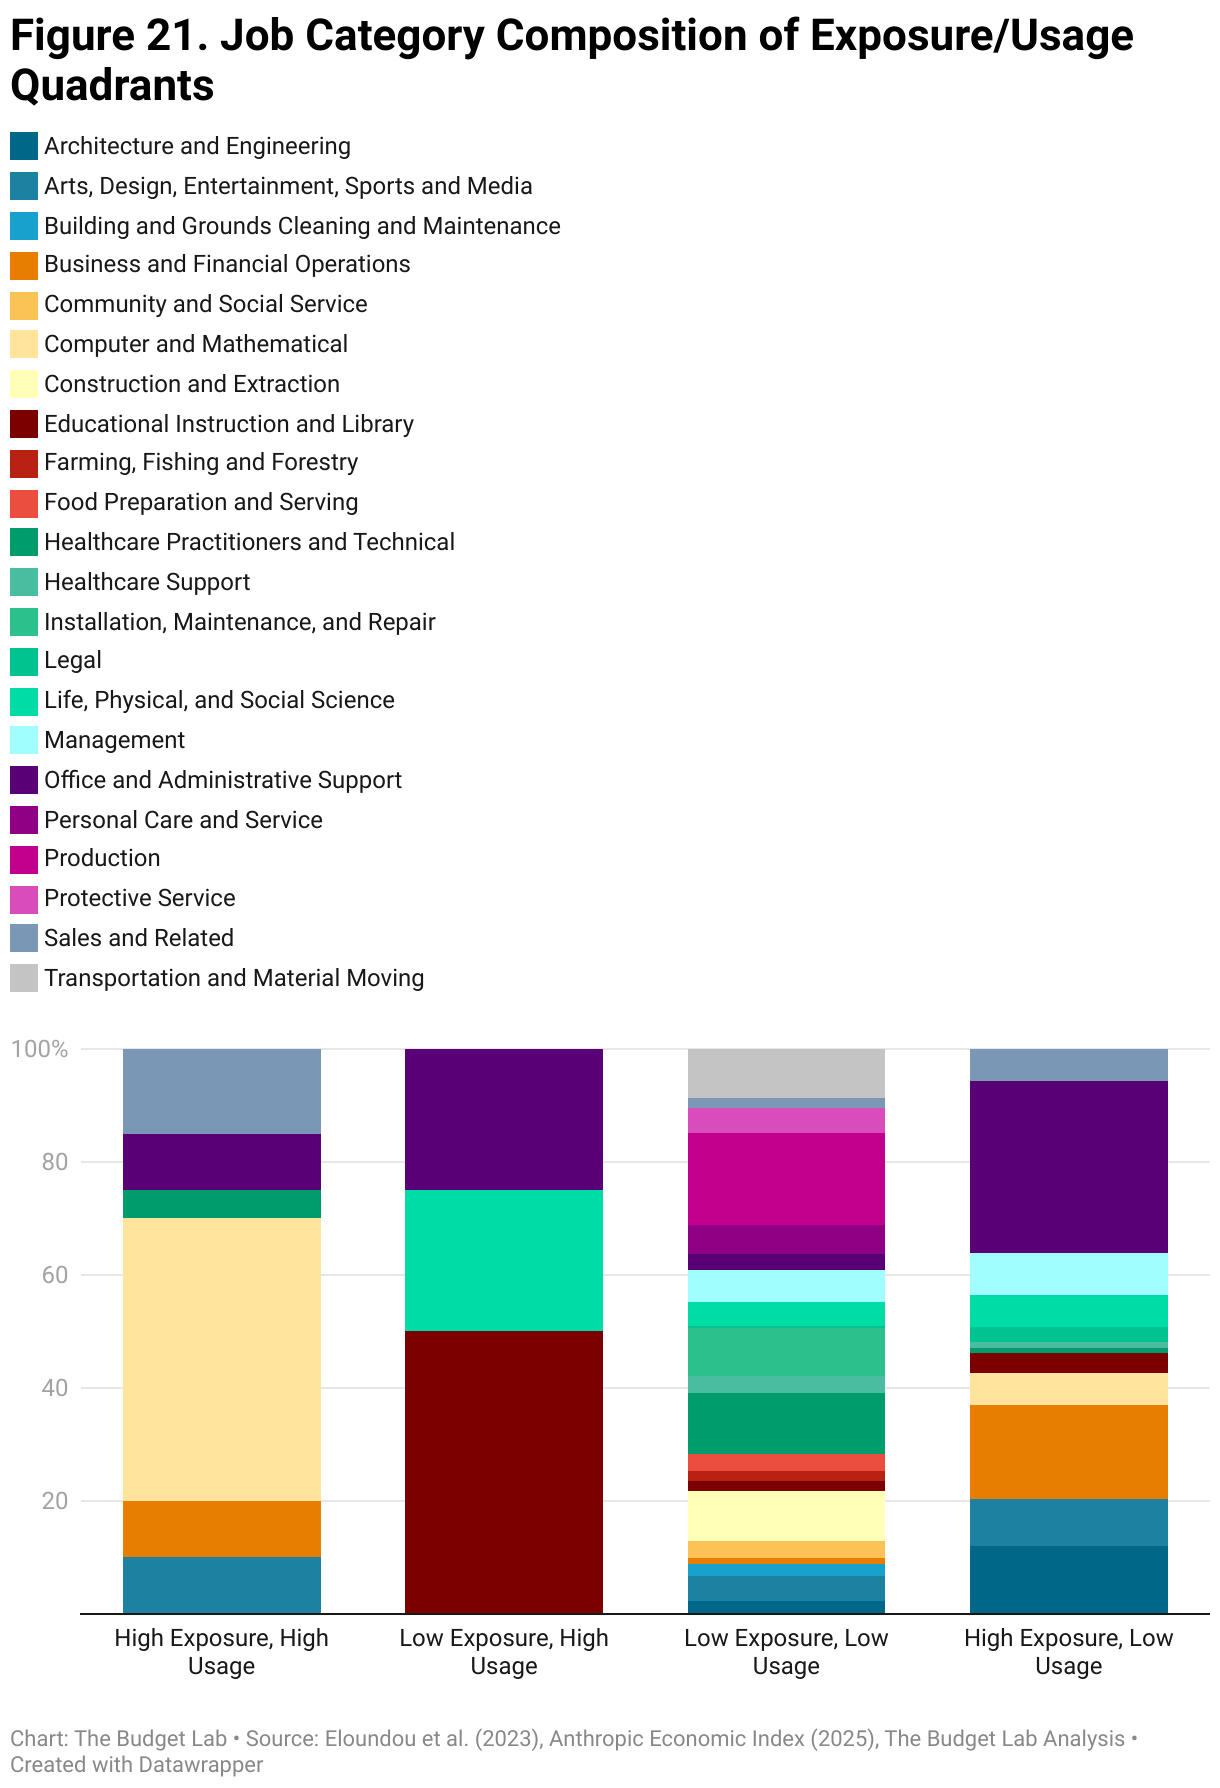
Figure 20 consists of occupations that have data for both the OpenAI and Anthropic measures, which amounts to about 80% of CPS occupations in our sample. Figure 21 splits the data from figure 20 into quadrants along the axes of low-high exposure and low-high usage and then groups the data into its SOC job categories. Particularly striking is the greater range of different job categories in the quadrants with low usage (the left side of figure 20) and conversely the concentration in just a handful of categories in the high usage quadrants. Across both high and low exposure, high usage occupations are dominated by scientific and quantitative professions and general business occupations. The occupations clustered in the low usage/exposure (bottom left of figure 20) tend to be production occupations with little computerization.
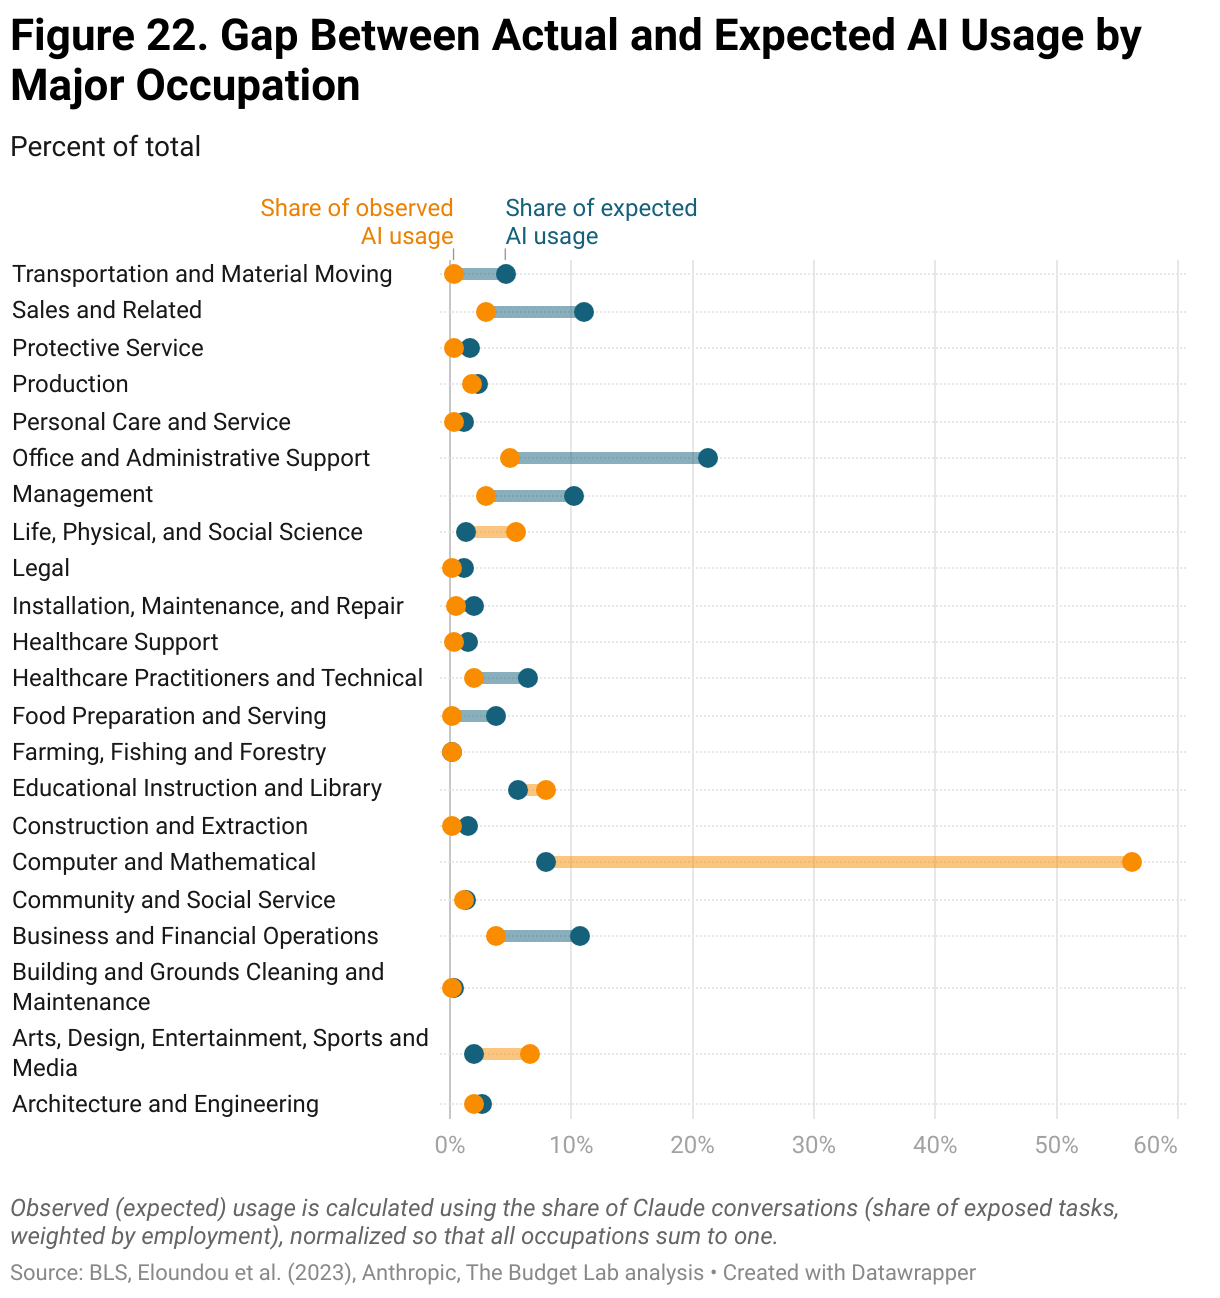
Just as the OpenAI metric has limitations, so too does Anthropic’s usage data. Figure 22 shows the occupational shares of all “conversations” with Claude (the AI chatbot), and illustrates the occupation groups that are over- and under- represented in this usage, compared to their exposure ranking and employment share.
It is clear from the data that Claude’s usage is heavily dominated by one occupational group — computer and mathematical, which includes coders — and that arts and media (including writers) is also considerably overrepresented. While certainly coding is among the most prominent use cases of AI, it is likely that Claude’s userbase skews more heavily to these tasks due to Claude’s stand-out reputation among LLMs as being particularly good at writing and coding. New data recently published by OpenAI shows a broad pattern of usage among ChatGPT customers across a range of industries, including not only information services (including software development) but also professional services and even manufacturing. It is entirely possible, and even likely, that usage data from other AI models like Google’s Gemini or Microsoft’s Copilot would show different and more varied patterns of usage. Thus data from Claude usage alone is not representative of how workers across the economy are using AI chatbots and tools.
To accurately measure AI’s impact on the labor force, the most important data needed is comprehensive usage data from all the leading AI companies at the individual and enterprise level, including APIs. Anthropic has led the way in transparently sharing Claude usage data, including a new release of enterprise data. To further our understanding of AI’s impact, it is important that all leading AI labs do the same in a similarly transparent and privacy-protected way.
Summary
While anxiety over the effects of AI on today’s labor market is widespread, our data suggests it remains largely speculative. The picture of AI’s impact on the labor market that emerges from our data is one that largely reflects stability, not major disruption at an economy-wide level. While generative AI looks likely to join the ranks of transformative, general purpose technologies, it is too soon to tell how disruptive the technology will be to jobs. The lack of widespread impacts at this early stage is not unlike the pace of change with previous periods of technological disruption. Preregistering areas where we would expect to see the impact and continuing to monitor monthly impacts will help us distinguish rumor from fact.
Appendix
Code used to create the data can be found here.
We adapt Duncan and Duncan’s methodology to construct a dissimilarity index of the change in the occupational mix over time using monthly CPS data. Going month by month, we measure each occupation’s constituent percentage of the workforce and compare it to the starting month. To address noise in the data, we take a 12 month moving average for each month. We then sum up the absolute differences in percentage of workforce across all occupations to get our dissimilarity index for that given month. This captures both the advent of new occupations and the expansion or contraction of existing ones.
To examine generative AI’s impact, we begin in November 2022 and continue into the latest monthly CPS release in July, as this lines up with AI’s public introduction and the beginning of its adoption. We compare AI’s dissimilarity index to three other time periods:
- 1984-1989: Capturing the popularization of PCs and the start of the computer revolution.
- 1996-2002: Capturing mass adoption of the internet in public life and the workplace.
- 2016-2019: A control period following the 2008 Recession recovery during which there was little change to the occupational mix.
Figure A1 adds pre-trends in the occupational mix for the prior 12 months to the data from Figure 1. In all but one period, the pre-trends show a similar degree of dissimilarity as compared to the trend observed over the first year. This lack of a substantial difference suggests the advent of new technologies has minimal immediate effects; i.e., shifts in the labor market take time to develop. Note that the large pre-trends in the “Computers” period are likely due to issues with the quality of data prior to 1981.
Using OpenAI’s occupational exposure data, we classify occupations as mildly, moderately, or highly exposed to AI provided that generative AI can reduce the time to complete at least one task (or a greater portion of tasks given the exposure level) by 50%. The raw occupational exposure data allocates tasks into one of three categories:
- No exposure: Generative AI cannot reduce the time to complete the task or lowers the quality of the output.
- Direct exposure: Generative AI can reduce the time to complete a task by at least 50%.
- LLM+ Exposed: Generative AI alone cannot reduce task completion time, but a piece of software built on top of a model could.
We utilize the GPT4 categorized “Beta” exposure, which gives a task a score of 1 if it is directly exposed, or a score of .5 if it is LLM+ Exposed. An occupation’s exposure is the weighted average of the exposure of each individual task.
Following the methods in OpenAI’s paper presenting these results, when aggregating exposure to the occupational level, a job’s “core” tasks have a weight of 1 while their “supplemental” tasks have a weight of .5. After exposure and usage are aggregated to the SOC code level, they are weighted by that occupation’s OES labor count. This weight is used when aggregating from SOC code to CPS code.
Given the exposure data was created a few years and thus does not include the more advanced capabilities of today’s large language models, a relative comparison of exposure appears more appropriate. Rather than measuring the now aged direct exposure, we broke GPT4 Beta exposure (after our aggregation and weighting) into quintiles and bucketed them as described in the text above. The average exposure, rounded to the second digit, for each quintile is as follows:
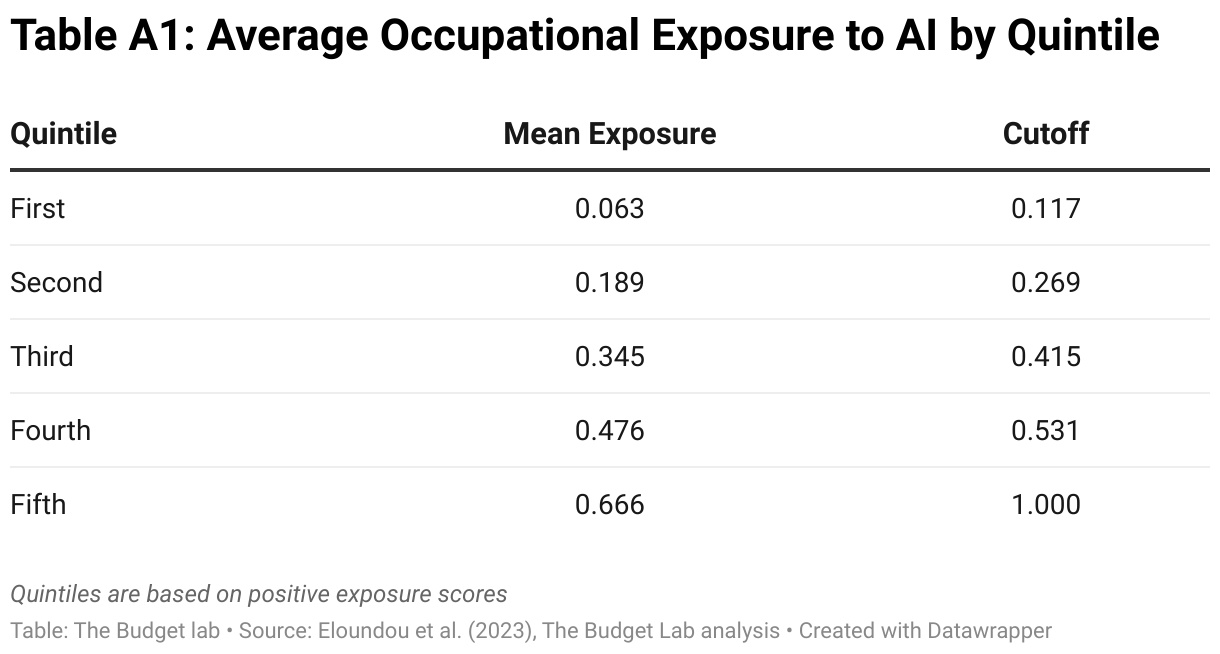
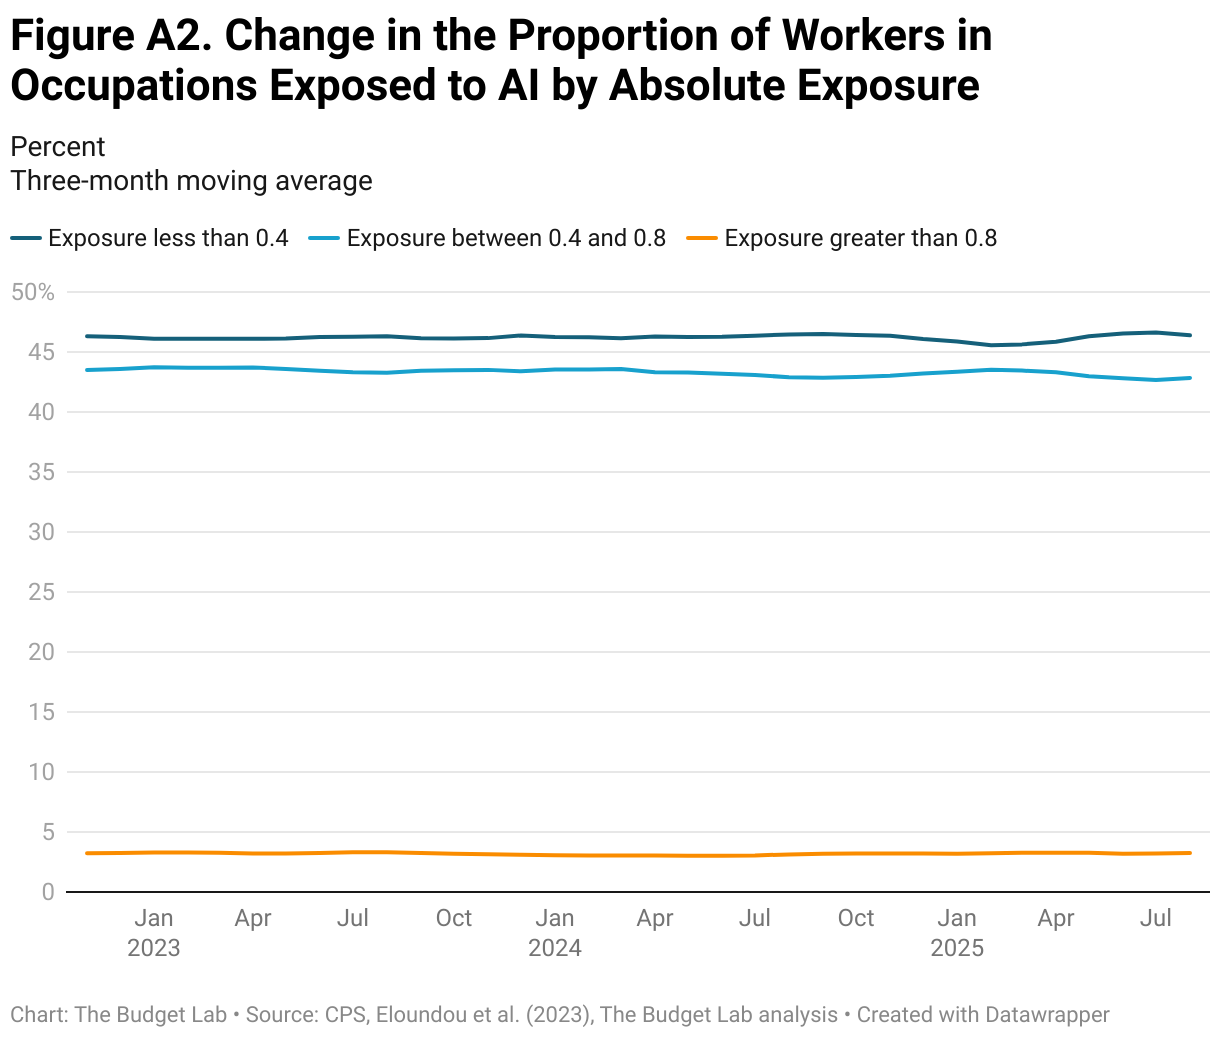
Figure A2 replicates the prior analysis in Figure 12 with occupation-level exposure groups instead defined using the absolute measure of exposure. The lowest and medium exposure groups (scores less than 0.4 and between 0.4 and 0.8, respectively) stably comprise around 45% of workers each, while the highest exposure group represents only around 2% of workers (scores greater than 0.8). Like in Figure 12, there is no observable trend over time.
Anthropic’s usage metrics are aggregated similarly to the OpenAI exposure data. We follow the method their researchers use here. We aggregate the individual kinds of usage into their respective categories for each task:
- Augmentation = Validation + Task Iteration + Learning
- Automation = Directive + Feedback Loop.
We then weight the tasks using the same core/supplemental weighting method described above. Following that, the aggregation to CPS code level is identical to the OpenAI aggregation.
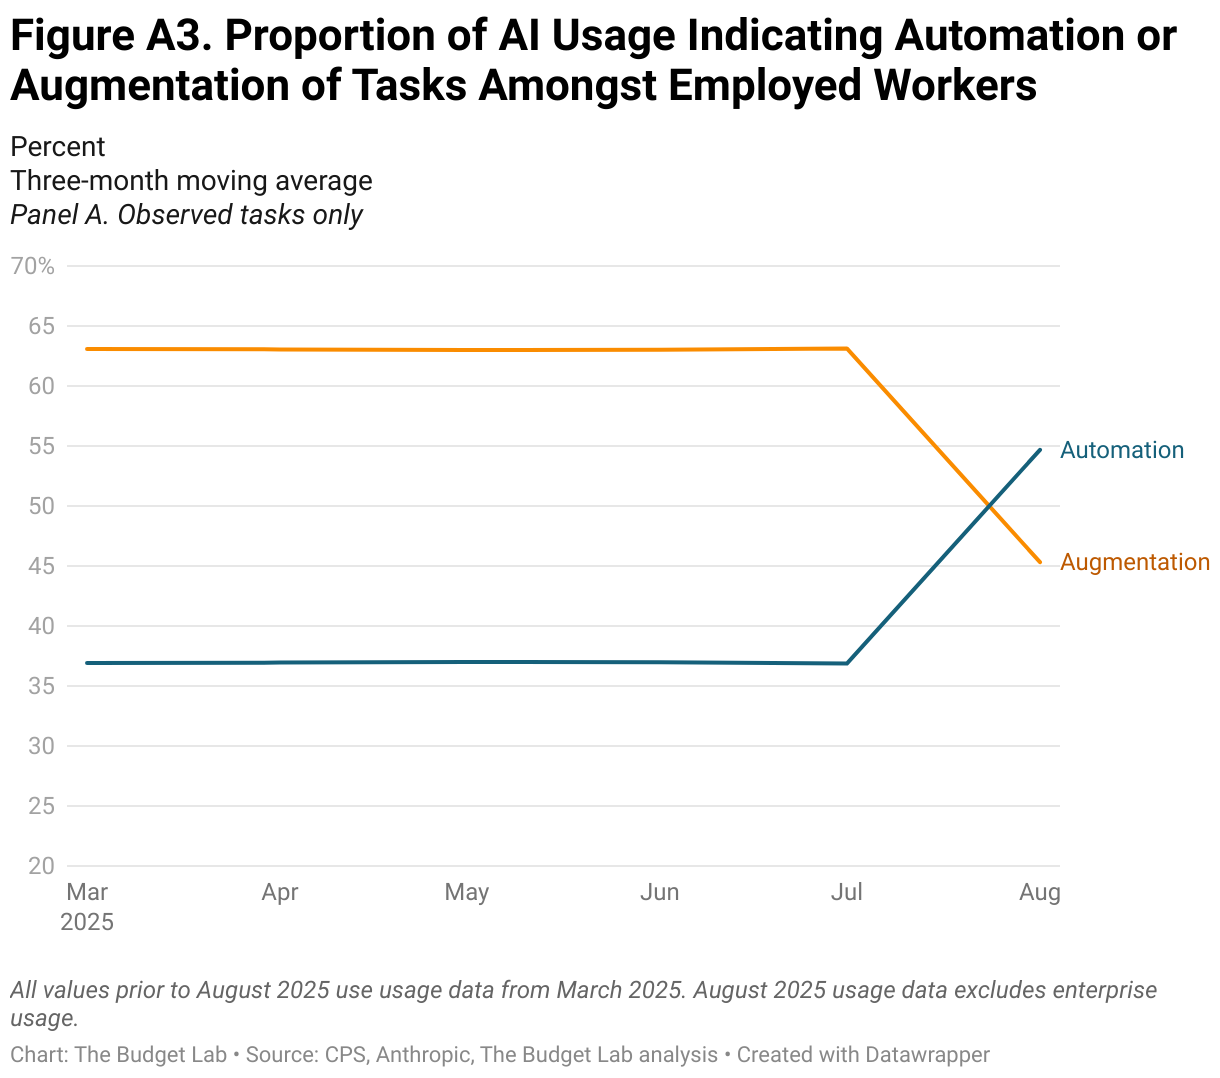
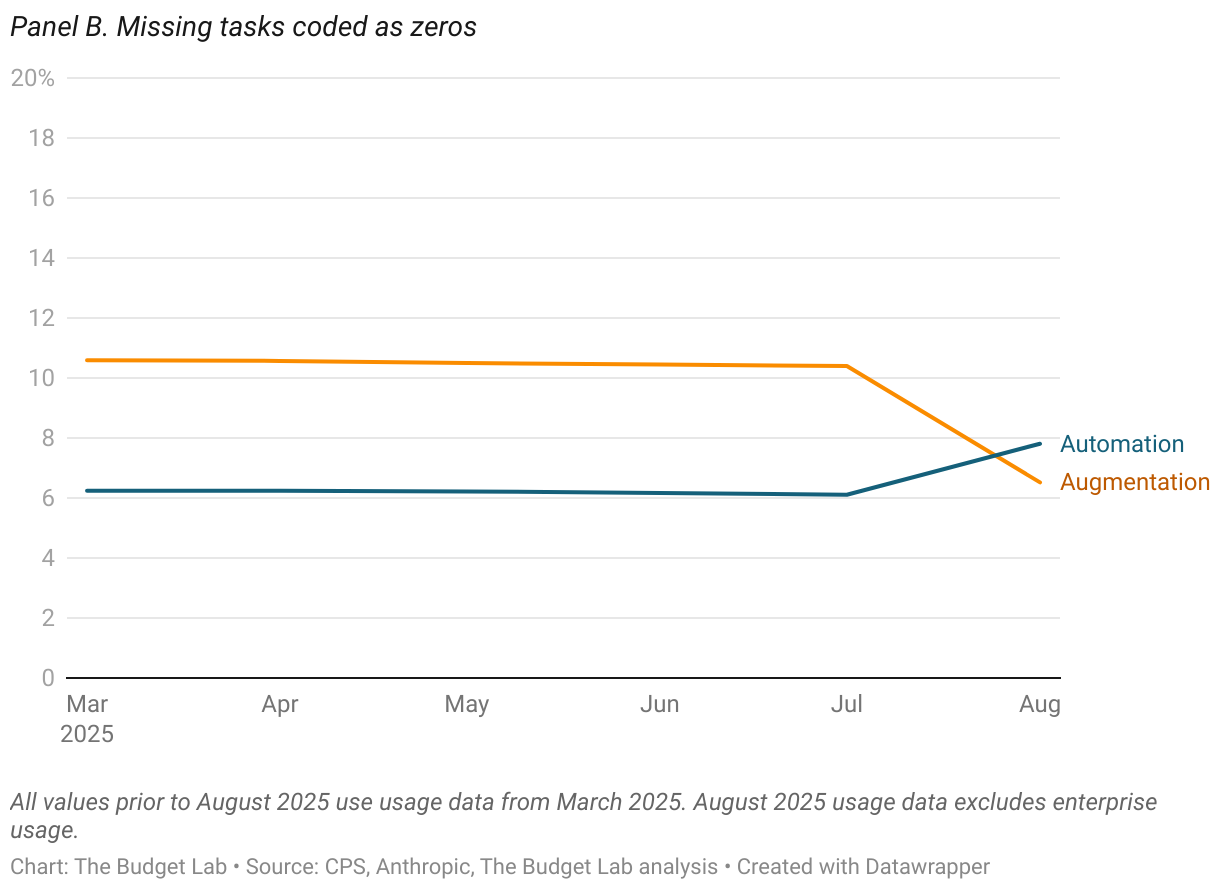
Throughout this piece we use Anthropic’s AI usage data from their most recent release in August. This data, however, only provides a static snapshot of AI usage. As more data is made available in future releases, the Budget Lab will continue to update this analysis to provide a more comprehensive picture of how changes in AI usage may be affecting the labor market. Figure A3 shows the trend in the automation/augmentation of tasks using data from a prior March release until August 2025 (note that to ensure consistency between the two releases, the August usage data excludes enterprise usage).
Footnotes
- Much of the press focuses on early career and white collar workers being in lower demand.
- In any given year, recent and older college graduates account for around 1,100 and 5,600 observations (3% and 12% of the overall sample), respectively.