
Introducing the Tariff Rate Tracker: An Open-Source Tool for Daily Effective Tariff Rates
Key Takeaways
-
Over the last year, tariff policy has changed dozens of times, making tracking the statutory rate – either overall or for a specific product – very difficult.
-
In early April, TBL released an open-source tool that uses public government data to create daily product-by-country tariff rates, starting with January 1, 2025.
-
The tool allows you to estimate tariff rates by country, type of commodity, and specific tariff authority.
-
It also allows for the simulation of different policies, including new sets of tariffs, or alternative assumptions regarding the implementation of tariff rules.
Since the announcement of tariffs on countries across the world in early 2025, U.S. tariff rates have been revised more than forty times. One month ago, the Budget Lab released the Tariff Rate Tracker, a fully open-source tool that computes daily effective tariff rates from official USITC Harmonized Tariff Schedule (HTS) data. The code, the data pipeline, and every modeling assumption are available on GitHub. We will be maintaining this resource, incorporating new HTS revisions and other changes to tariff laws as they emerge. We are updating this blog to reflect new numbers and methodological changes over the last month, and to correct minor issues with the estimation of baseline pre-2025 tariff rates.
Daily Rates from Raw HTS Data

The ETR started the year at under 3 percent and reached over 22 percent after Liberation Day one year ago, before falling again, driven by a roller coaster of announced policy changes, trade deals, and legal challenges to the 2025 tariff regime. As each of these changes is incorporated into the HTS (or other similar legal documents), we update the tracker accordingly, including the projection of future rates according to current law.
Decomposition by Authority
The tracker decomposes the ETR for each product into contributions from each tariff authority, applying the stacking rules that govern how these authorities interact. Figure 2 shows these contributions over time.

Users can decompose rates at any level — overall, by country, by product, or by product-country pair — and the tool handles the complex interactions automatically. For example, Section 232 do not stack on the metal content of products, while fentanyl surcharges stacked at full value. These rules are specified in YAML configuration files that are editable so users can specify different rules and rule interactions.
By Country and by Sector
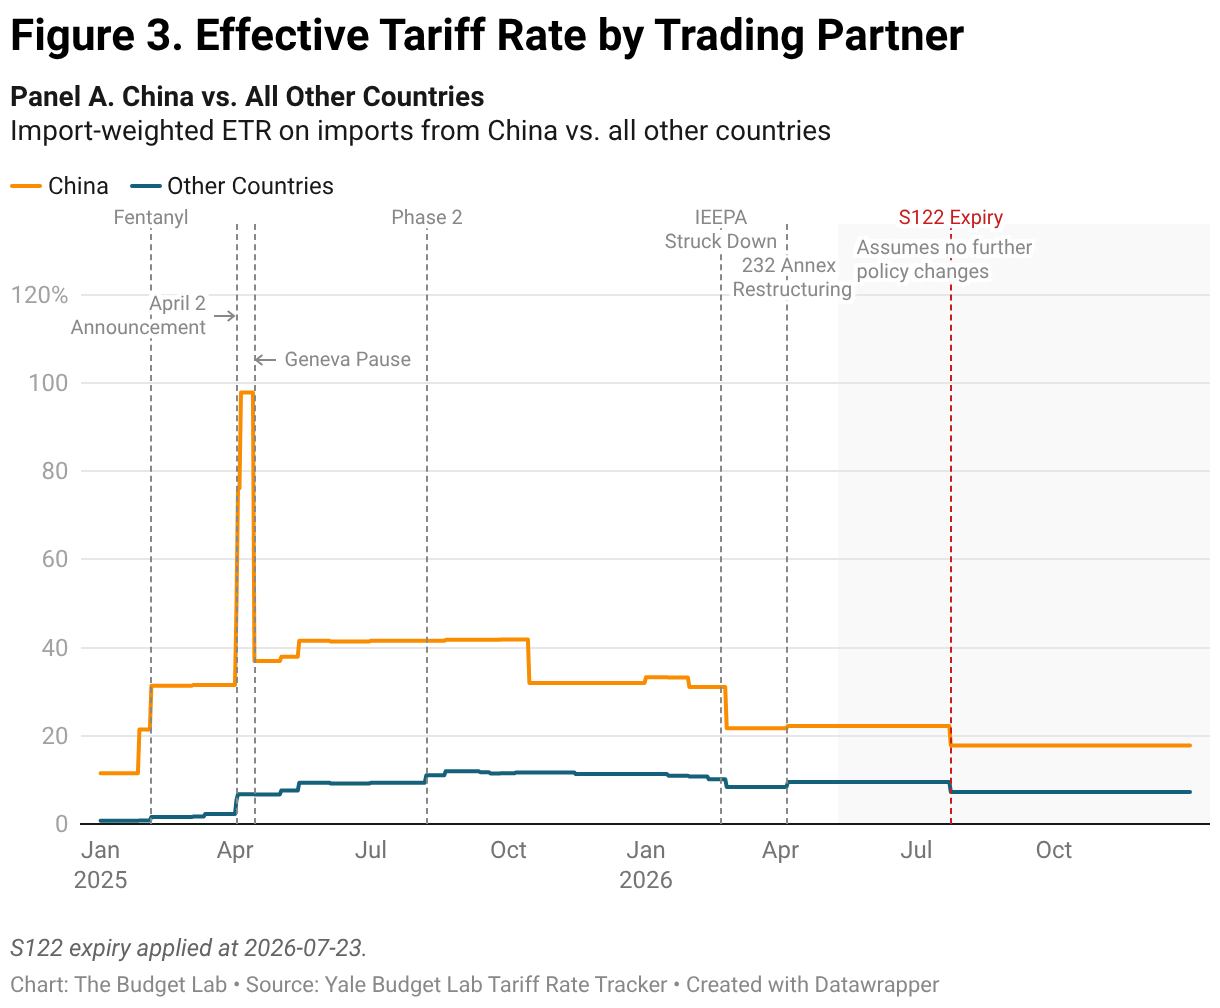
The tools capabilities are evident when looking at ETRs by country and by sector, as we do below. We can see that China has the highest ETR of any country, due to layered Section 301, IEEPA (now expired), Section 122, and Section 232 duties, and that most other countries face significantly lower average tariff rates.

We can also show how tariffs vary across different sectors by aggregating the underlying data, as shown below in Figure 4. The product-level variation in tariff rates stems both from country-specific tariffs that happen to fall especially hard on a specific sector, and product-specific tariffs (or exemptions from tariffs) that have emerged over the last year. Capturing these rates also requires correctly evaluating complexities that emerge at the individual-product level. For example, we track a product’s metal content for Section 232 tariffs using BEA input-output tables.

Transparent and Configurable
Building an ETR series requires modeling choices where the statute is ambiguous or data is incomplete. This project is set up so that users can modify, test, and alter these assumptions: for example, you can swap stacking rules, metal content methods, USMCA assumptions, or zero out any authority via configuration.
Get Started
The Tariff Rate Tracker is available now, and we welcome comments, questions, and suggestions! Our goal with this tracker is to provide an up-to-date, consistent, and transparent source of information on the complex world of tariff rates, and we recognize that such an effort will be the result of collaboration with the community of researchers, policymakers, and others who are engaged with this effort. We would like to thank the researchers at the Tax Policy Center for sharing snapshots of their data to help us evaluate early versions of this project.
Methodology
The tracker uses HTS data, combined with other government sources and assumptions about economic behavior and legal rules, to assign daily tariff effective tariff rates (ETRs) to almost 20,000 HS10 products across 240 trading partners. These rates capture the statutory tariff rate in effect on a given day — meaning the rate that is legally applied to imports, as opposed to tariffs that have been announced but remain unimplemented. The ETR here explicitly excludes changes in real economic behavior in response to these tariffs, hence why we use 2024 trade weights in the construction of the daily ETR plot below. However, we include certain forms of legal response that more accurately reflect the true rates paid on a given commodity. For example, we update our estimate of the utilization of United States-Mexico-Canada Agreement (USMCA) exemptions to account for rapid uptake following the new tariff regime. We can combine these rates, weighted by 2024 Census import values, to get the average ETR by day. Figure 1 plots the daily series from January 2025 through the scheduled Section 122 expiry in July 2026 and beyond.