
State of U.S. Tariffs: June 17, 2025
Key Takeaways
-
The Budget Lab (TBL) estimated the effects all US tariffs and foreign retaliation implemented in 2025 through June 16, including the effects of broader scope for the 50% steel & aluminum tariffs. TBL analyzed the June 16 tariff rates as if they stayed in effect in perpetuity.
-
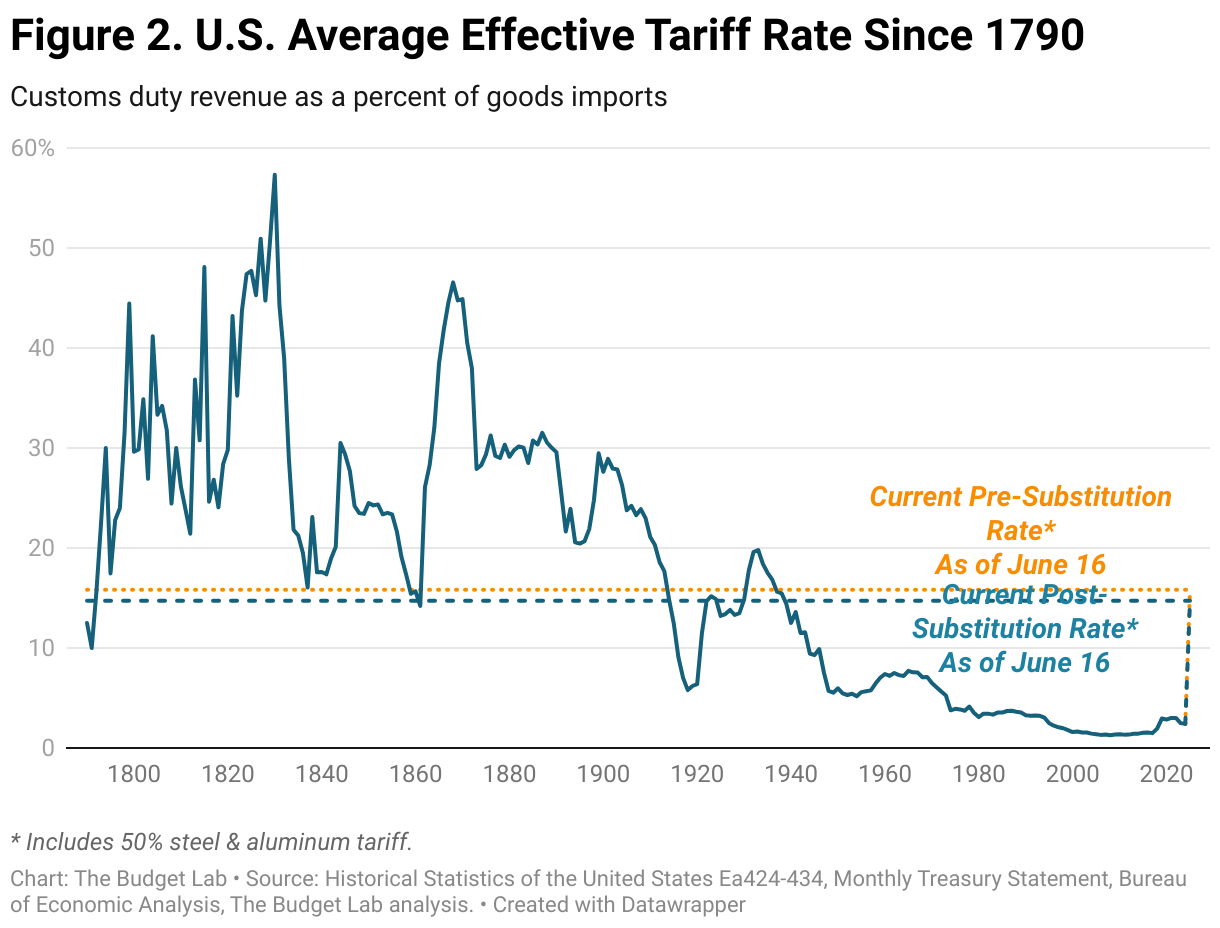
Current Tariff Rate: Consumers face an overall average effective tariff rate of 15.8%, the highest since 1936. After consumption shifts, the average tariff rate will be 14.7%, the highest since 1938.
-
Overall Price Level & Distributional Effects: The price level from all 2025 tariffs rises by 1.5% in the short-run, the equivalent of an average per household income loss of $2,000 in 2025$. Annual pre-substitution losses for households at the bottom of the income distribution are $1,100. The post-substitution price increase settles at 1.3%, a $1,700 loss per household.
-
Commodity Prices: The 2025 tariffs disproportionately affect clothing and textiles, with consumers facing 33% higher shoe prices and 28% higher apparel prices in the short-run. Shoes and apparel prices stay 18% and 15% higher in the long-run respectively.
-
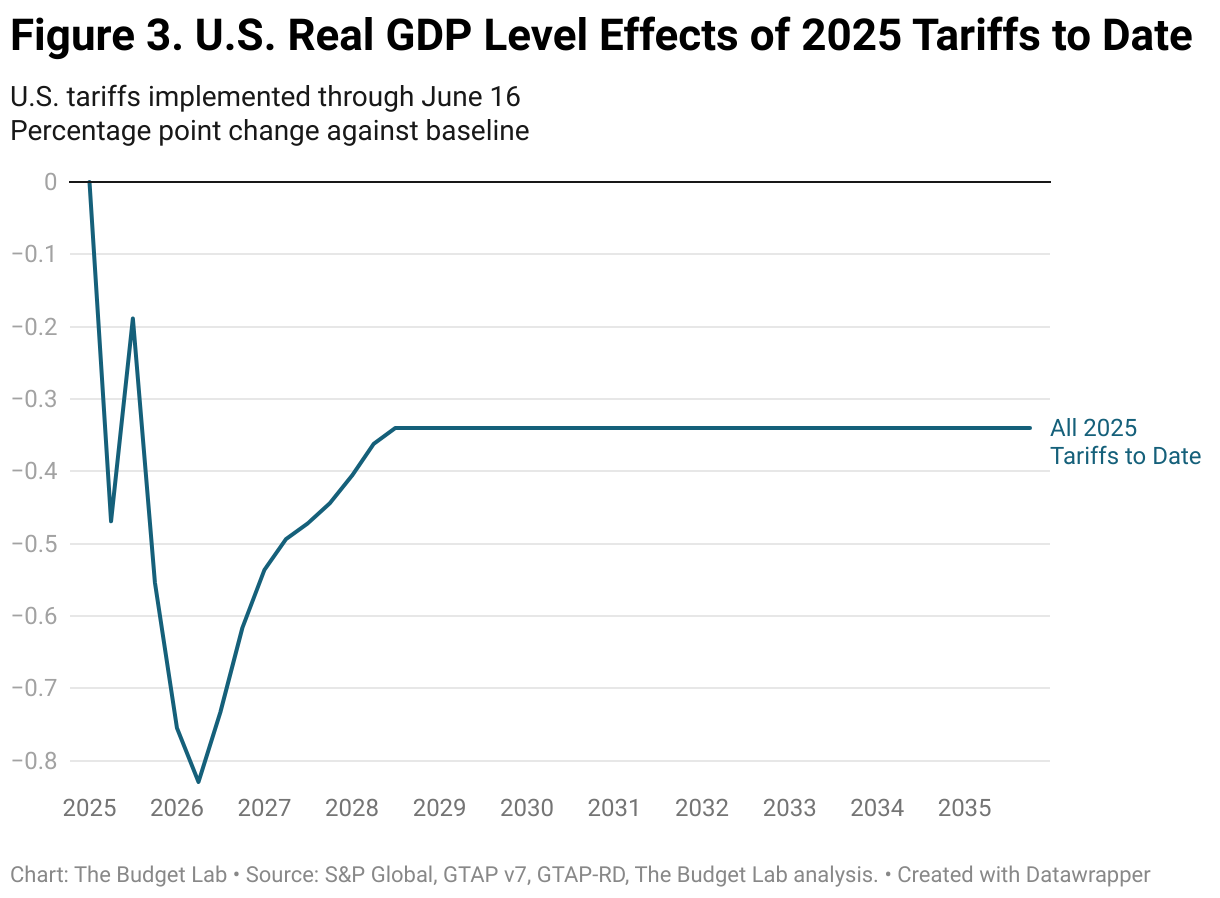
Real GDP Effects: US real GDP growth over 2025 is -0.6pp lower from all 2025 tariffs. In the long-run, the US economy is persistently -0.3% smaller, the equivalent of $100 billion annually in 2024$.
-
Labor Market Effects: The unemployment rate rises 0.3 percentage point by the end of 2025, and payroll employment is 394,000 lower.
-
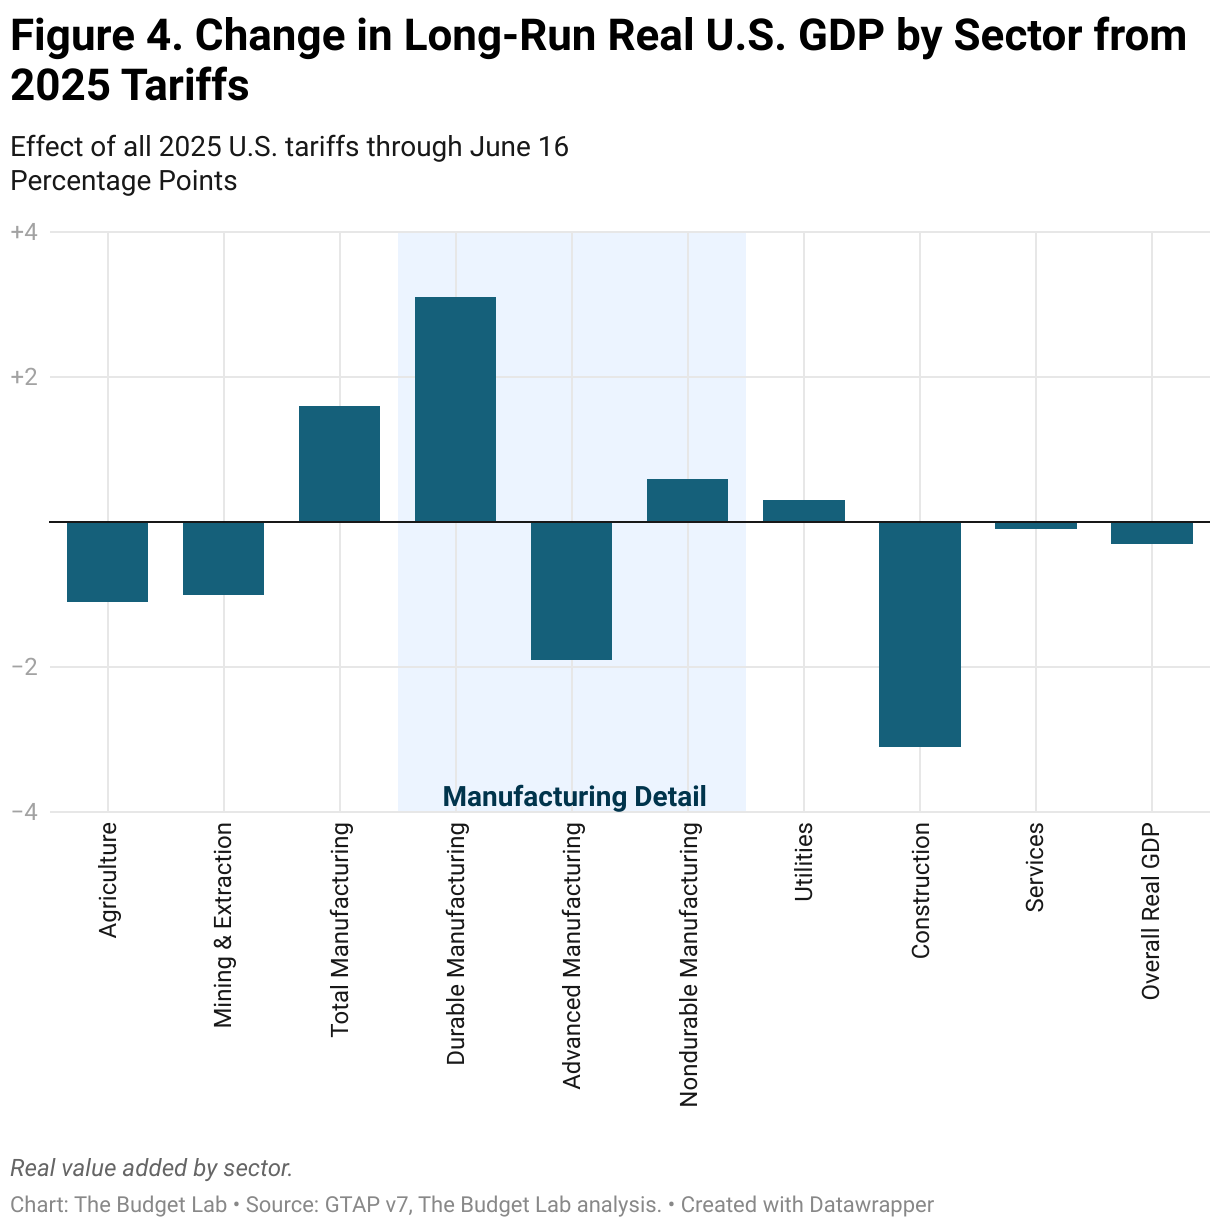
Long-Run Sectoral GDP & Employment Effects: In the long-run, tariffs present a trade-off. US manufacturing output expands by 1.6% but more than crowds out other sectors: construction output contracts by 3.1% and agriculture declines by 1.1%.
-
Fiscal Effects: All tariffs to date in 2025 raise $2.3 trillion over 2026-35, with $360 billion in negative dynamic revenue effects, bringing dynamic revenues to $2.0 trillion.
Changes Since the Last Report
Since the June 1 report:
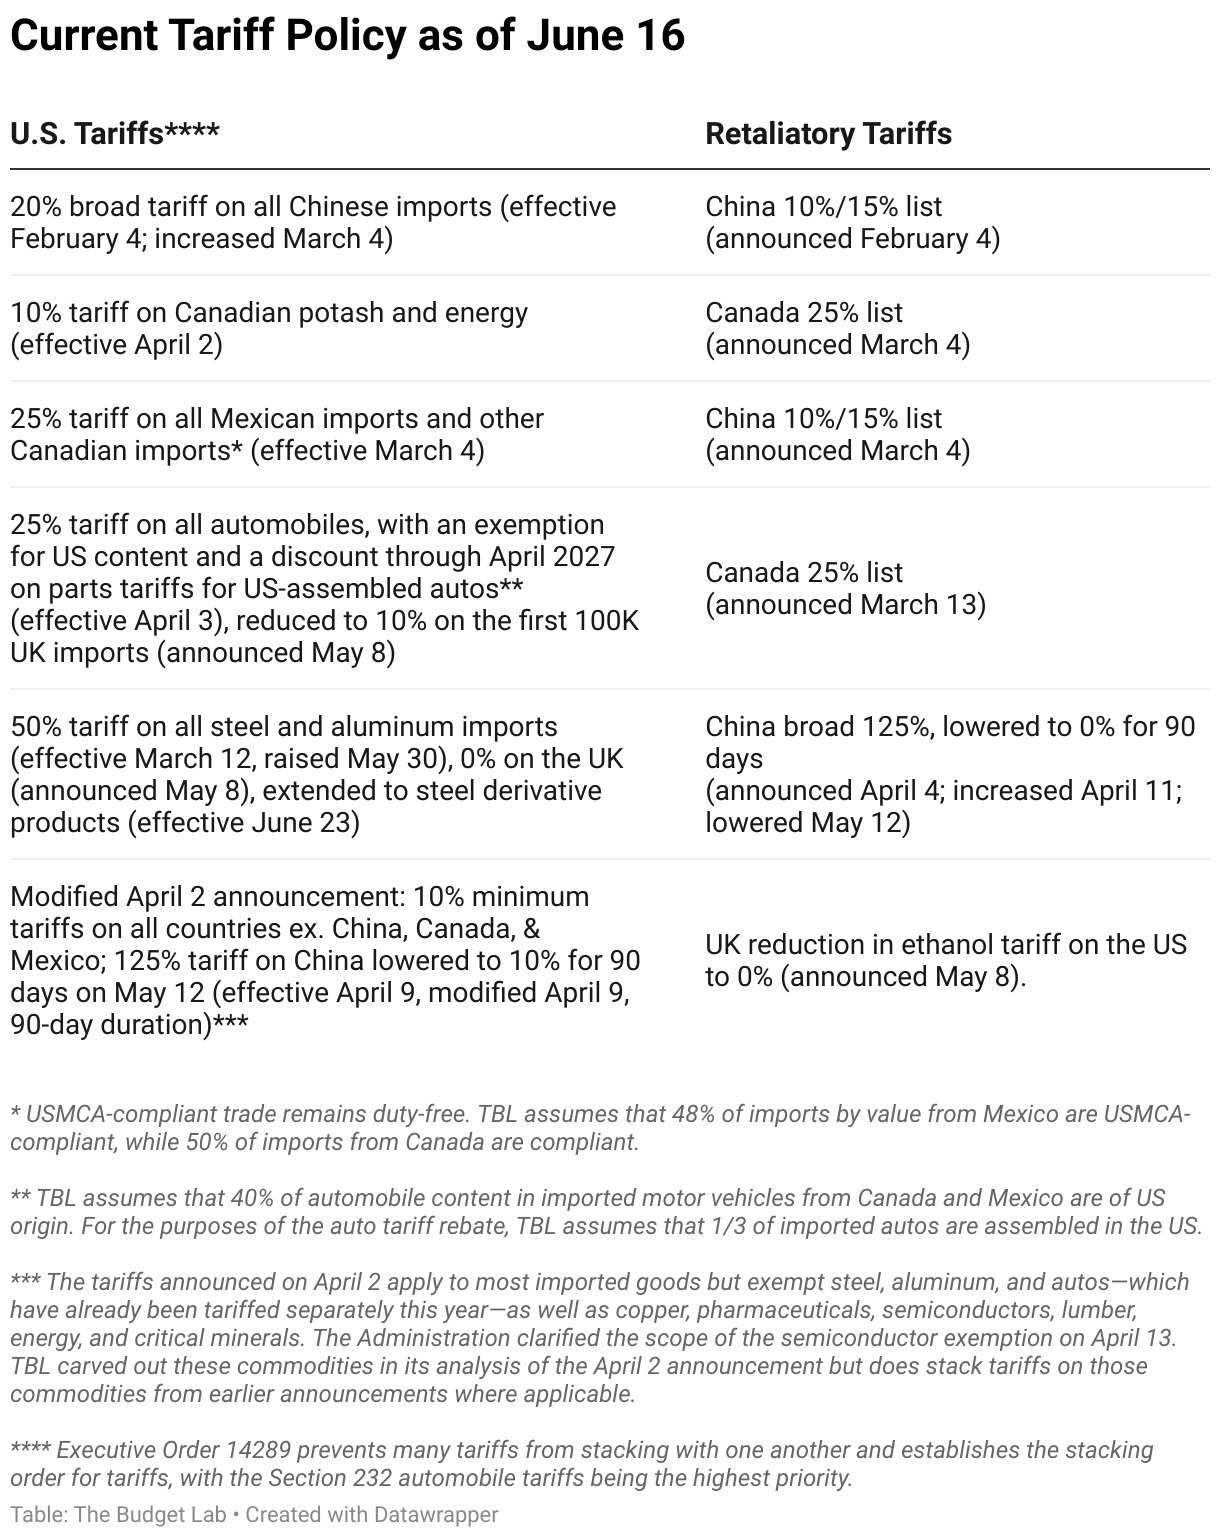
- The Department of Commerce issued a notice expanding the 50% steel & aluminum tariffs to cover “steel derivatives” including many household appliances like refrigerators, freezers, dish washers, washing machines, and dryers.1
- China ended export restrictions on rare earths and magnets as a result of the June 11 US-China deal (which otherwise ossified tariffs already assumed by TBL).
- TBL changed its tariff distributional analysis to be more internally consistent with the concepts and definitions used in its tax model. The changes have the effect of reducing the regressivity of tariffs. See the Methodological Appendix for more detail.
TBL analyzes tariffs on a “real-time current policy” basis, where policy as it stands as of date certain is assumed to continue in perpetuity, even if framed as a temporary policy.
Results
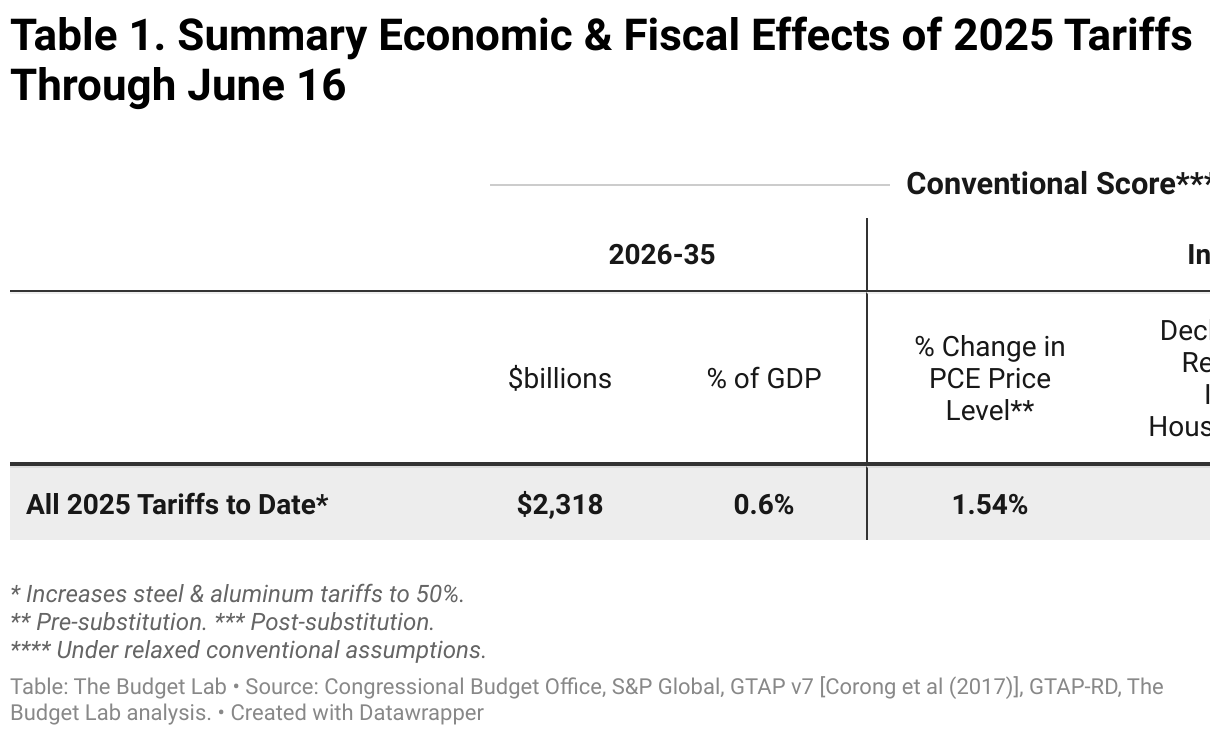
The table below summarizes the effects of current tariffs in place as of June 16, assuming they stayed in force indefinitely.
Average effective tariff rate
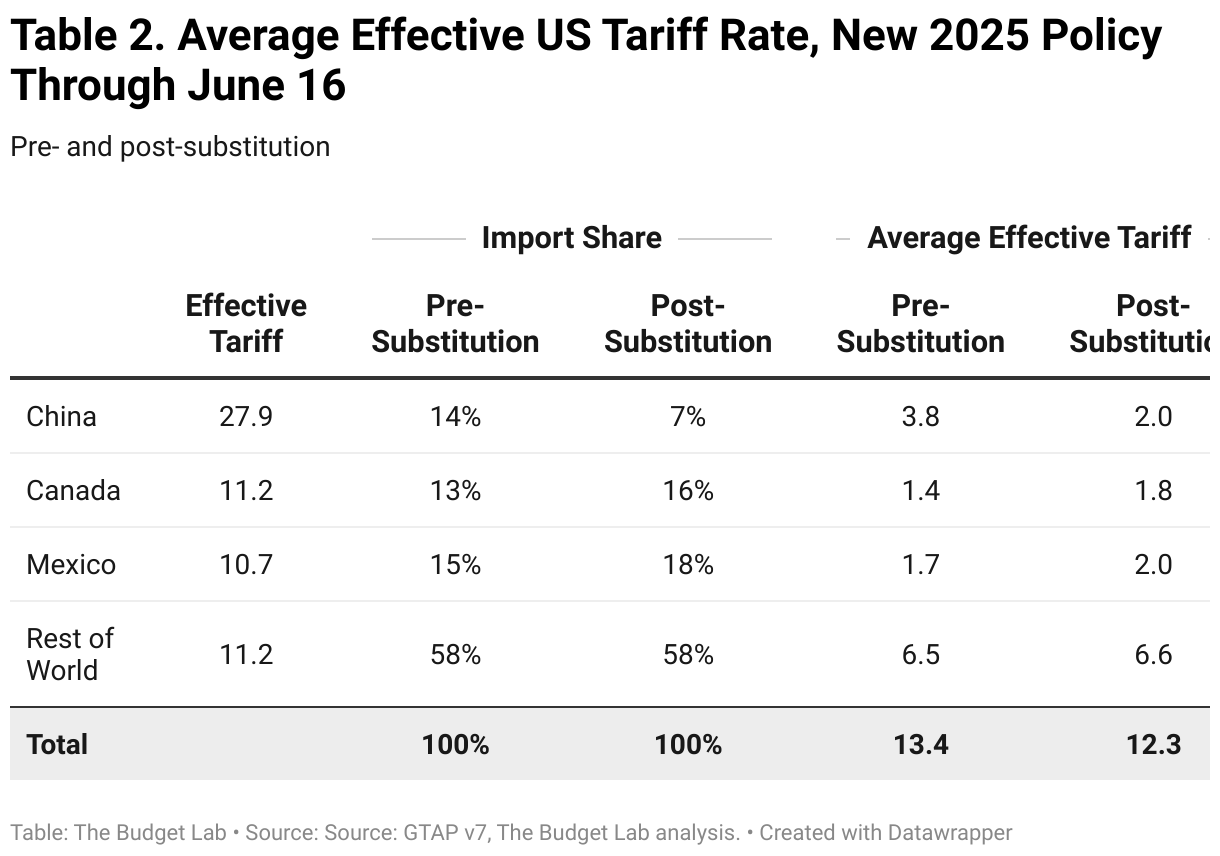
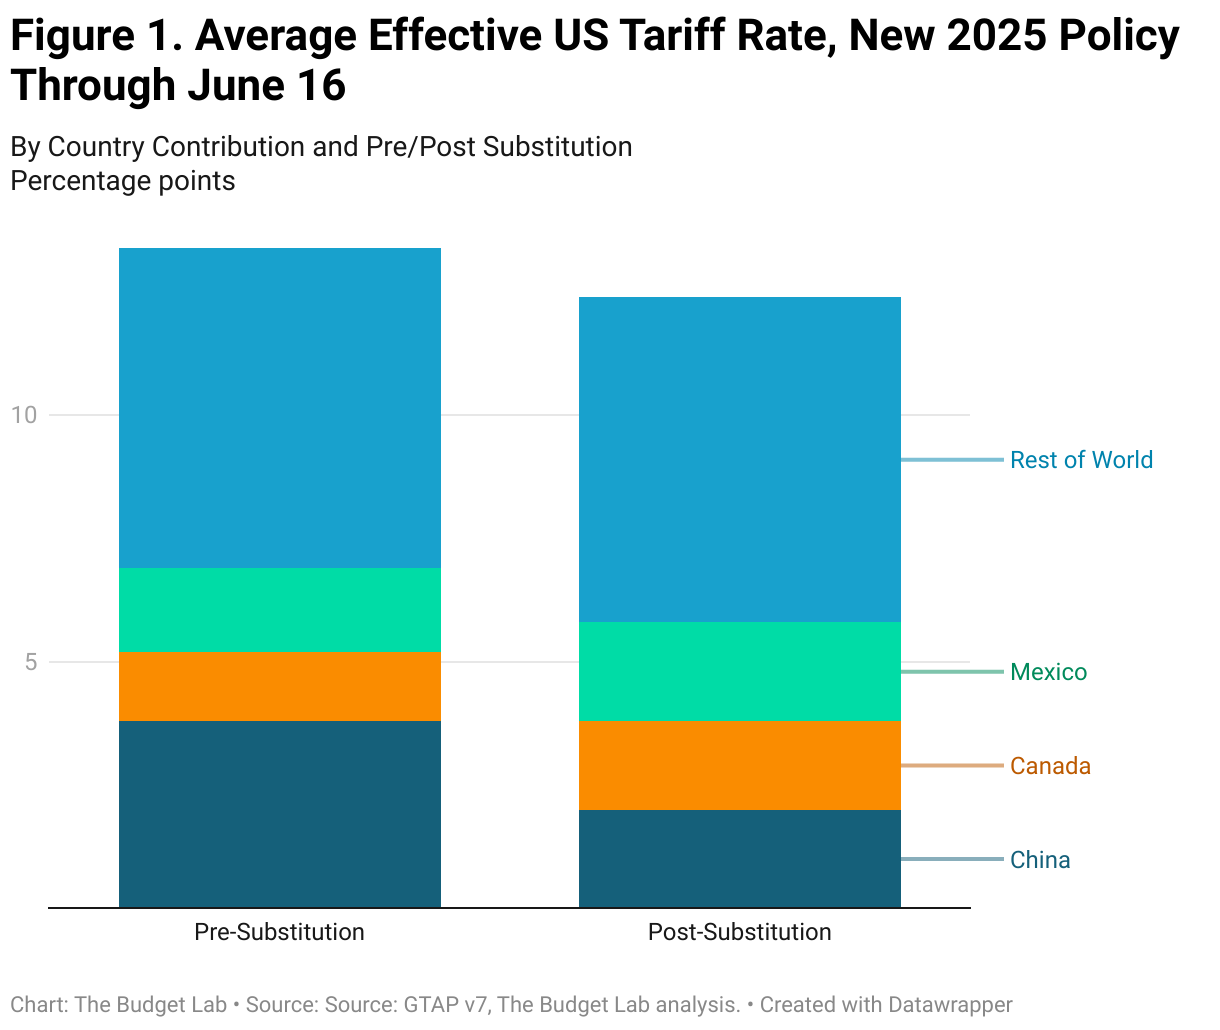
The distinction between pre-substitution metrics (before consumers and businesses shift purchases in response to the tariffs) and post-substitution (after they shift) is a crucial one. One metric where the difference is meaningful is the average effective tariff rate.
Measured pre-substitution—assuming there are no shifts in the import shares of different countries—the 2025 tariffs to date are the equivalent of a 13.4 percentage point increase in the US average effective tariff rate. That calculation assumes that, for example, the share of imports from China remains at 14%, where it was in 2024. This is the right way to think about the tariffs from the perspective of consumer welfare, since it reflects the full cost faced by consumers before they start making difficult spending choices. This increase would bring the overall US average effective tariff rate to 15.8%, the highest since 1936.
Post-substitution—after imports shift in response to the tariffs—the 2025 tariffs are a 12.3 percentage point increase in the US average effective tariff rate, which brings the overall US effective tariff rate to 14.7%, also the highest since 1938.
The timing of the transition from “pre” to “post” substitution is highly uncertain. Some shifts are likely to happen quickly—within days or weeks—while others may take longer.2
Average aggregate price impact
The 2025 tariffs imply an increase in consumer prices of 1.5% in the short-run, assuming no policy reaction from the Federal Reserve. This is a pre-substitution number that captures consumer welfare effects. It is the equivalent of a short-run income loss3 of $2,000 per household on average in 2025 dollars. The post-substitution price increase settles at 1.3%, a $1,700 short-run loss per household.
US real GDP & labor market effects
All 2025 US tariffs plus foreign retaliation lower real GDP growth by -0.6pp over calendar year 2025 (Q4-Q4). The unemployment rate ends 2025 0.3 percentage point higher, and payroll employment is 394,000 lower that same quarter. The level of real GDP remains persistently -0.34% smaller in the long run, the equivalent of $100 billion 2024$ annually, while exports are -14% lower.
Long-run US sectoral output & employment effects
Tariffs shrink the overall size of the US economy in the long-run by 0.3%, but beneath aggregate GDP they also drive reallocation across US sectors. Long-run output in the manufacturing sector expands by 1.6% under the tariffs, with nonadvanced durable manufacturing output 3.1% larger and nondurable manufacturing 0.6% larger. However, advanced manufacturing is down by 1.9%. Moreover, the expansion of the overall manufacturing sector more than crowds out the rest of the economy: construction contracts by 3.1%, agriculture by 1.1%, and mining & extraction by 1.0%.
Global long-run real GDP effects
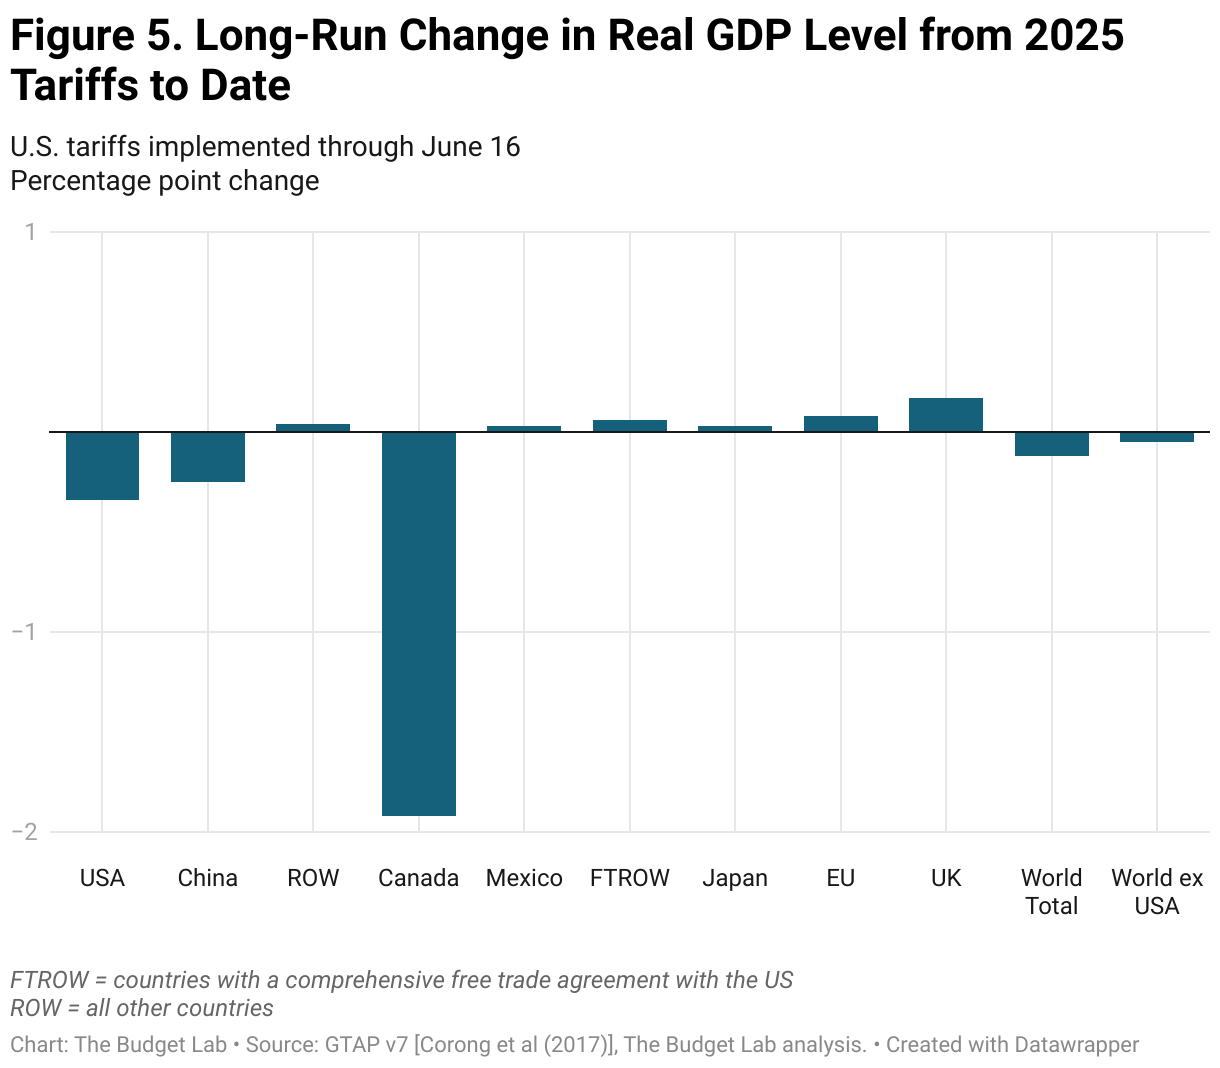
Canada has borne the brunt of the damage from US tariffs so far, with its long-run economy -1.9% smaller in real terms (reflecting both US tariffs and Canadian retaliation to date). China’s economy is -0.3% smaller, almost as large as the hit to the US. The EU economy is 0.1 percentage point larger in the long-run, while the UK’s is 0.2% bigger thanks in part to the benefits of US-UK trade deal.
Fiscal impact & historical context
The 2025 tariffs to date, were they to remain in place (and not expire after 90 days), would raise $2.3 trillion over 2026-35 conventionally-scored ($2.2 trillion over 2025-34).4 Given the negative output effects of the tariffs, there would be additional dynamic reductions in tax revenue as a result. Based on Congressional Budget Office rules-of-thumb, TBL estimates that these effects would total -$360 billion over the decade (-$324 billion over 2025-34), bringing total dynamic revenue to $2.0 trillion over 2026-35 ($1.8 trillion over 2025-34).
Short-run distributional impact
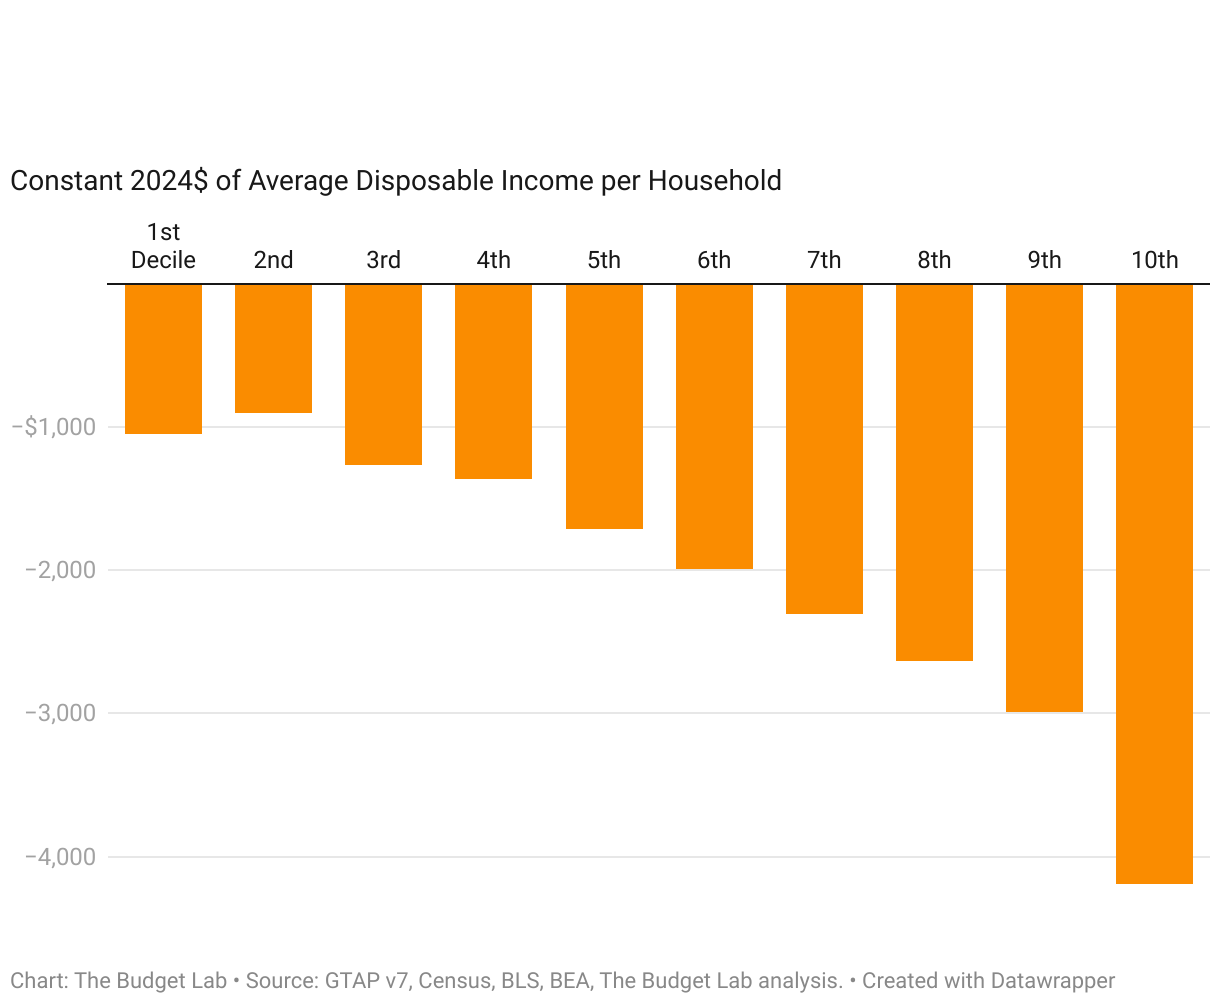
Tariffs are a regressive tax, especially in the short-run. This means that tariffs burden households at the bottom of the income ladder more than those at the top as a share of income. The regressivity is about the same when looking at all 2025 tariffs: the short-run burden on the 1st decile is more than 3x that of the top decile (-2.8% versus -0.8%). The average annual cost to households in the 1st and top decile rise to $1,100 and $4,200 respectively in 2025$. The median cost is $1,900 per household.

Tariffs are more distributionally-ambiguous in the longer-run. Tariffs reduce both labor income and above-normal returns to capital, or rents. We assume that owners of capital hold rents rather than consume them in the short-run, but do consume them over their lifecycle in the long-run. The implication is that the tariff burden is more regressive in the short-run and more evenly-distributed across households in the long-run
Commodity price effects
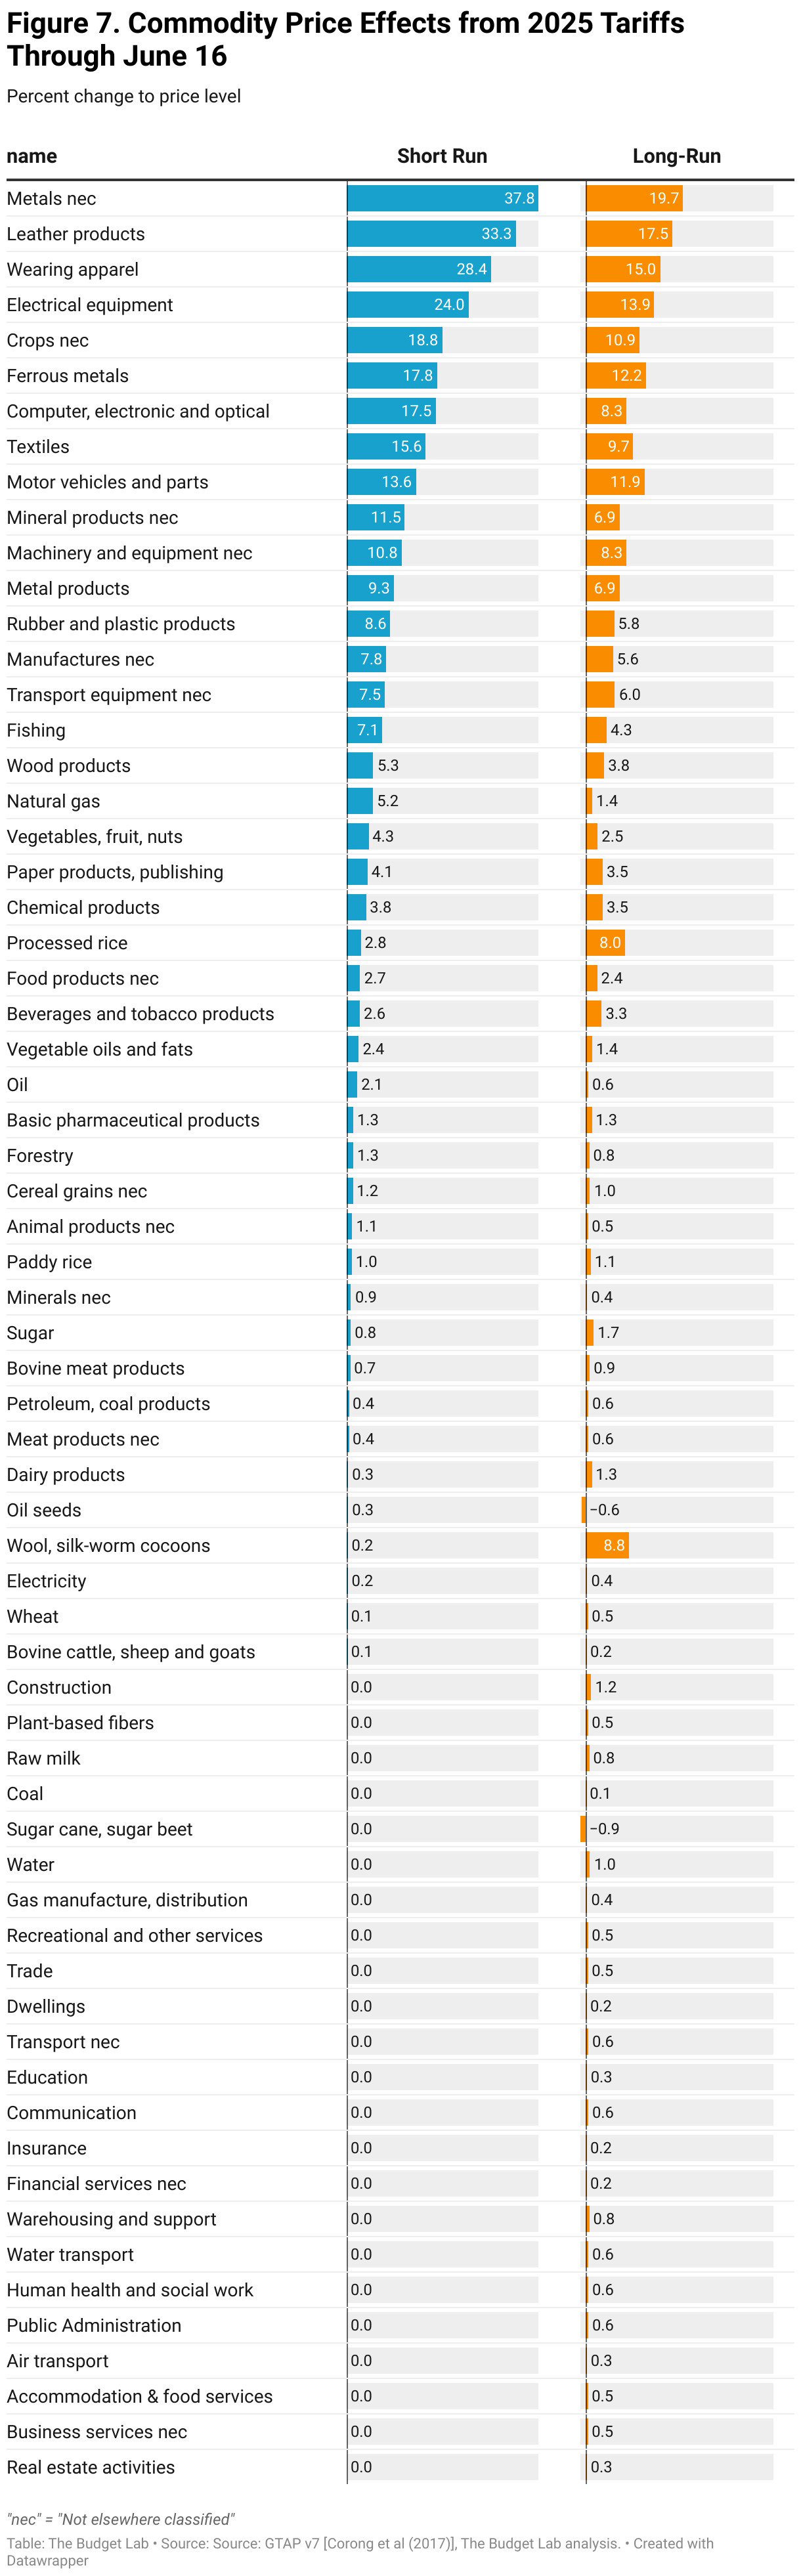
The charts below show how the 1.5% price level increase from the 2025 tariffs to date would look across individual commodities in the short-run (pre-substitution), as well as the 1.3% long-run price increase (post-substitution). Some high level takeaways:
- Consumers face high increases in clothing and textile prices in the short-run: prices increase 33% for leather products (shoes and hand bags), 28% for apparel, and 16% for textiles. After substitution and global supply shifts in the long-run, prices remain 18%, 15%, and 10% higher, respectively.
- Food prices rise 2.2% in the short-run and stay 2.2% higher in the long-run. Fresh produce is initially 4.3% more expensive while stabilizing at 2.5% higher.
- Motor vehicle prices rise 13.6% in the short-run and 11.9% in the long-run, the equivalent of an additional $6,500 and $5,700 respectively to the price of an average 2024 new car.
Methodological Appendix: Distribution of Tariffs
Beginning with the June 12 report on the combined distribution of OBBBA and tariffs, TBL introduced a new approach to distributing the costs of tariffs that is more consistent with its tax model and CBO distributional analysis, and is based on more reliable income data, particularly at the bottom of the ladder.
Previously, TBL distributed tariffs using expenditure-to-income ratios taken from the Consumer Expenditure Survey (CEX) to allocate the average PCE price effect by income decile, then expressing the allocation in dollars using NIPA average household disposable income as the base. The limitations of this approach are twofold: first, that CEX income data are much less reliable at lower income percentiles, particularly the bottom decile (TBL previously omitted data for this decile as a result); and, second, that the approach omits some important second order effects.
The new methodology overcomes these limitations. First, rather than allocate PCE effects directly by tariff-weighted CEX expenditure-to-income ratios, the new methodology first distributes aggregate consumption purchasing power effects (aggregate PCE times the average PCE price index effect) by tariff-weighted CEX expenditure shares alone, under the assumption that expenditures are measured more reliably up and down the income distribution than income in the CEX, such that the rank ordering of consumer units by expenditures in the CEX is correct. This limits the use of the CEX to the dimension it is most reliable for: expenditures. We take this distributed PCE effect as a share of CBO post-tax-and-transfer income (rather than NIPA disposable income) to estimate the gross distributional impact. Then, we account for two offsetting factors. The first is lower individual income taxes resulting from the interaction between a higher price level and the indexation of brackets, deductions, etc. The second offsetting factor is higher nominal Social Security (OASDI) and Supplemental Nutritional Assistance Program (SNAP) benefits, which would be indexed as a result of the aggregate price effects (the code used to estimate these offsetting factors can be found here). Finally, the new method chooses a specific base year now (in this case 2027, to represent fully-phased-in short-run effects) and uses CBO’s projections of 2027 post-tax-and-transfer income (expressed in 2025 dollars) as the basis for dollar calculations. This makes it compatible with CBO distributional analysis.
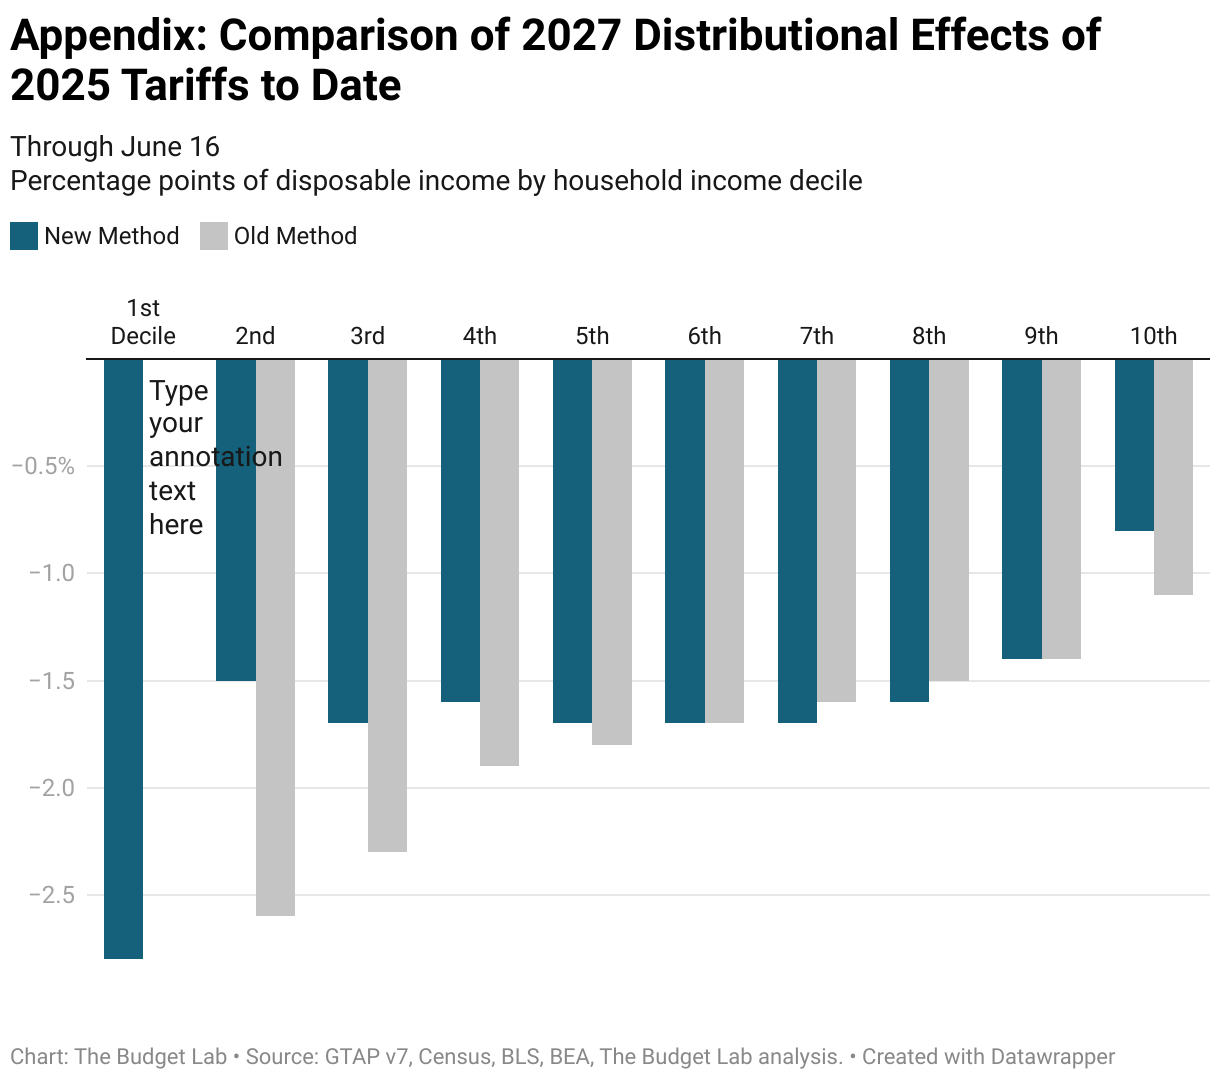
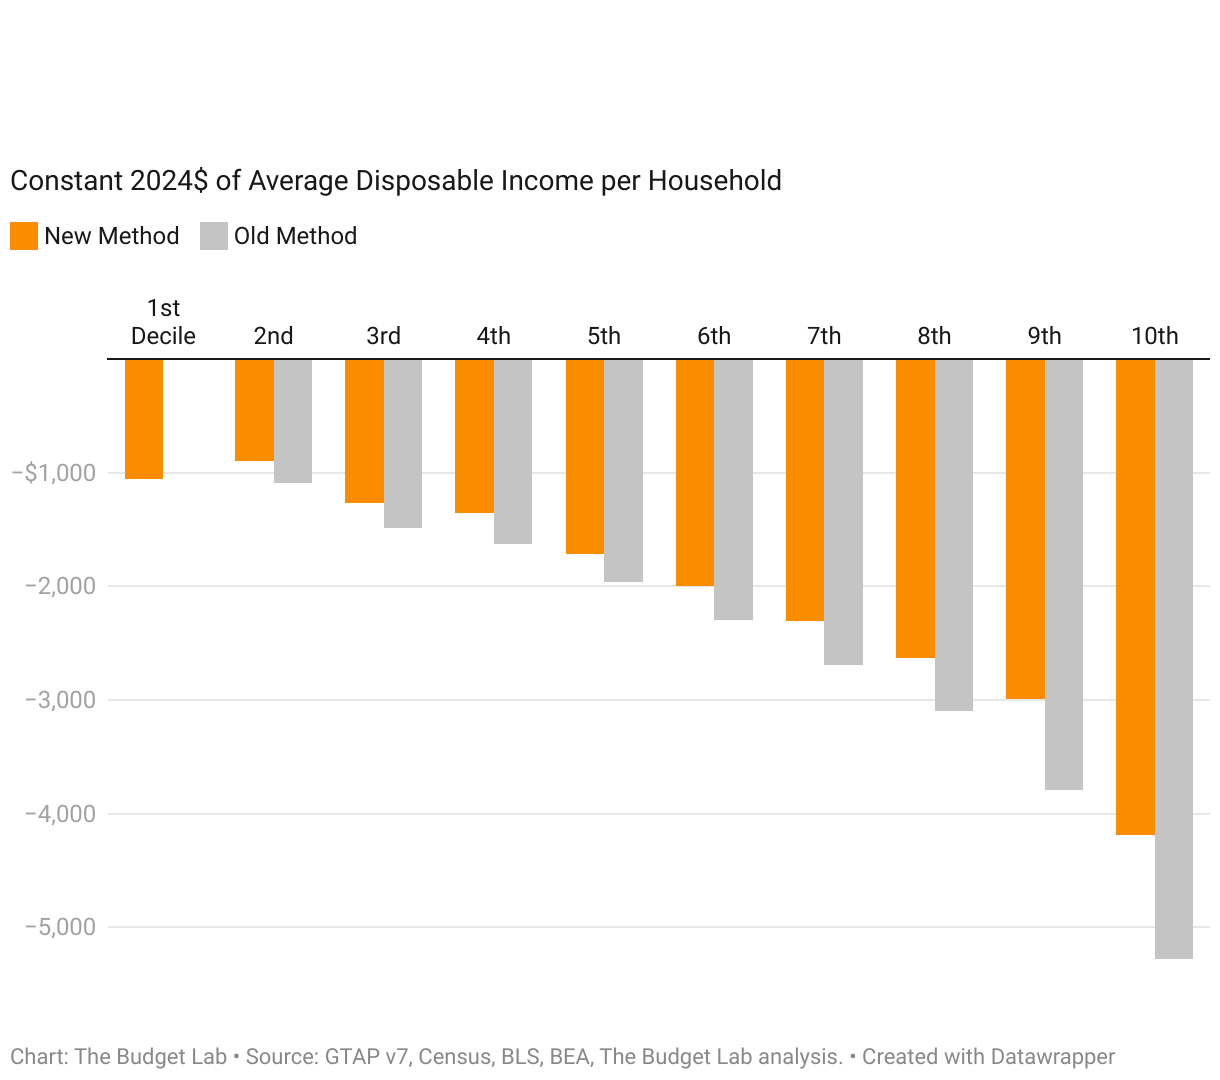
The figure below compares the distributional results under TBL’s new method with its old method. The biggest differences occur in deciles 2, 3, and 4, which now show smaller tariff impacts thanks to more-reliable income data underpinning the expenditure-to-income scaling and lower income households being more likely to see the benefits of upward-adjusted OASDI and SNAP benefits. The effect is also smaller at the very top under the new method, primarily due to the income and payroll tax offset.
Footnotes
- Consistent with the stacking order in Executive Order 14289, TBL assumes the steel & aluminum tariffs do not apply to Canada and Mexico, as the 25% IEEPA tariffs on Canada and Mexico are stacked higher in the order.
- TBL assumes throughout its tariff analysis that the transition to longer-run GTAP equilibria occurs after three years.
- TBL defines “income” as CBO-concept post-tax-and-transfer income. “Short-run” refers to the effect over the next couple of years; TBL proxies for this definition by using CBO projections of the distribution of income in 2027, expressed in 2025 dollars.
- TBL employs a “relaxed conventional” assumption for the retaliation scenario, whereby foreign income is permitted to fall but US income remains fixed.