
Combined Distributional Effects of the One Big Beautiful Bill Act and of Tariffs
Key Takeaways
-
The combination of 2025 tariff increases implemented as of June 1 and the One Big Beautiful Bill Act passed by the House of Representatives would reduce after-tax-and-transfer incomes on average among the bottom 80 percent of U.S. households.
-
The bottom ten percent of households would see an average reduction of more than 6.5 percent in incomes, while those at the top would see an increase of nearly 1.5 percent.
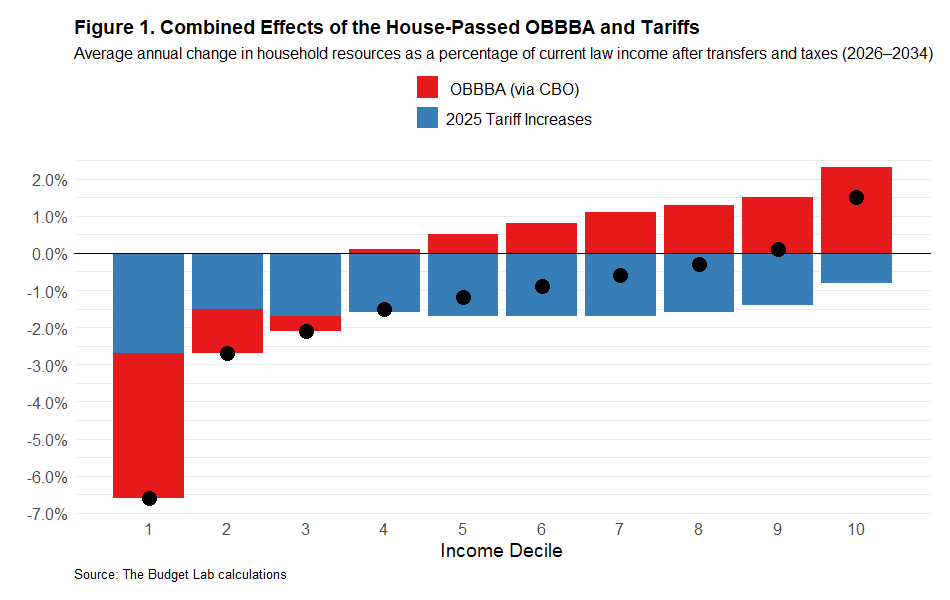
Note: Per CBO, the values for average annual income after transfers and taxes (in 2025 dollars) over 2026-2034 by decile are: $39,464, $62,920, $76,475, $89,615, $105,066, $121,456, $143,117, $171,054, $217,451, and $517,103. Deciles are calculated with respect to equivalized household income; see the Technical Appendix for more details.
Earlier today, the Congressional Budget Office (CBO) released a distributional analysis of the One Big Beautiful Bill Act (OBBBA) as passed by the House of Representatives. The report analyzes how the OBBBA, which includes cuts to both taxes and to spending, would affect households across the income distribution. CBO finds that middle- and higher-income households (those in the top seven deciles) would see an increase in after-tax-and-transfer incomes if the bill were enacted, but lower-income households would see a net reduction in their resources.
Importantly, CBO’s analysis considers the OBBBA in isolation, excluding (by design) the effects of other recent policy changes, like the Trump Administration’s tariff increases. CBO’s scope of analysis is analytically coherent: the goal of the report is to estimate the impacts of the bill only, and tariffs are not part of the bill. The Administration has said that tariffs should be understood as a fiscal offset to the OBBBA—a revenue-raising policy tool used to “pay for” higher deficits resulting from the OBBBA.
The Budget Lab has previously estimated the net budget impact of combining the OBBBA and recent increases in tariffs. Conventionally scored, OBBBA costs $2.4 trillion as written ($4.0 trillion if the temporary provisions become permanent). The tariffs implemented as of June 1 would raise $2.4 trillion. A natural follow-up question is: what is the net distributional impact of both the OBBBA and tariffs? This report answers that question by incorporating tariffs into CBO’s distributional estimates of the OBBBA. Our tariff estimates, which reflect the Trump Administration's 2025 tariff increases this year through June 1, are based on prior TBL analysis and are adjusted to match the income concepts in CBO’s report.1 (See the Technical Appendix below for further methodological details and replication code.)
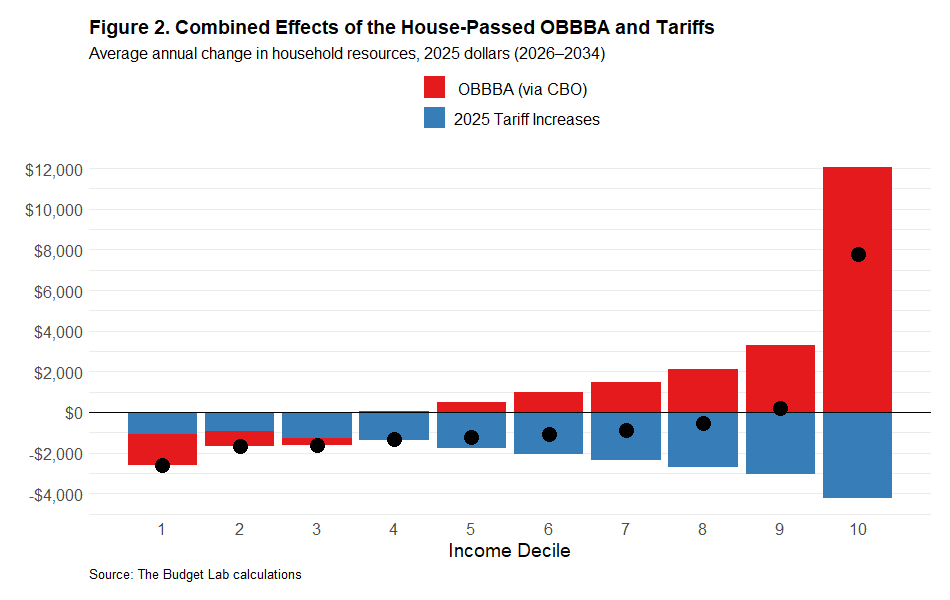
The results of this exercise are shown in Figure 1, which reports average annual changes to after-tax-and-transfer income over the 2026-2034 period. We find that the combination of OBBBA and 2025 tariffs would reduce resources on average among the bottom 80 percent of households. The bottom ten percent of households would see an average reduction of more than 6.5 percent in incomes, while those at the top would see an increase of nearly 1.5 percent.
Technical Appendix
This Appendix explains how we calculate the numbers in this report. The results can be replicated by running this R code.
The Budget Lab has previously presented estimates of the distributional impact of tariffs. Information on our overall tariff methodology can be found here. Our prior distributional methodology is based in part on Clausing and Lovely (2024): The Budget Lab calculates the consumption shares, relative to income, of each category of good exposed to tariffs by income decile using the Consumer Expenditure Survey (CEX), then uses this result to distribute our aggregate price-effect calculation across different consumption units. For this report, however, we needed to modify our methodology to produce an “apples-to-apples" comparison to CBO’s estimates. There are two main changes required to harmonize the concepts in our prior distributional approach with those of CBO.
The first change is that we shift to ranking households by an income measure that adjusts for family size. CBO ranks households by equivalized income after taxes transfers, dividing income by the square root of family size. Our prior estimates used published CEX distributional data, which do not adjust for household size when constructing income percentiles.
The second change is that we use a broader measure of after-tax-and-transfer income when calculating the percent change in resources due to tariffs. The measure of after-tax-and-transfer income used in our prior analyses is taken directly from the CEX, which is known to have issues with income underreporting at both the low and high ends of the income distribution. (In fact, previously TBL did not report tariff distributional effects at the first income decile for this very reason). CBO, on the other hand, corrects for these issues in their distributional work. Therefore, to harmonize our tariff estimates with CBO’s, we take their after-tax-and-transfer income estimates as the baseline against which relative effects are measured. Relative to our prior analyses, this change reduces the measured regressivity of tariffs.
To implement these changes, we begin with the “Additional Data for Researchers” files from CBO’s most recent Distribution of Household Income report. These files report estimated average fiscal income and its components for each quintile. To impute consumption for each quintile, we rank consumption units in the 2019 CEX by equivalized after-tax-and-transfer income and calculate each quintile’s share of total consumption.2 We then distribute 2019 personal consumption expenditures (PCE) to each quintile in those proportions and calculate average consumption. To this quantity, we apply our estimates of the quintile-specific tariff-driven percent change in PCE price index, an estimate which accounts for compositional differences in spending patterns across income groups. This step generates gross tariff burden in dollars. Finally, we divide this quantity by after-tax-and-transfer income to generate a relative measure of distributional impact. We validate this process by multiplying the dollar-amount gross tariff burdens by the ratio of projected 2026 PCE to 2019 PCE and comparing to our estimates of 2026 gross tariff revenue, finding a difference of about 2%.
We also account for two additional factors affecting the net distributional impact of tariffs for the first time in TBL’s analysis on this topic. These factors are related to the inflation indexing rules for government benefits and taxes:
- Higher transfer benefits. Tariffs, a type of indirect tax, create a wedge between the level of producer prices and of consumer prices. This wedge can either be resolved in the form of higher consumer prices (“pass-forward”) or lower nominal market incomes (“pass-backward”). While these scenarios are economically equivalent in the long run, our tariff analysis assumes the Fed accommodates the tariffs and allows the price level to rise—that is, the pass-forward scenario—since in this case the wedge mechanically is a one-time effect on the price level.
When the price level rises, certain government transfer benefits rise automatically due to cost-of-living adjustments. In other words, the burden of tariff-driven price hikes is offset to the extent that consumption is funded by indexed transfer benefits. Because these benefits make up a larger fraction of income for lower-income households, this dynamic reduces the regressivity of tariffs. We account for this dynamic by adjusting each quintile’s OASDI, SSI, and SNAP income proportionally to the PCE price level impact.
- Lower individual income taxes. The same logic applies to individual income taxes, since most provisions are indexed to inflation. In the pass-forward scenario, nominal market incomes are unchanged, but tax brackets, the standard deduction, etc. are higher, and individual income taxes fall as a result. To estimate this effect in Tax-Simulator, we run a scenario where the inflation index and Social Security benefits are increased by the estimated PCE price level change, scored against a scenario where the OBBBA tax law applies.
The inclusion of these factors represents a new, permanent feature of Budget Lab tariff distribution methodology, not a change made specifically for this analysis in order to harmonize our concepts with those of CBO. The net effect of these two factors is to reduce the net burden of tariffs across all income groups and slightly reduce their regressivity.
Footnotes
- Note that CBO's distributional estimates are for a conventional score. The Budget Lab's tariff estimates are also conventional and pre-substitution.
- In other words, we assume the rank order of after-tax-and-transfer income is correct but make no assumptions about the accuracy of its level across quintiles.