
State of U.S. Tariffs: May 29, 2025
Key Takeaways
-
The Budget Lab (TBL) estimated the effects all remaining US tariffs and foreign retaliation implemented in 2025 through May 28, assuming all tariffs previously introduced under IEEPA authority are invalidated per the May 28 U.S. Court of International Trade Ruling.
-
The May 28 court ruling leaves only tariffs introduced under Section 232 authority in place: tariffs on steel and aluminum as well as autos and auto parts. Future Section 232 tariffs on other commodities such as pharmaceuticals and semiconductors are expected but not yet implemented.
-
Current Tariff Rate: Consumers face an overall average effective tariff rate of 6.9%, the highest since 1969. After consumption shifts, the average tariff rate will be 7.0%, also the highest since 1969.
-
Overall Price Level & Distributional Effects: The price level from all 2025 tariffs rises by 0.6% in the short-run, the equivalent of an average per household consumer loss of $950 in 2024$. Annual pre-substitution losses for households at the bottom of the income distribution are $800. The post-substitution price increase settles at the same 0.6%.
-
Commodity Prices: The 2025 tariffs affect metals inputs and automobile prices primarily. The latter sees a 5% long-run price increase, the equivalent of an extra $2,400 on the cost of an average 2024 new car.
-
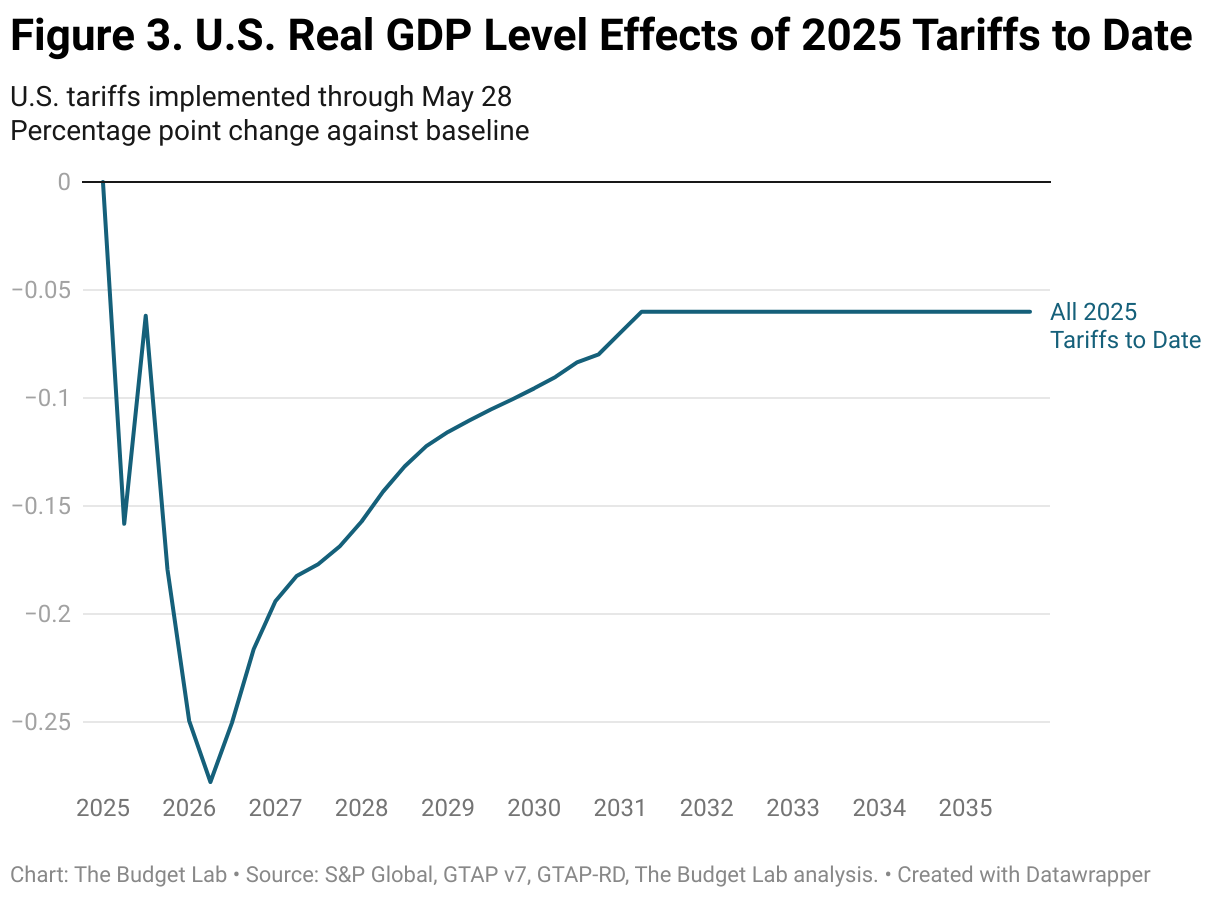
Real GDP Effects: US real GDP growth is -0.2pp lower from all 2025 tariffs. In the long-run, the US economy is persistently -0.1% smaller respectively, the equivalent of $20 billion annually in 2024$.
-
Labor Market Effects: The unemployment rate rises 0.1 percentage point by the end of 2025, and payroll employment is 127,000 lower.
-
Long-Run Sectoral GDP & Employment Effects: In the long-run, US manufacturing output contracts by 0.1%, while construction output contracts by 1.5% and agriculture declines by 1.2%.
-
Fiscal Effects: All tariffs to date in 2025 raise $686 billion over 2026-35, with $101 billion in negative dynamic revenue effects.
Changes Since the Last Report
Since the May 23 report:
- The U.S. Court of International Trade invalidated tariffs announced under IEEPA authority, including the “reciprocal” tariffs and 25% tariffs on Canada and Mexico.
- President Trump delayed the previously-announced 50% tariff on the EU.
TBL analyzes tariffs on a “real-time current policy” basis, where policy as it stands as of date certain is assumed to continue in perpetuity, even if framed as a temporary policy.

Results
The table below summarizes the effects of current tariffs in place as of May 28, assuming they stayed in force indefinitely.

Average effective tariff rate
The distinction between pre-substitution metrics (before consumers and businesses shift purchases in response to the tariffs) and post-substitution (after they shift) is a crucial one. One metric where the difference is meaningful is the average effective tariff rate.
Measured pre-substitution—assuming there are no shifts in the import shares of different countries—the 2025 tariffs to date (assuming IEEPA-authority tariffs remain invalid) are the equivalent of a 4.5 percentage point increase in the US average effective tariff rate. That calculation assumes that, for example, the share of imports from China remains at 14%, where it was in 2024. This is the right way to think about the tariffs from the perspective of consumer welfare, since it reflects the full cost faced by consumers before they start making difficult spending choices. This increase would bring the overall US average effective tariff rate to 6.9%, the highest since 1969.
Post-substitution—after imports shift in response to the tariffs—the 2025 tariffs are a 4.6 percentage point increase in the US average effective tariff rate, which brings the overall US effective tariff rate to 7.0%, also the highest since 1969.
The timing of the transition from “pre” to “post” substitution is highly uncertain. Some shifts are likely to happen quickly—within days or weeks—while others may take longer.1


Average aggregate price impact
The 2025 tariffs imply an increase in consumer prices of 0.6% in the short-run, assuming no policy reaction from the Federal Reserve. This is a pre-substitution number that captures consumer welfare effects. It is the equivalent of a loss of purchasing power of $950 per household on average in 2024 dollars. The post-substitution price increase settles at the same 0.6%.
US real GDP & labor market effects
All 2025 US tariffs plus foreign retaliation lower real GDP growth by -0.2pp over calendar year 2025 (Q4-Q4). The unemployment rate ends 2025 0.10 percentage point higher, and payroll employment is 127,000 lower that same quarter. The level of real GDP remains persistently -0.06% smaller in the long run, the equivalent of $20 billion 2024$ annually, while exports are -3.9% lower.
Long-run US sectoral output & employment effects
Tariffs shrink the overall size of the US economy in the long-run by 0.1%, but beneath aggregate GDP they also drive reallocation across US sectors. Long-run output in the manufacturing sector contracts by 0.1% under the tariffs, though durable manufacturing expands by 0.1%. However, advanced durable manufacturing output falls 0.3%. Moreover, construction contracts by 1.5% and agriculture by 1.2%.

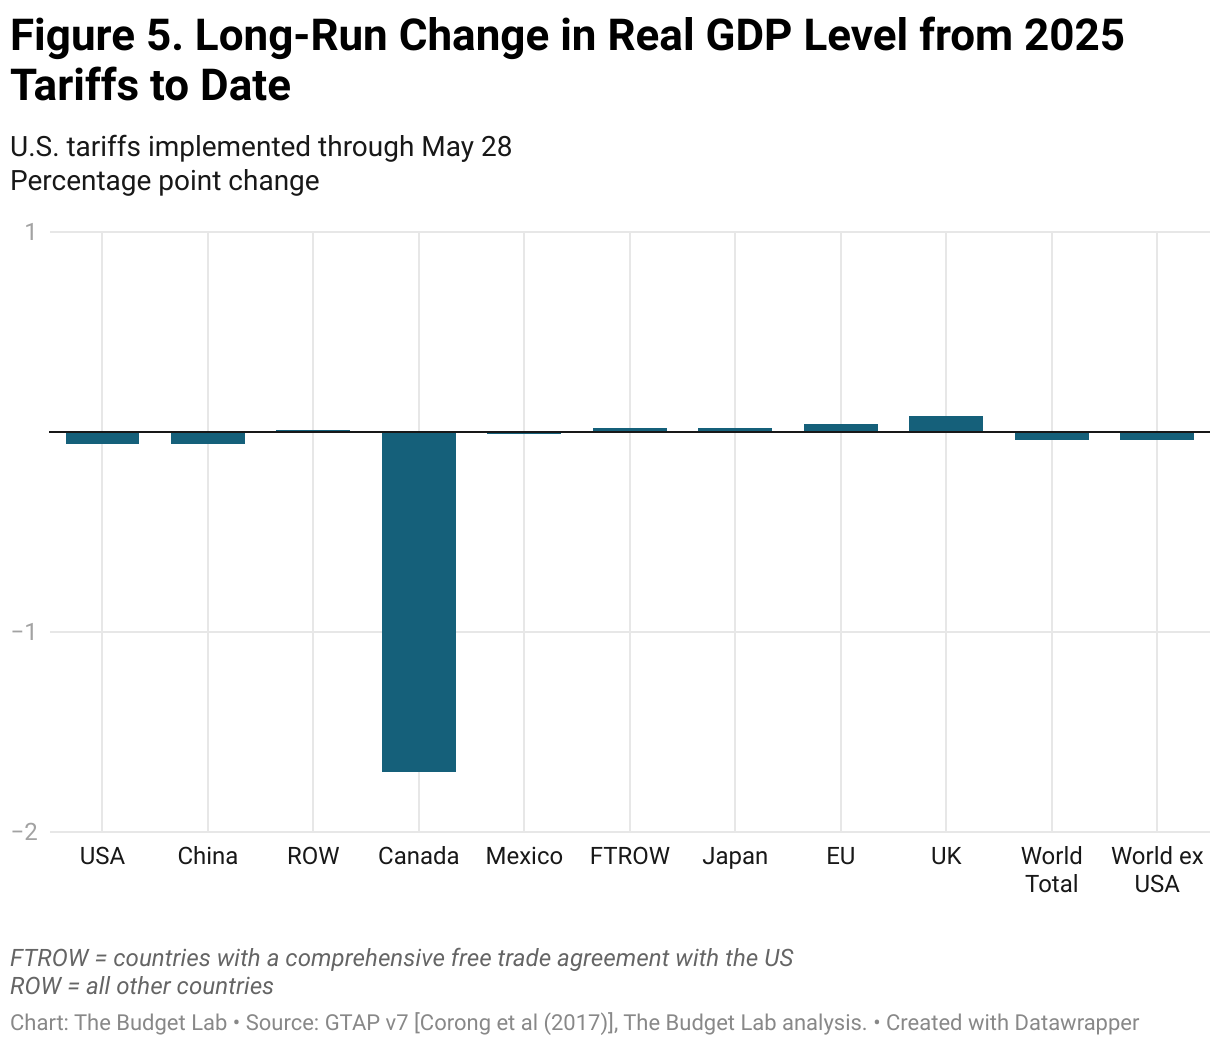
Global long-run real GDP effects
Canada has borne the brunt of the damage from US tariffs so far, with its long-run economy -1.7% smaller in real terms (this is primarily because of Canadian retaliation still in effect). China’s economy is -0.1% smaller, exactly the same as the hit to the US. The UK’s economy is 0.1% bigger.
Fiscal impact & historical context
The 2025 tariffs to date, were they to remain in place (and not expire after 90 days), would raise $686 trillion over 2026-35 conventionally-scored.2 Given the negative output effects of the tariffs, there would be additional dynamic reductions in tax revenue as a result. Based on Congressional Budget Office rules-of-thumb, TBL estimates that these effects would total -$101 billion over the decade.
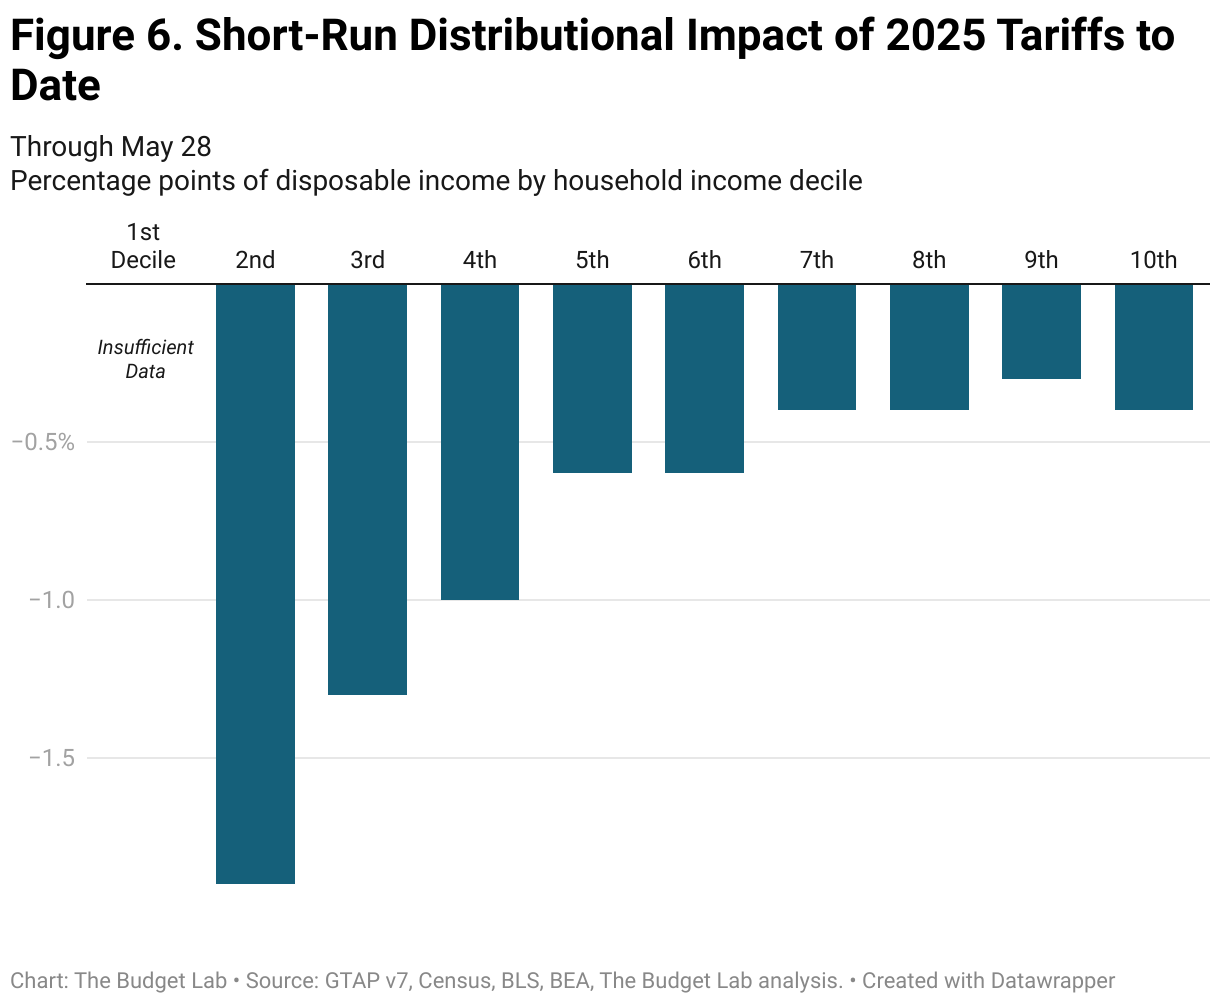
Short-run distributional impact
Tariffs are a regressive tax, especially in the short-run. This means that tariffs burden households at the bottom of the income ladder more than those at the top as a share of income. The regressivity is about the same when looking at all 2025 tariffs: the burden on the 2nd decile is nearly 5x that of the top decile (-1.9% versus -0.4%). The average annual cost to households in the 2nd, 5th, and top decile rise to $810; $708; and $2,000 respectively.
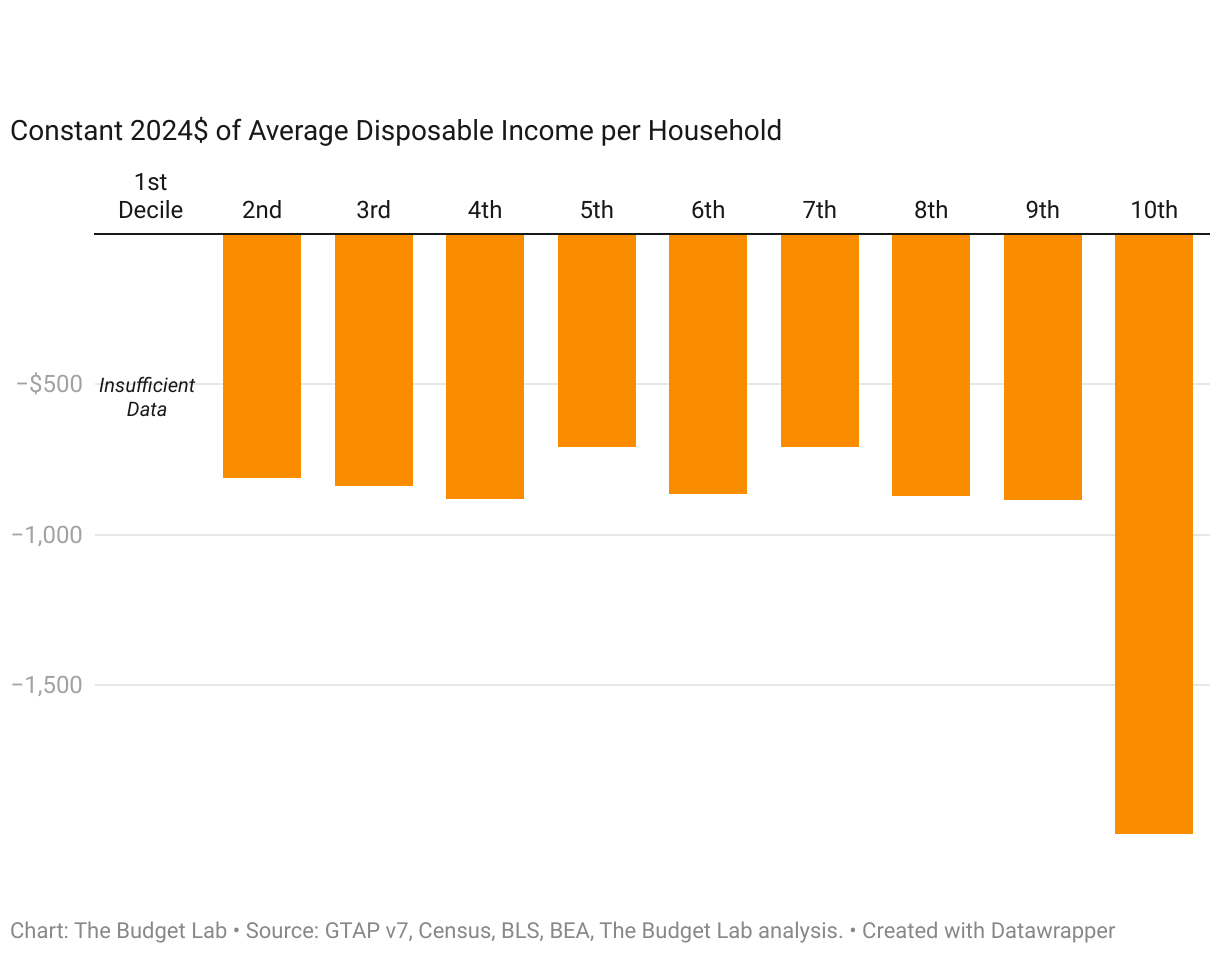
Tariffs are more distributionally-ambiguous in the longer-run. Tariffs reduce both labor income and above-normal returns to capital, or rents. We assume that owners of capital hold rents rather than consume them in the short-run, but do consume them over their lifecycle in the long-run. The implication is that the tariff burden is more regressive in the short-run and more evenly-distributed across households in the long-run
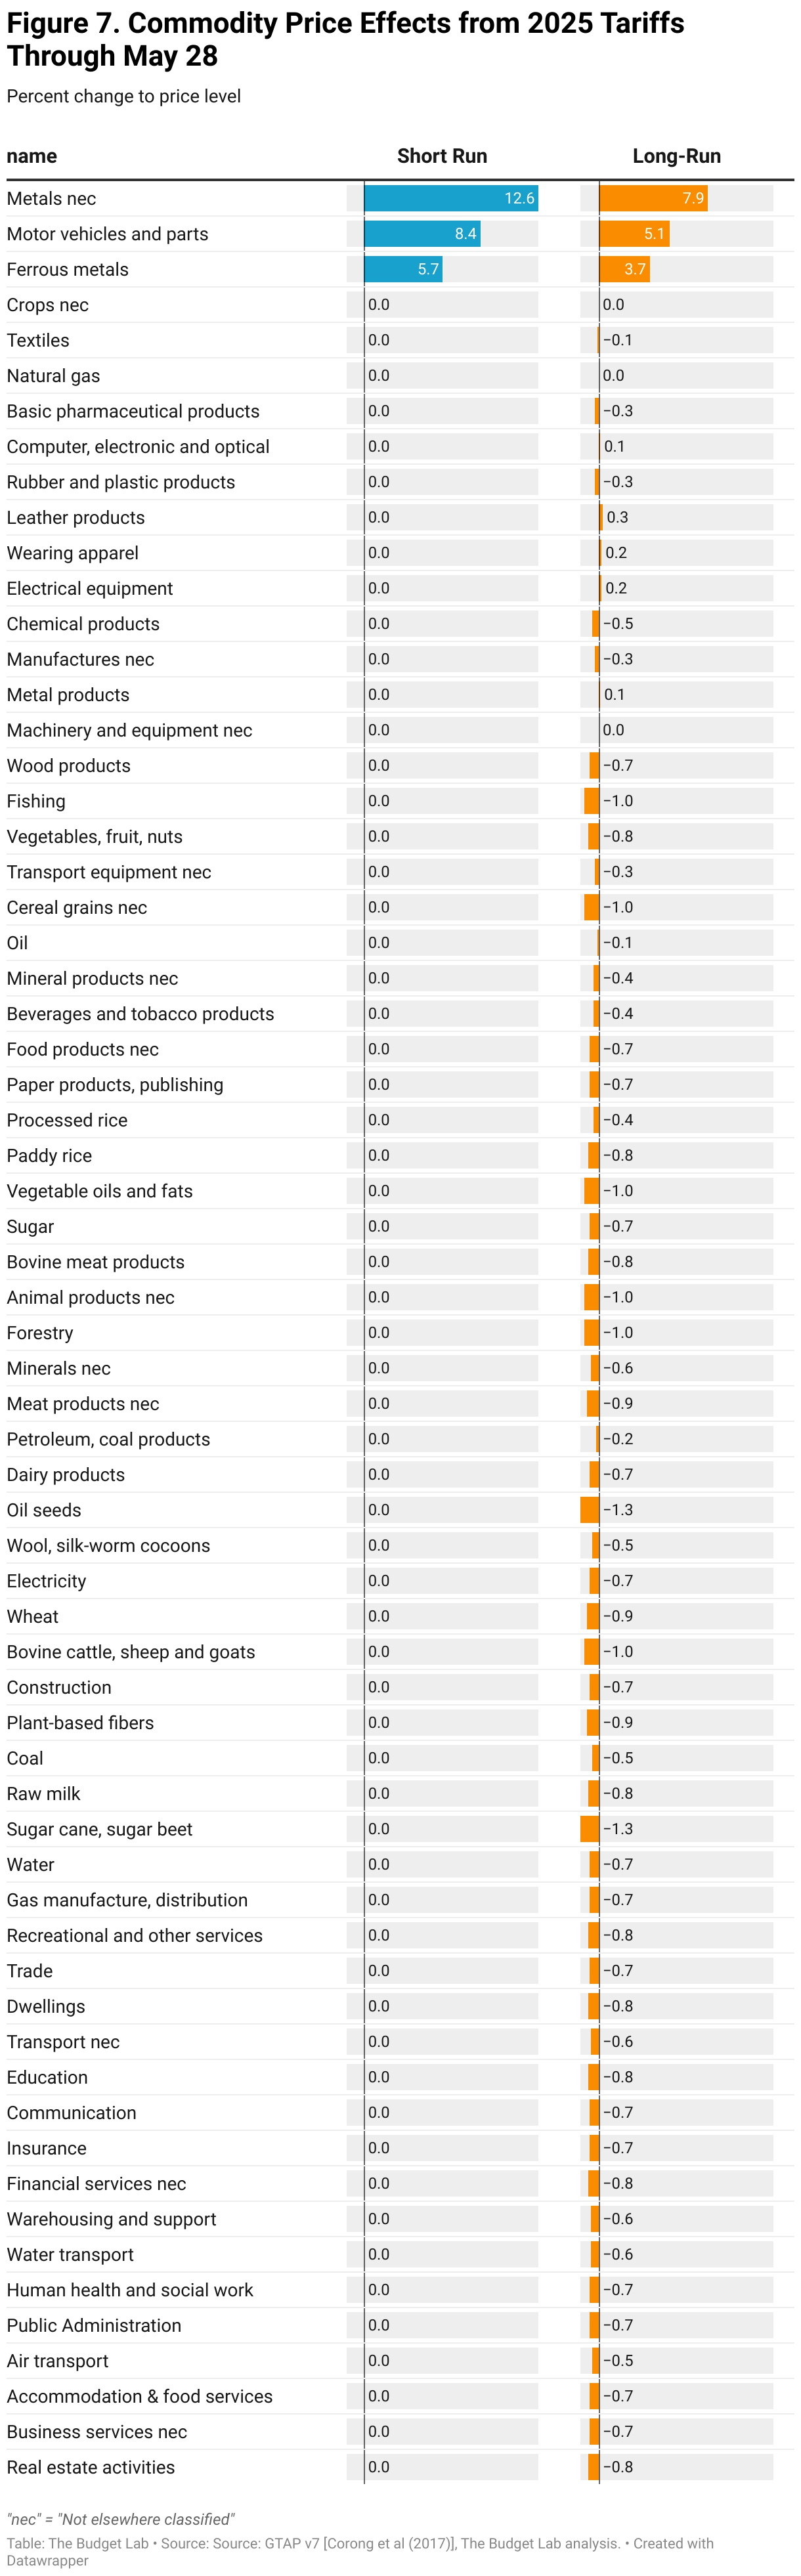
Commodity price effects
The charts below show the price level increases consumers would face from the 2025 tariffs to date, both in the short-run (pre-substitution) as well as in the long-run (post-substitution). Some high level takeaways:
- The steel & aluminum tariffs raise ferrous metal prices by 6% in the short-run and non-ferrous metal prices by 13%. In the long run, prices remain 4% and 8% higher respectively.
- Motor vehicle prices rise 8% in the short-run and 5% in the long-run, the latter the equivalent of an additional $2,400 to the price of an average 2024 new car.
Footnotes
- TBL assumes throughout its tariff analysis that the transition to longer-run GTAP equilibria occurs after three years.
- TBL employs a “relaxed conventional” assumption for the retaliation scenario, whereby foreign income is permitted to fall but US income remains fixed.