
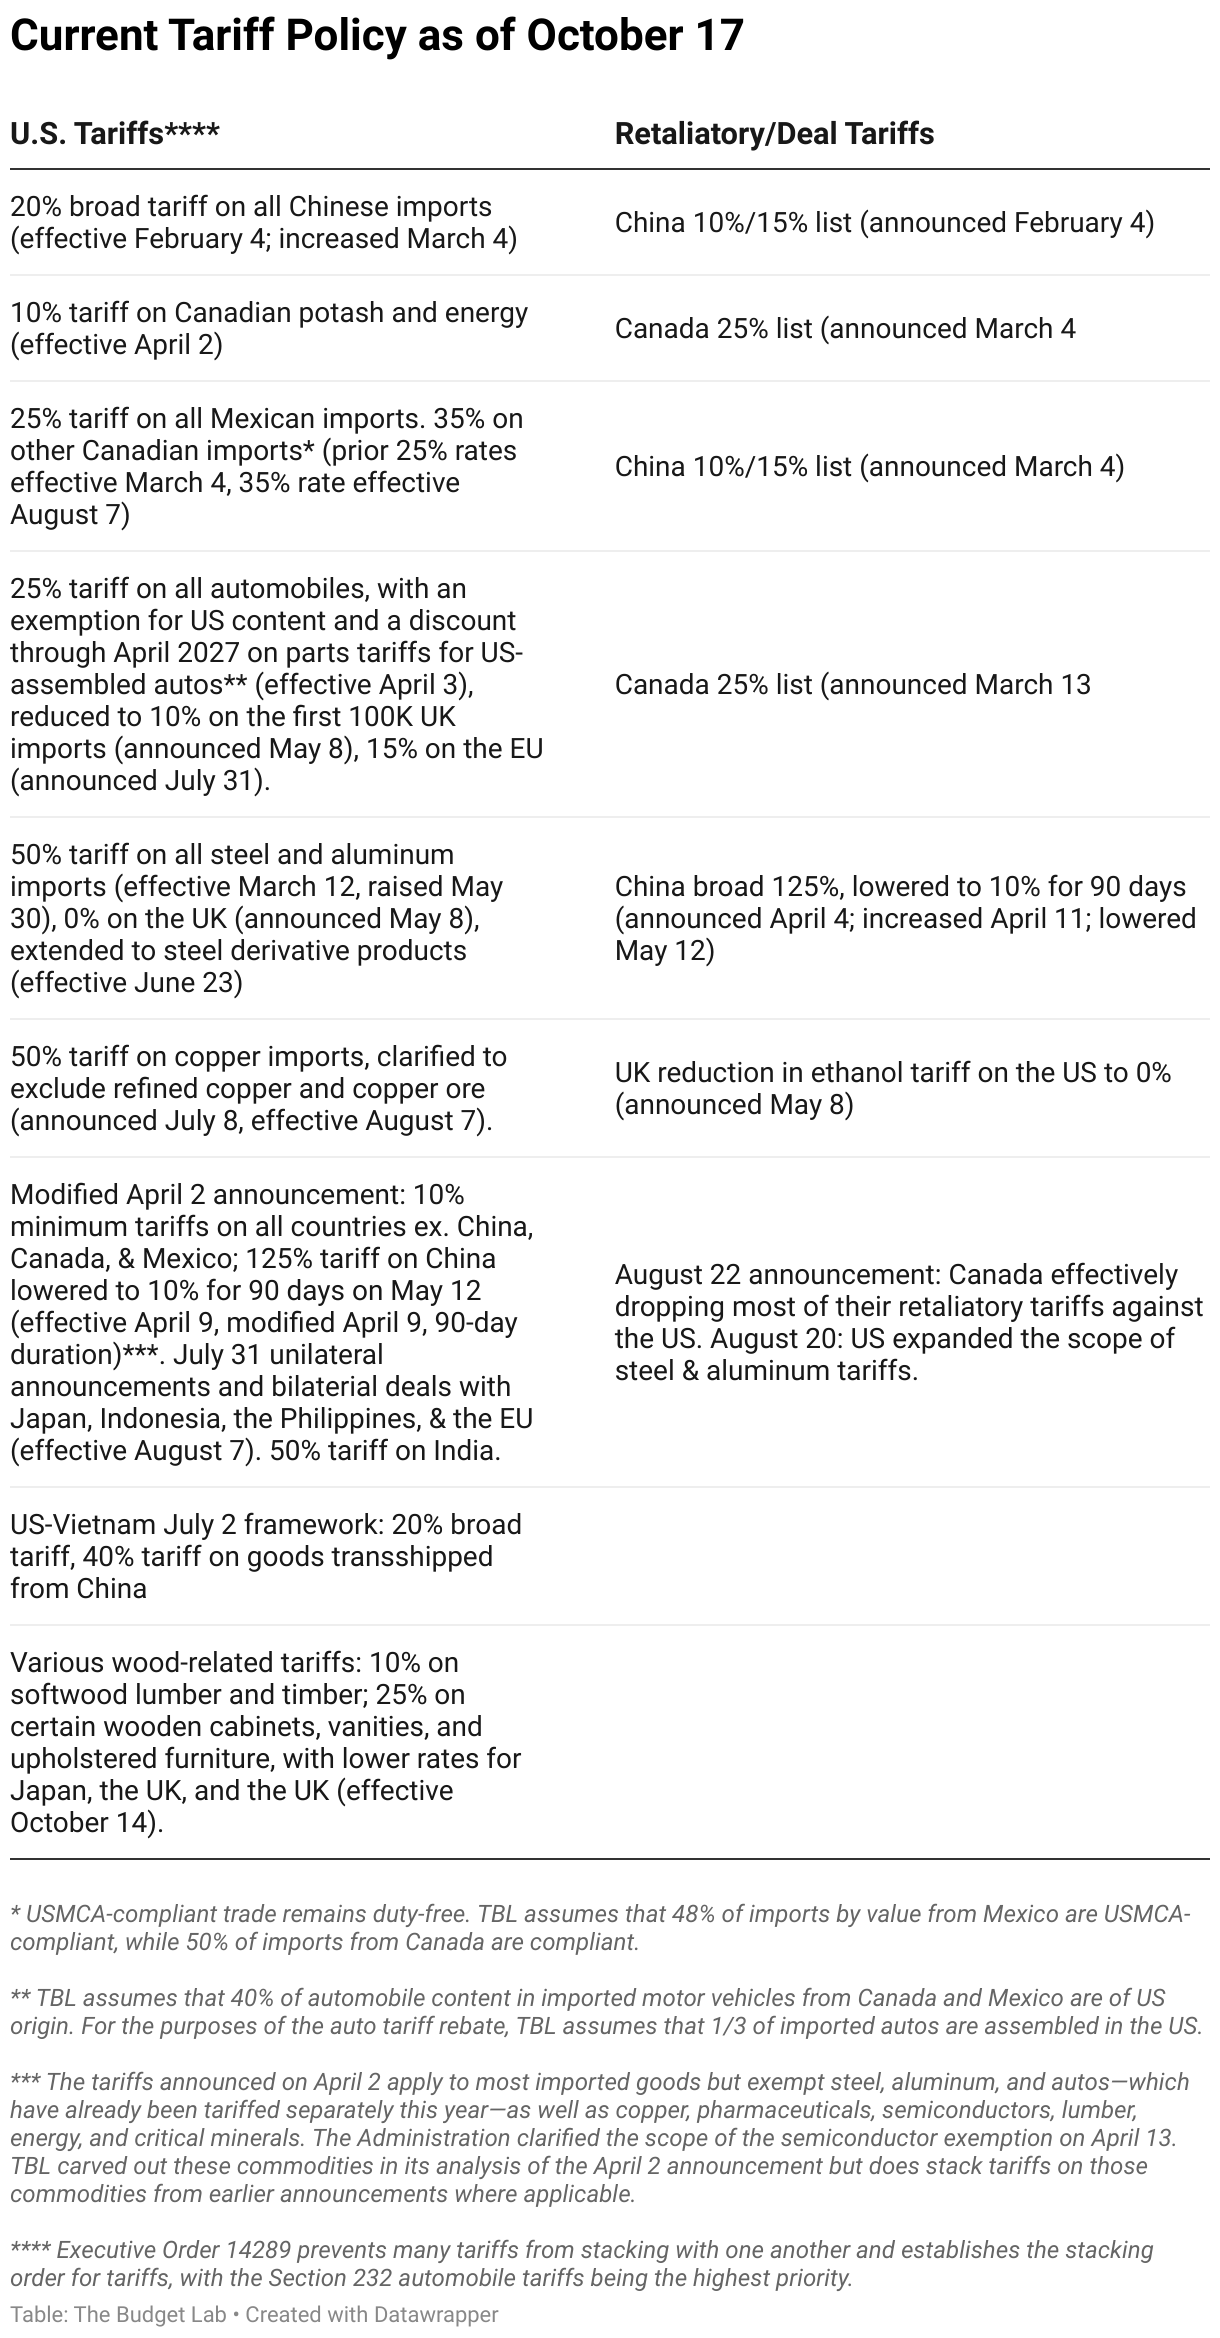
State of U.S. Tariffs: October 17, 2025
Key Takeaways
-
The Budget Lab (TBL) estimated the effects all US tariffs and foreign retaliation implemented in 2025 through October 17, including the recently implemented tariffs on certain wood products. TBL assumes that these tariff policies remain in effect in perpetuity.
-
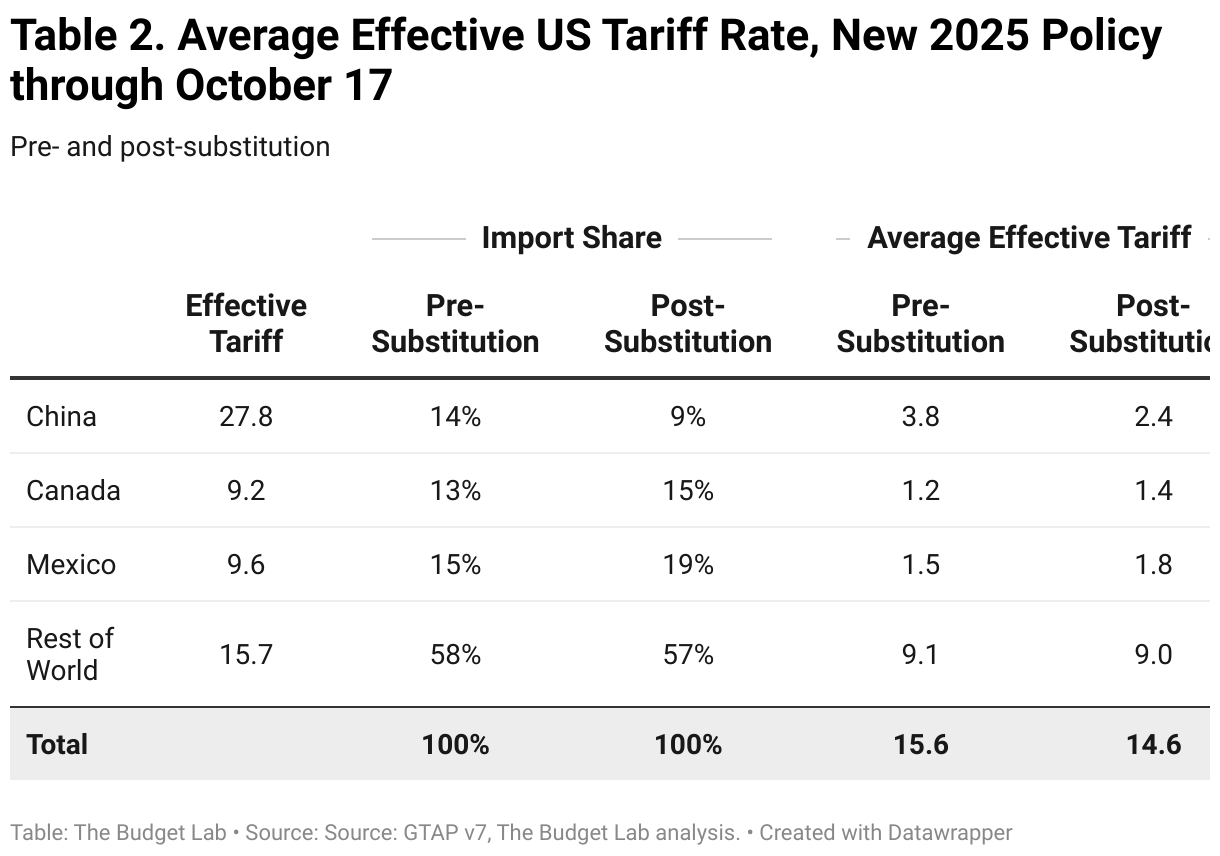
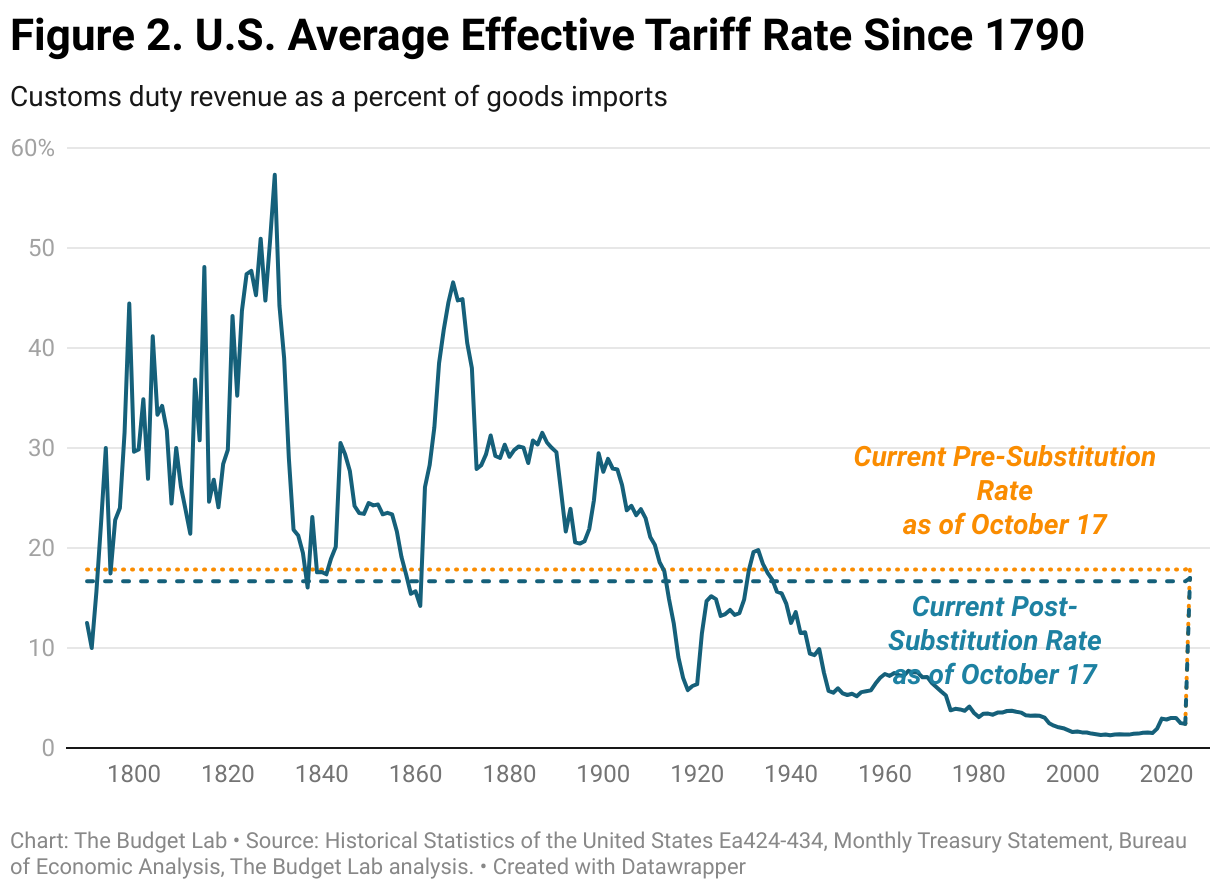
Current Tariff Rate: Consumers face an overall average effective tariff rate of 18.0%, the highest since 1934. After consumption shifts, the average tariff rate will be 17.0%, the highest since 1936.
-
Overall Price Level & Distributional Effects: The price level from all 2025 tariffs rises by 1.3% in the short-run, the equivalent of an average per household income loss of $1,800 in 2025$. This assumes the Federal Reserve does not react to tariffs and so the real income adjustment comes primarily through prices rather than nominal incomes; if the Federal Reserve reacted, the adjustment could in part come in the form of lower nominal incomes. Annual pre-substitution losses for households at the bottom of the income distribution are more than $1,000. The post-substitution price increase settles at 1.1%, a $1,500 loss per household.
-
Commodity Prices: The 2025 tariffs disproportionately affect metals, leather, and apparel products, with consumers facing price increases of between 28% and 40% in the short run. These prices stay about 10% to 14% higher in the long run.
-
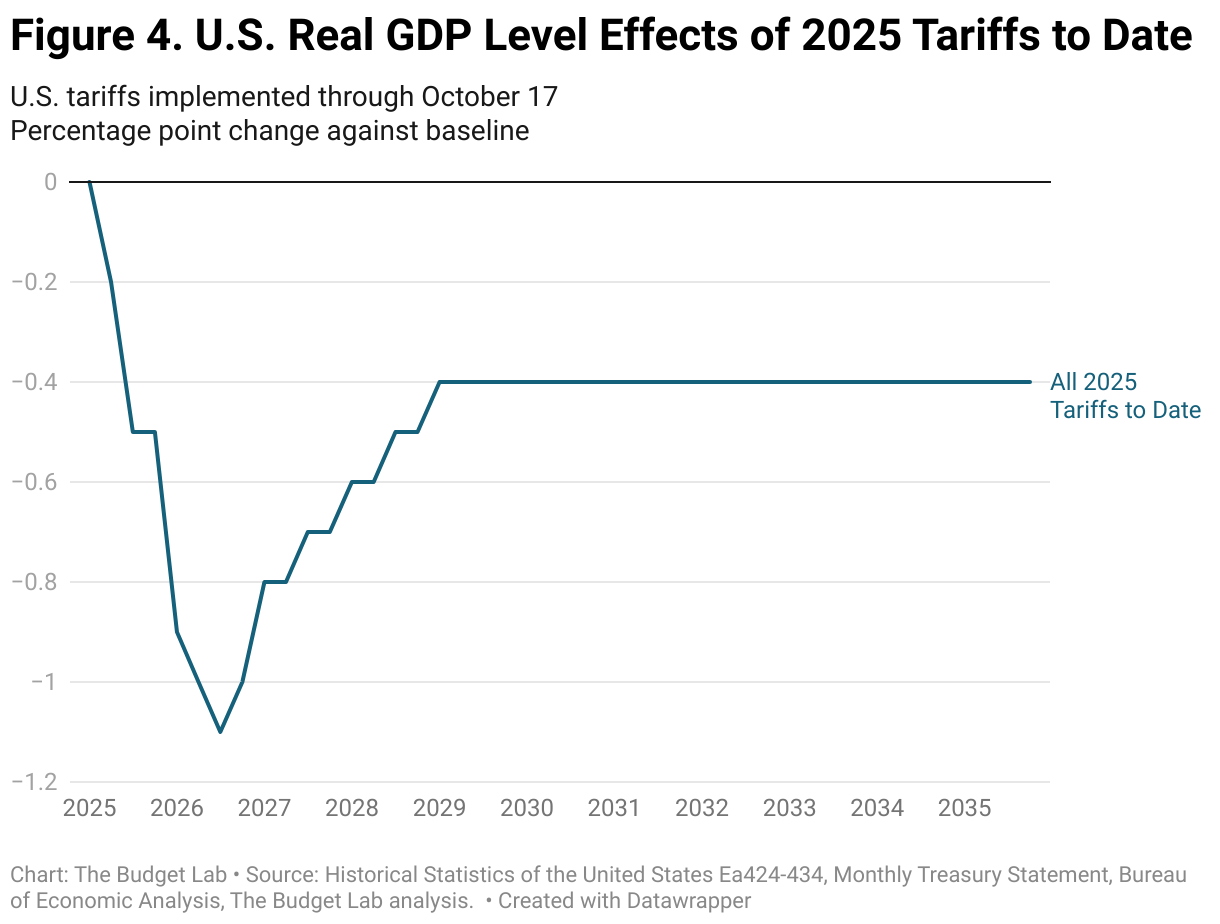
Real GDP Effects: US real GDP growth over 2025 and 2026 is about -0.5 pp lower each year owing to new 2025 tariffs. In the long run, the US economy is persistently -0.4% smaller, the equivalent of $125 billion annually in 2024$.
-
Labor Market Effects: The unemployment rate rises 0.3 percentage points by the end of 2025 and 0.7 percentage points by the end of 2026. Payroll employment is 490,000 lower by the end of 2025.
-
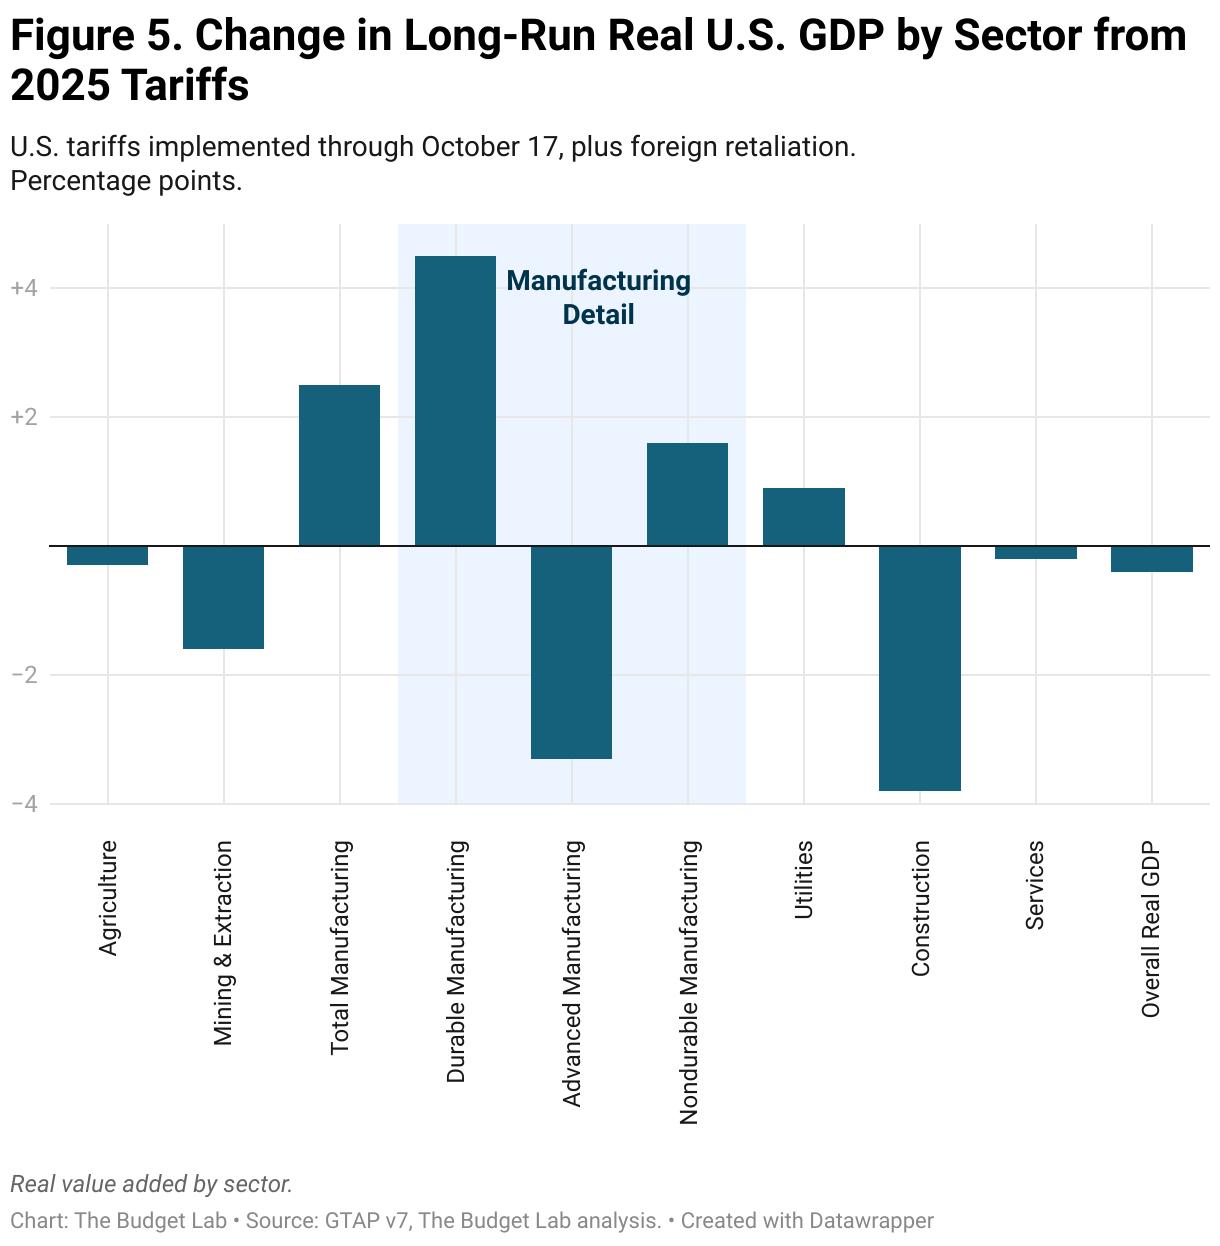
Long-Run Sectoral GDP & Employment Effects: In the long run, tariffs present a trade-off. US manufacturing output expands by 2.5%, but these gains are more than crowded out by other sectors: construction output contracts by 3.8% and agriculture declines by 0.3%.
-
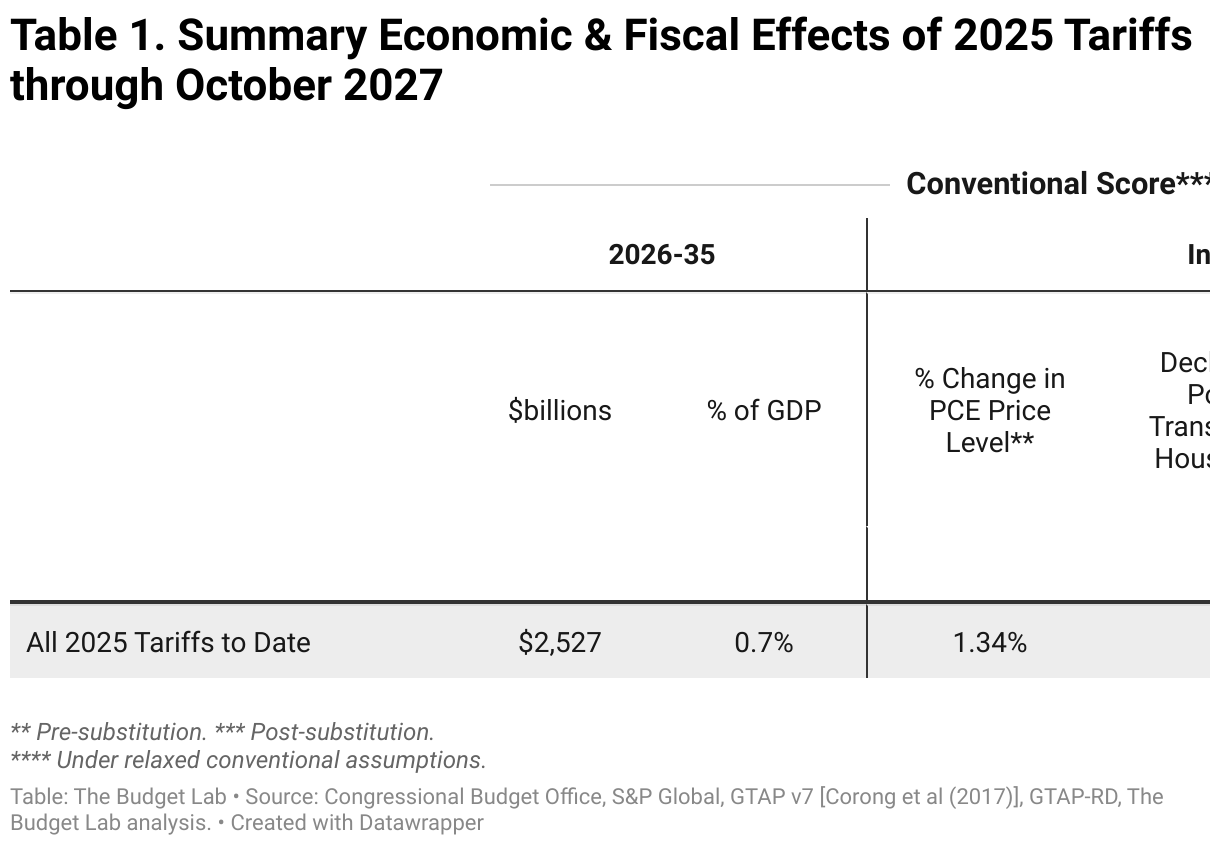
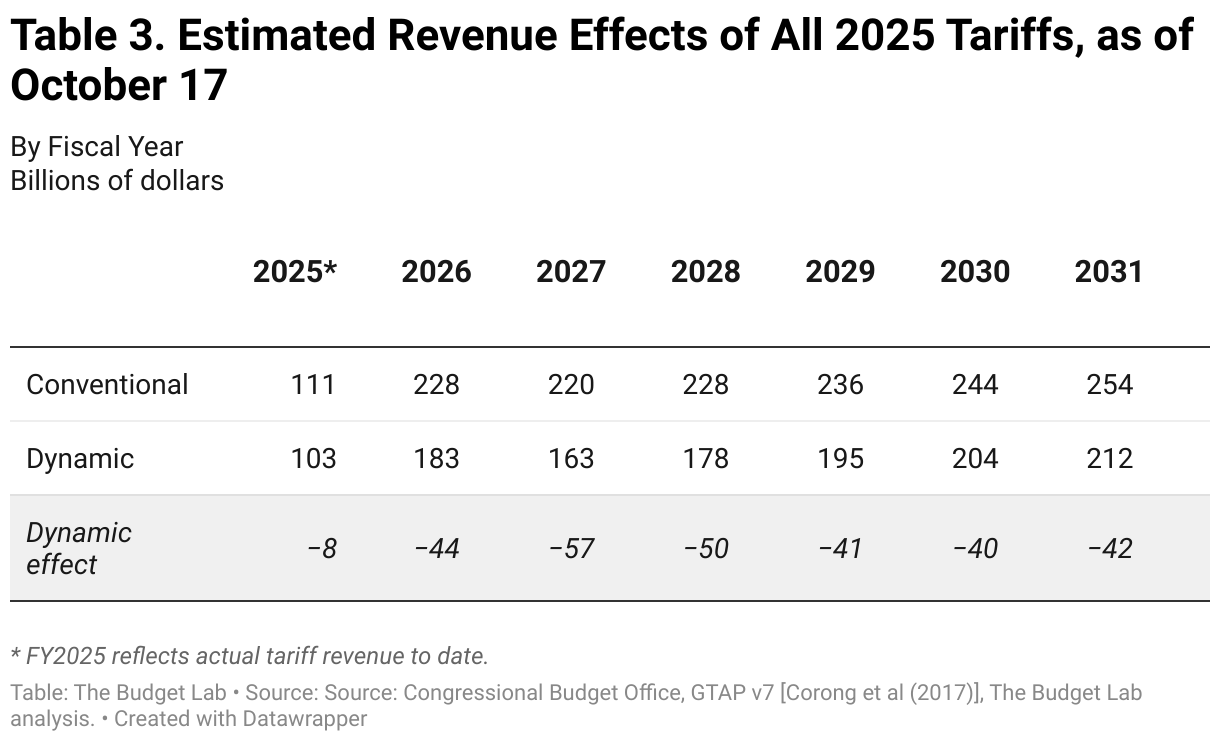
Fiscal Effects: All tariffs to date in 2025 raise about $2.5 trillion over 2026-35, though slower economic growth reduces revenues and brings the net dynamic revenue to $2.0 trillion.
Changes Since the Last Report
TBL has incorporated the following changes since the September 26 report:
New Economic Assumptions. TBL updated our model to more accurately capture exposure of domestic consumption to imports based on new 2024 input-output data from BEA, somewhat reducing the estimated consumer price impact of tariffs all else equal.
New Policy. TBL incorporated official Section 232 tariffs on softwood timber and lumber, based on newly available proclamations and annexes.
Refinements to Previously Reported Policy. Since the last update, TBL obtained additional information that necessitated several adjustments to reported tariff rates and scope:
- The previous report included tariffs on certain pharmaceuticals and heavy trucks announced by the President. However, these have not yet become effective policy; they remain threats or previews pending the conclusion of official Section 232 investigations. Consistent with TBL's "real-time current policy" baseline—where policy as it stands as of a date certain is assumed to continue in perpetuity—these tariffs have been removed from the analysis until they become effective.
- Cabinet and furniture tariffs were initially reported at 50% and 30% respectively, based on informal presidential announcements. Official proclamations revealed that current rates are 25% and 25%, scheduled to rise to 50% and 30% in January. Under our current policy methodology, this analysis reflects the 25%/25% rates in effect as of this report.
- The official proclamations also disclosed country-specific rates for cabinet and furniture products negotiated with the EU, UK, and Japan that were not previously public.
- TBL also refined its analysis of tariff interactions based on clarifications of how USMCA exemptions apply across different Section 232 tariffs. USMCA exceptions now apply only to Section 232 auto tariffs.
Results
The table below summarizes the effects of current tariff policy as of October 17, assuming it stays in force indefinitely.
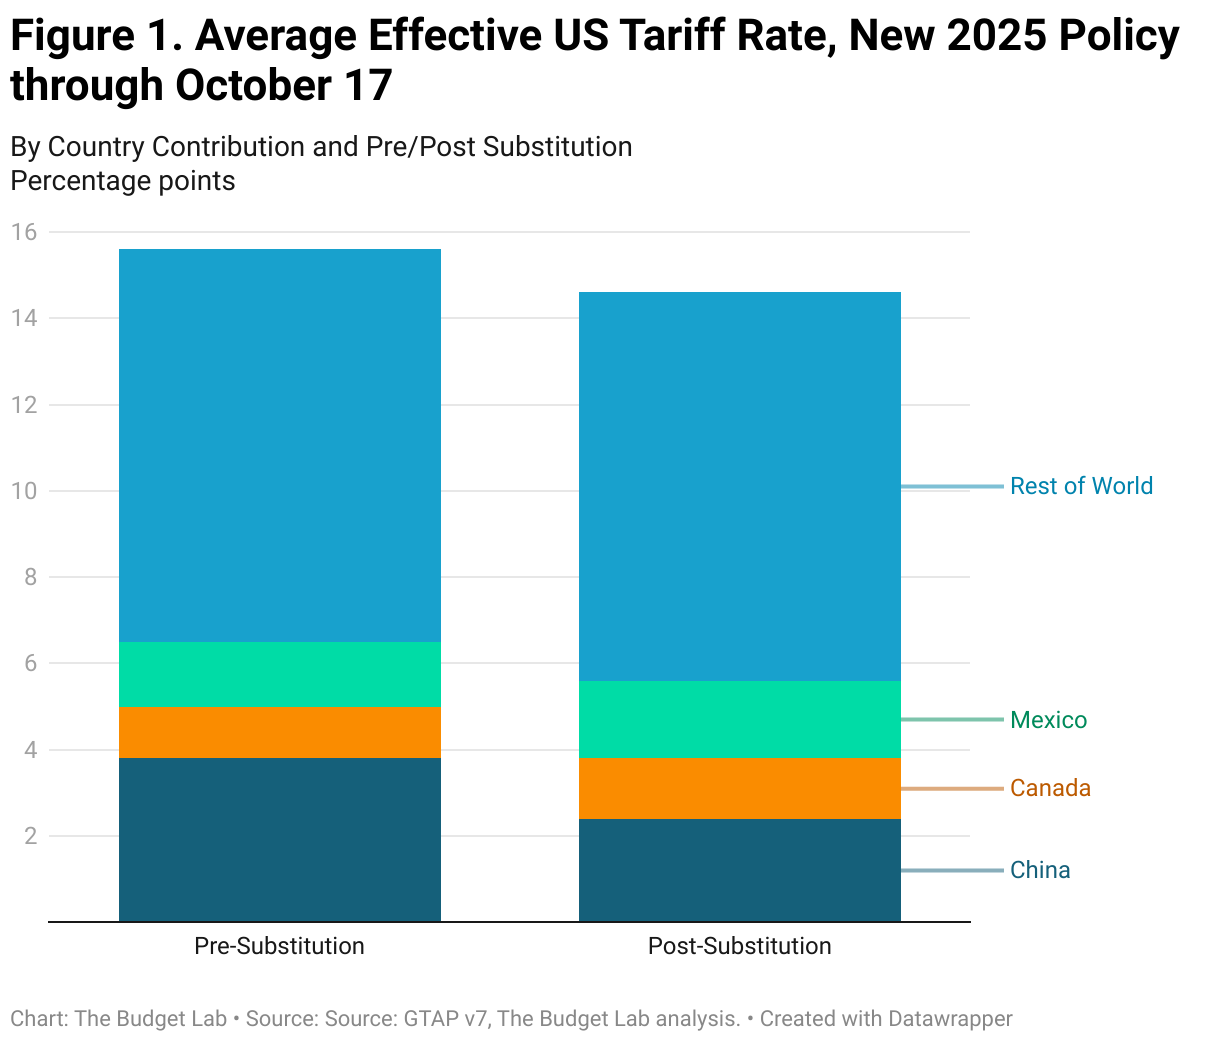
Average Effective Tariff Rate
The distinction between pre-substitution metrics (before consumers and businesses shift purchases in response to the tariffs) and post-substitution (after they shift) is a crucial one. One metric where the difference is meaningful is the average effective tariff rate.
Measured pre-substitution—assuming there are no shifts in the import shares of different countries—the 2025 tariffs to date are the equivalent of a 15.6 percentage point increase in the US average effective tariff rate. That calculation assumes that, for example, the share of imports from China remains at 14%, where it was in 2024. This is the right way to think about the tariffs from the perspective of consumer welfare, since it reflects the full cost faced by consumers before they start making difficult spending choices. This increase would bring the overall US average effective tariff rate to 18.0%, the highest since 1934.
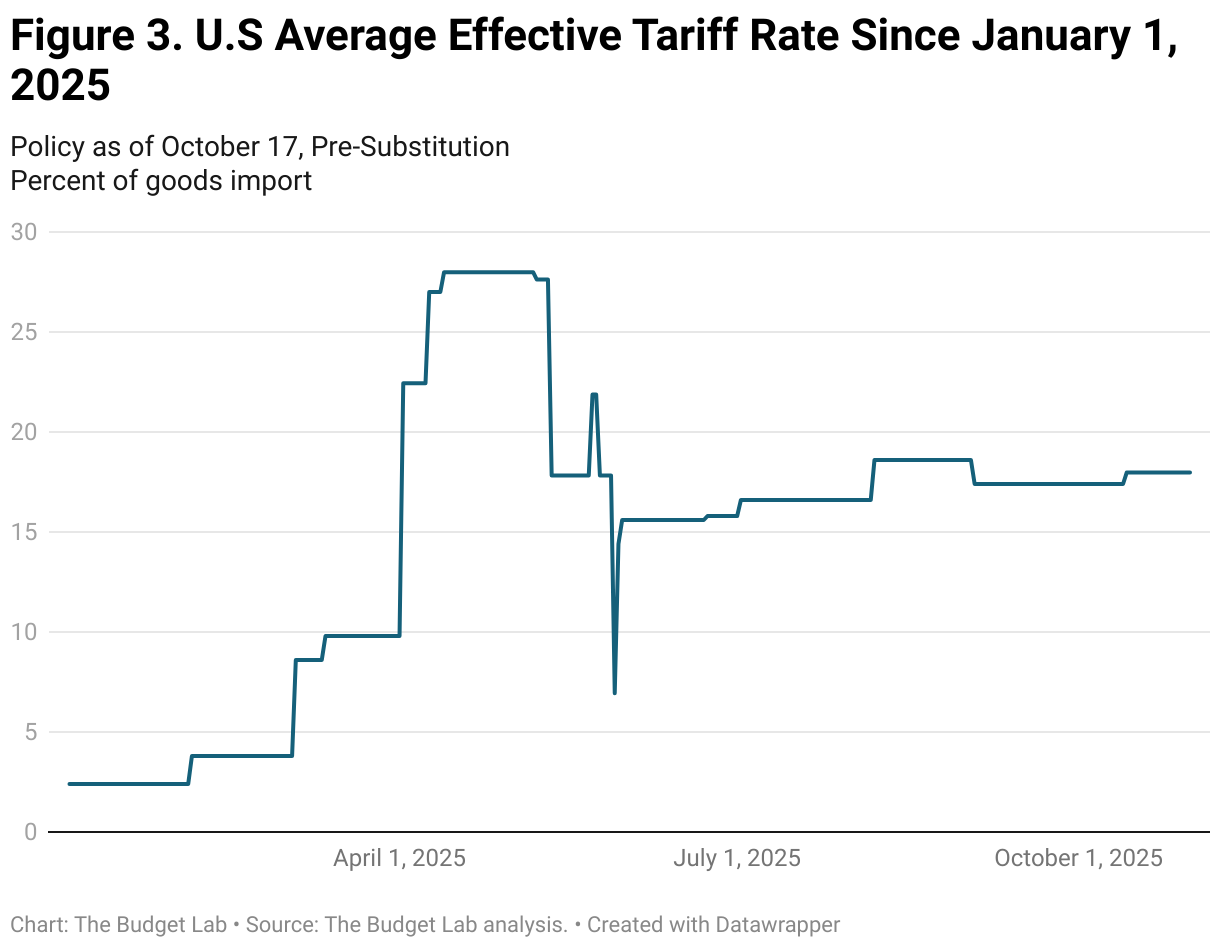
The effective tariff rate implied by policy has fluctuated substantially this year, starting at 2.4% in early January and peaking at 28% in the wake of the April 9 and 13 announcements.
Post-substitution—after imports shift in response to the tariffs—the 2025 tariffs are a 14.6 percentage point increase in the US average effective tariff rate, which brings the overall US effective tariff rate to 17.0%, the highest since 1936.
The timing of the transition from “pre” to “post” substitution is highly uncertain. Some shifts are likely to happen quickly—within days or weeks—while others may take longer.1
Average Aggregate Price Impact
The 2025 tariffs imply an increase in consumer prices of 1.3% in the short-run, assuming no policy reaction from the Federal Reserve and full passthrough of tariffs to consumers. As a result, TBL assumes the real income adjustment comes primarily through prices rather than nominal incomes. If the Federal Reserve reacted, the adjustment could in part come in the form of lower nominal incomes. This is a pre-substitution number that captures consumer welfare effects. It is the equivalent of a short-run income loss2 of about $1,800 per household on average in 2025 dollars. The post-substitution price increase settles at 1.1%, a $1,500 short-run loss per household.
US Real GDP & Labor Market Effects
All 2025 US tariffs plus foreign retaliation lower real GDP growth by -0.5 pp over calendar years 2025 and 2026. The unemployment rate ends 2025 0.3 percentage point higher and 2026 0.7 percentage point higher, and payroll employment is 490,000 lower by the end of 2025. The level of real GDP remains persistently -0.4% smaller in the long run, the equivalent of $125 billion 2024$ annually, while exports are -15% lower.
Long-run US Sectoral Output & Employment Effects
Tariffs shrink the overall size of the US economy in the long-run by 0.4%, but beneath aggregate GDP they also drive reallocation across US sectors. Long-run output in the manufacturing sector expands by 2.5% under the tariffs, with nonadvanced durable manufacturing output 4.5% larger and nondurable manufacturing 1.6% larger. However, advanced manufacturing is down by 3.3%. Moreover, the expansion of the overall manufacturing sector more than crowds out the rest of the economy: construction contracts by 3.8%, agriculture by 0.3%, and mining & extraction by 1.6%.
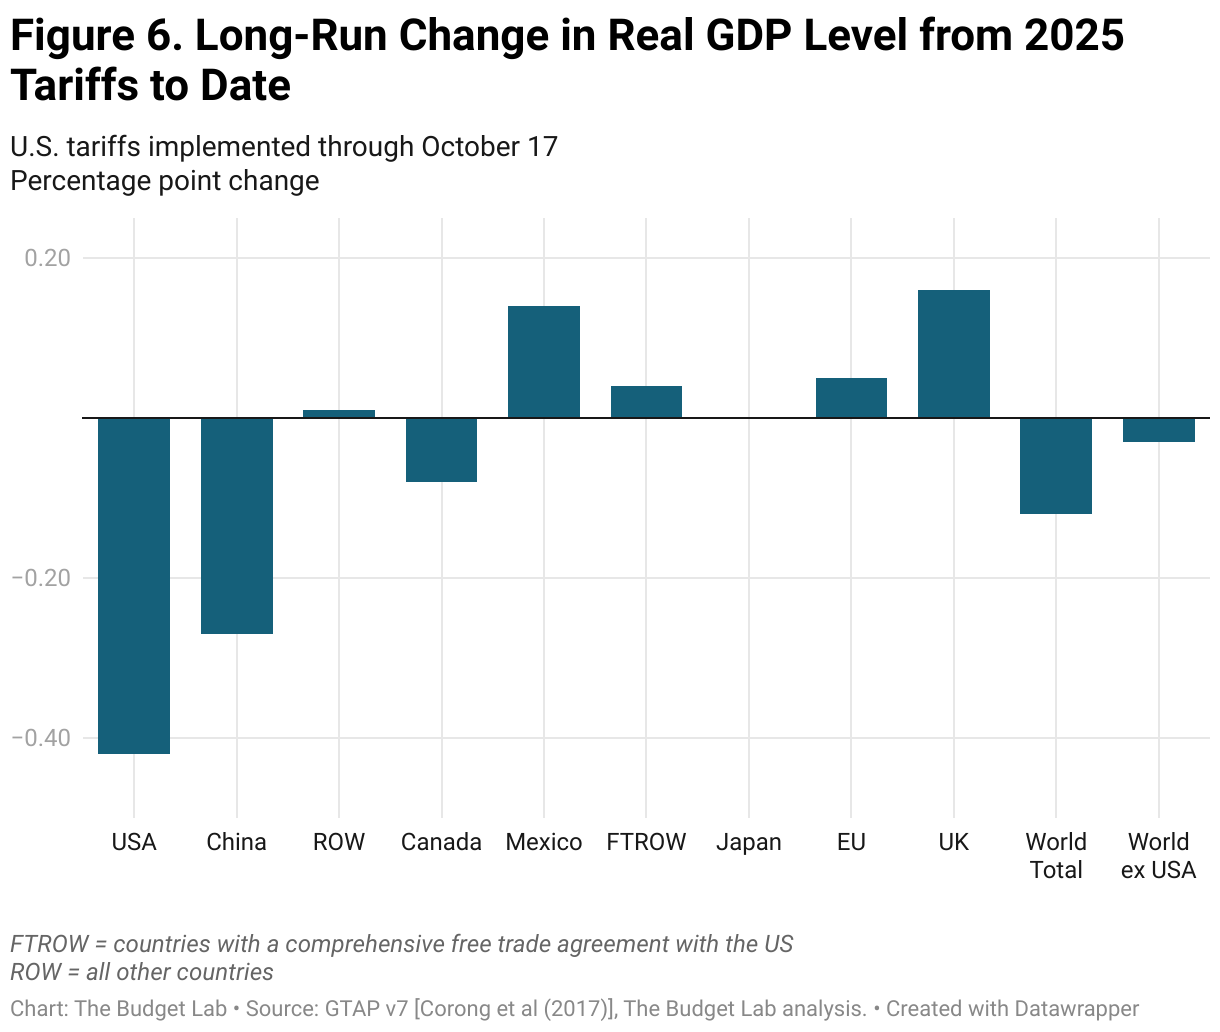
Global Long-run Real GDP Effects
Mexico is the biggest winner from the 2025 tariffs to date, with its economy about 0.1% larger in the long-run. Canada’s economy is 0.1% smaller in real terms. China’s economy is -0.3% smaller, roughly two thirds as large as the hit to the US. The EU’s economy is 0.05 percentage point larger in the long-run, while the UK’s is almost 0.2% bigger thanks in part to the benefits of the US-UK trade deal.
Fiscal Impact & Historical Context
The 2025 tariffs to date, were they to remain in place, would raise more than $2.5 trillion over 2026-35 conventionally-scored ($2.3 trillion over 2025-34).3, 4 Given the negative output effects of the tariffs, these new revenues will be partially offset by reductions in tax revenue as a result of lower growth. Based on Congressional Budget Office rules-of-thumb, TBL estimates that these effects would more than -$4 billion over the decade about $.1 trillion ($1.9 trillion over 2025-34).
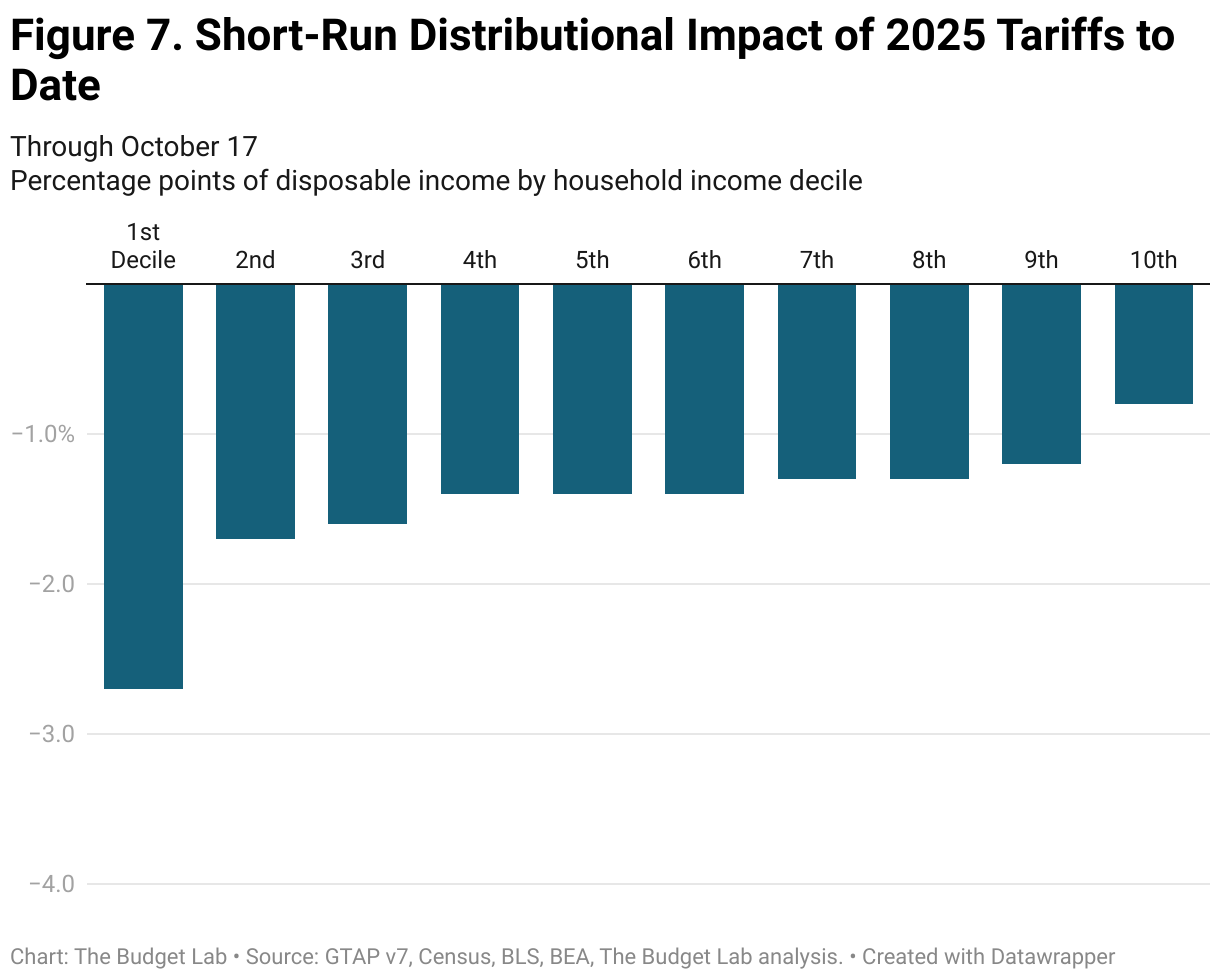
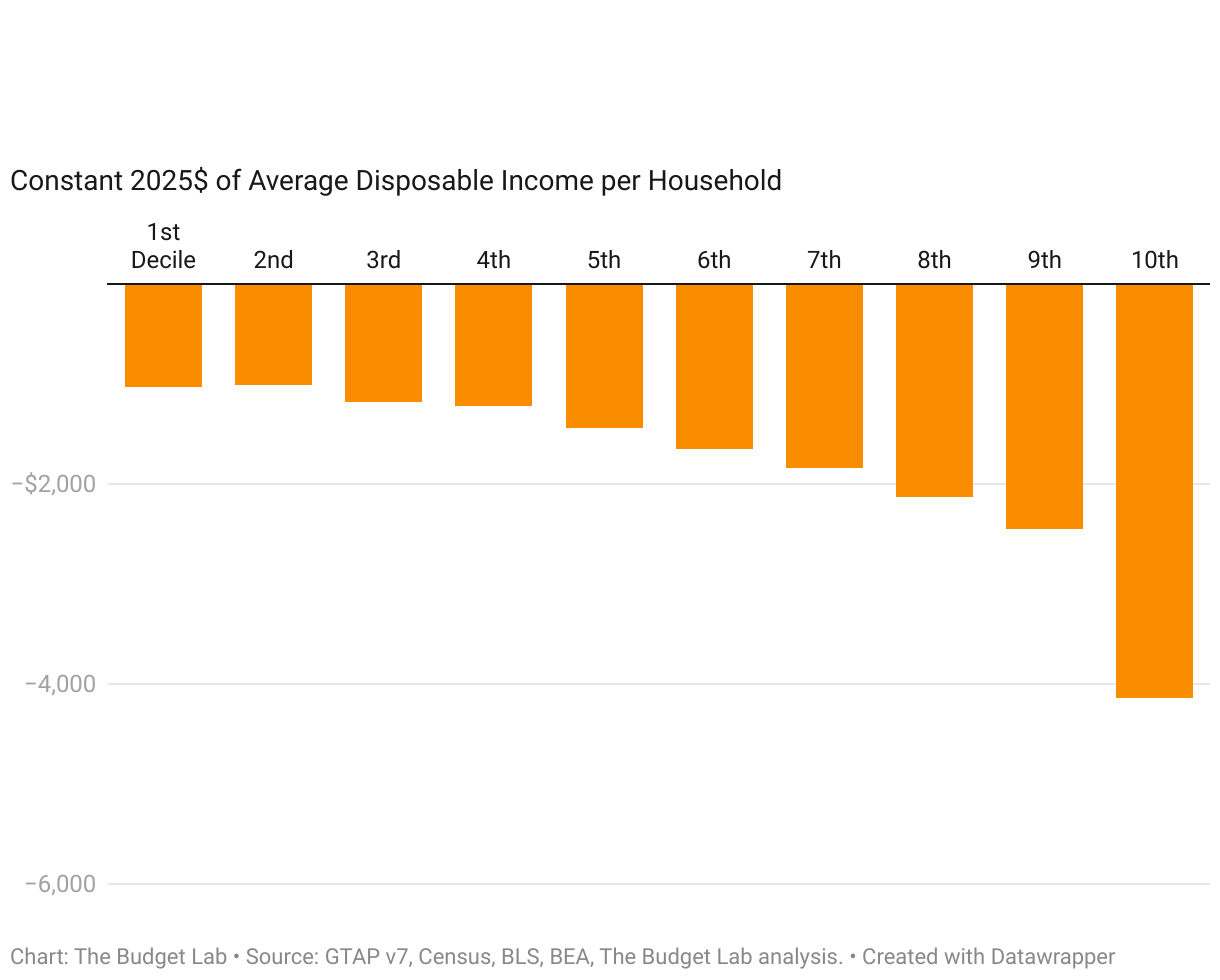
Short-run Distributional Impact
One way to measure the distributional burden of tariffs is to look at the relationship between consumption, which gets more expensive under tariffs, and income for a given year. Under this view, tariffs are a regressive tax, since lower-income households spend a larger fraction of their income than higher-income households do, on average.
TBL finds that the short-run burden on the first decile is more than three times that of the top decile (-2.7% versus -0.8%). The average annual cost to households in the first and top decile rise to $1,000 and $4,100 respectively in 2025$. The median cost is about $1,500 per household.
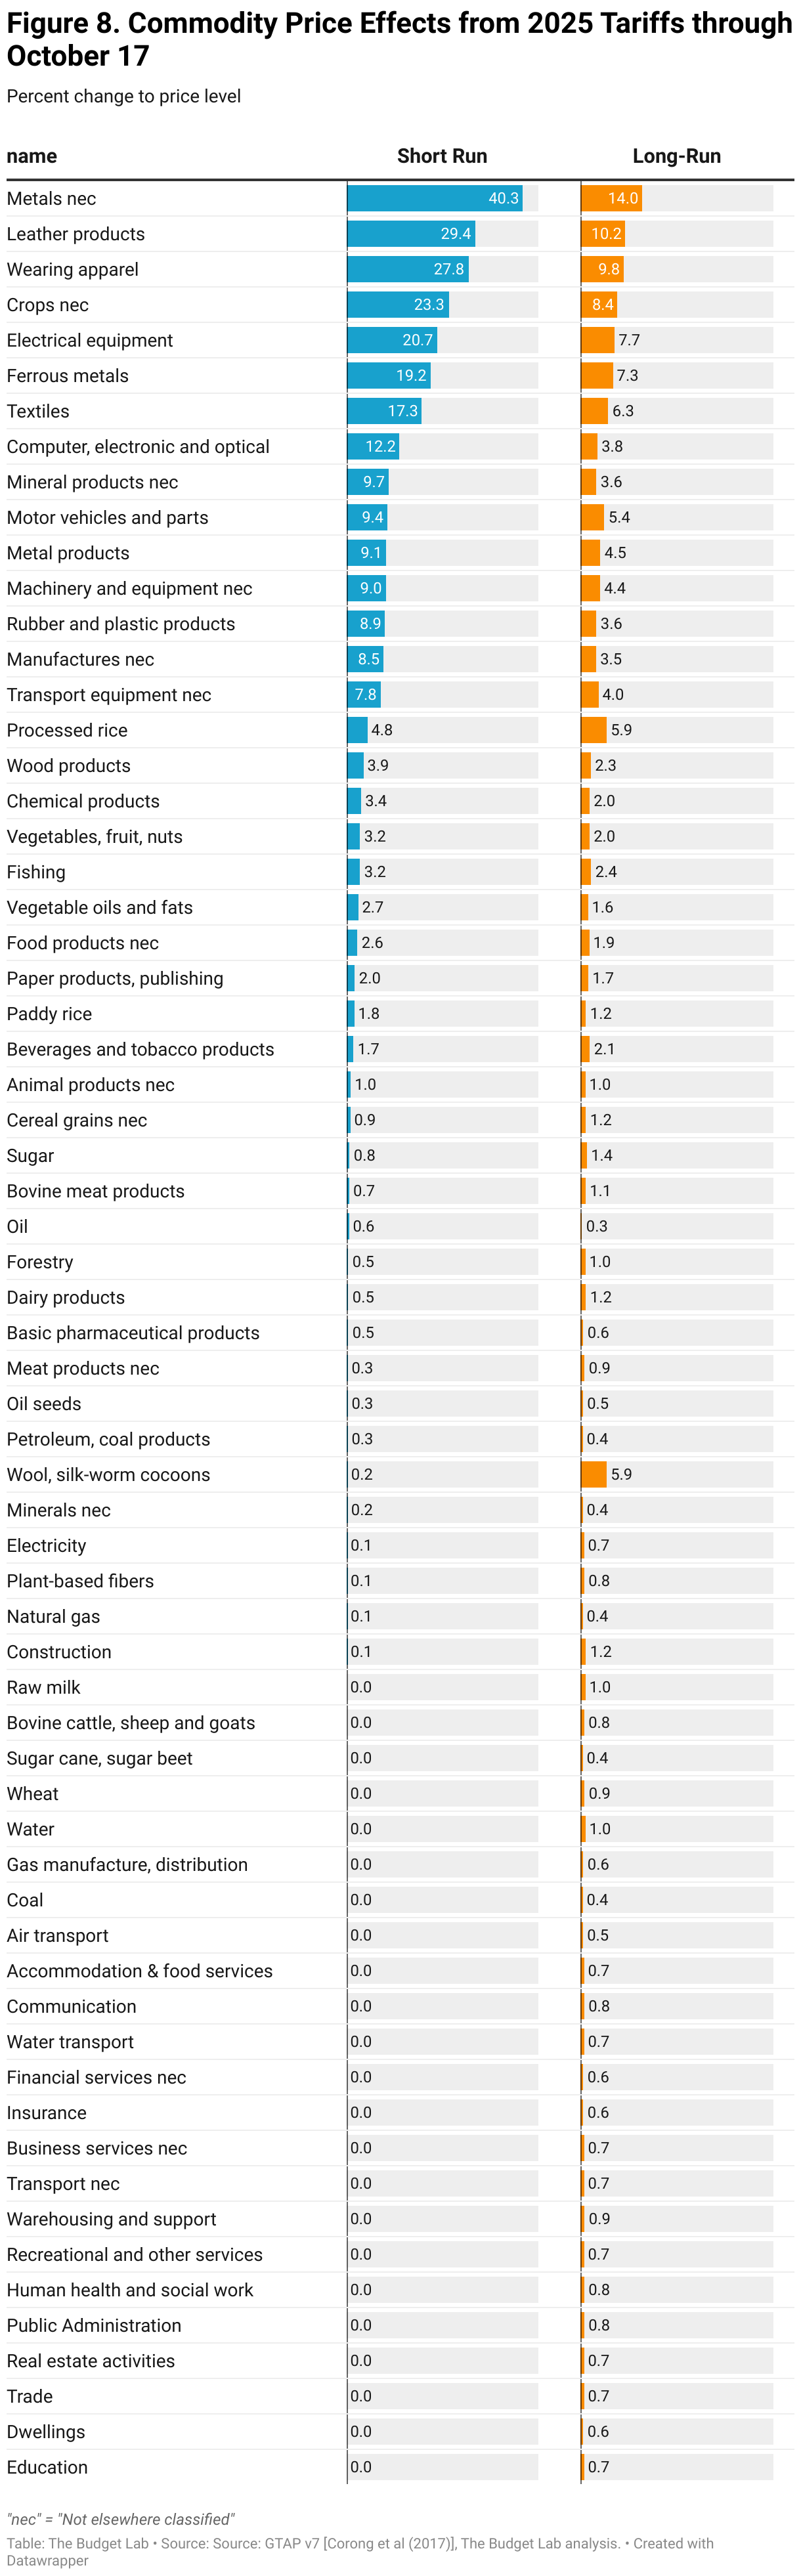
Commodity Price Effects
The charts below show how the 1.3% price level increase from the 2025 tariffs to date would look across individual commodities in the short-run (pre-substitution), as well as the 1.1% long-run price increase (post-substitution). Some high level takeaways:
- Metal imports are a central target of recent tariffs. Depending on the type of metal, short-run prices impacts range from 9% to 40%. In the longe run, this range is 5% to 14%. Consumers face particularly high increases in leather and clothing in the short run: prices increase 29% for leather products (shoes and hand bags), 28% for apparel, and 17% for textiles. After substitution and global supply shifts in the long run, prices remain 10%, 10%, and 6% higher, respectively.
- Food prices rise 2.0% in the short run and stay 1.8% higher in the long run.
- Motor vehicle prices rise 9% in the short run and 5% in the long run, the equivalent of an additional $4,500 and $2,600 respectively to the price of an average 2024 new car.
Footnotes
- 1
TBL assumes throughout its tariff analysis that the transition to longer-run GTAP equilibria occurs after three years.
- 2
TBL defines “income” as CBO-concept post-tax-and-transfer income. “Short-run” refers to the effect over the next couple of years; TBL proxies for this definition by using CBO projections of the distribution of income in 2027, expressed in 2025 dollars.
- 3
TBL employs a “relaxed conventional” assumption for the retaliation scenario, whereby foreign income is permitted to fall but US income remains fixed.
- 4
The Congressional Budget Office has projected that tariff policy in place as of August 19 reduces primary (non-interest) deficits by $3.3 trillion over 2025-35. On a like-for-like policy basis, the differences between CBO’s and TBL’s estimates can be entirely explained by three factors: 1) CBO quotes the fiscal effects of tariffs on an 11-year basis (2025-35), while TBL quotes the effects on a 10-year basis (2026-35); 2) CBO does not adjust its estimates for non-compliance, while TBL reduces its first stage revenue estimates by 10% to account for additional non-compliance not captured in underlying trade elasticities; and, 3) CBO and TBL have different estimates of the average effective US tariff rate: in its August 22 report, CBO calculated that the average tariff rate was 18 percentage points higher due to new 2025 tariffs, while TBL, in its September 4 report, calculated the rate was 15 percentage points higher.