
State of U.S. Tariffs: September 26, 2025
Key Takeaways
-
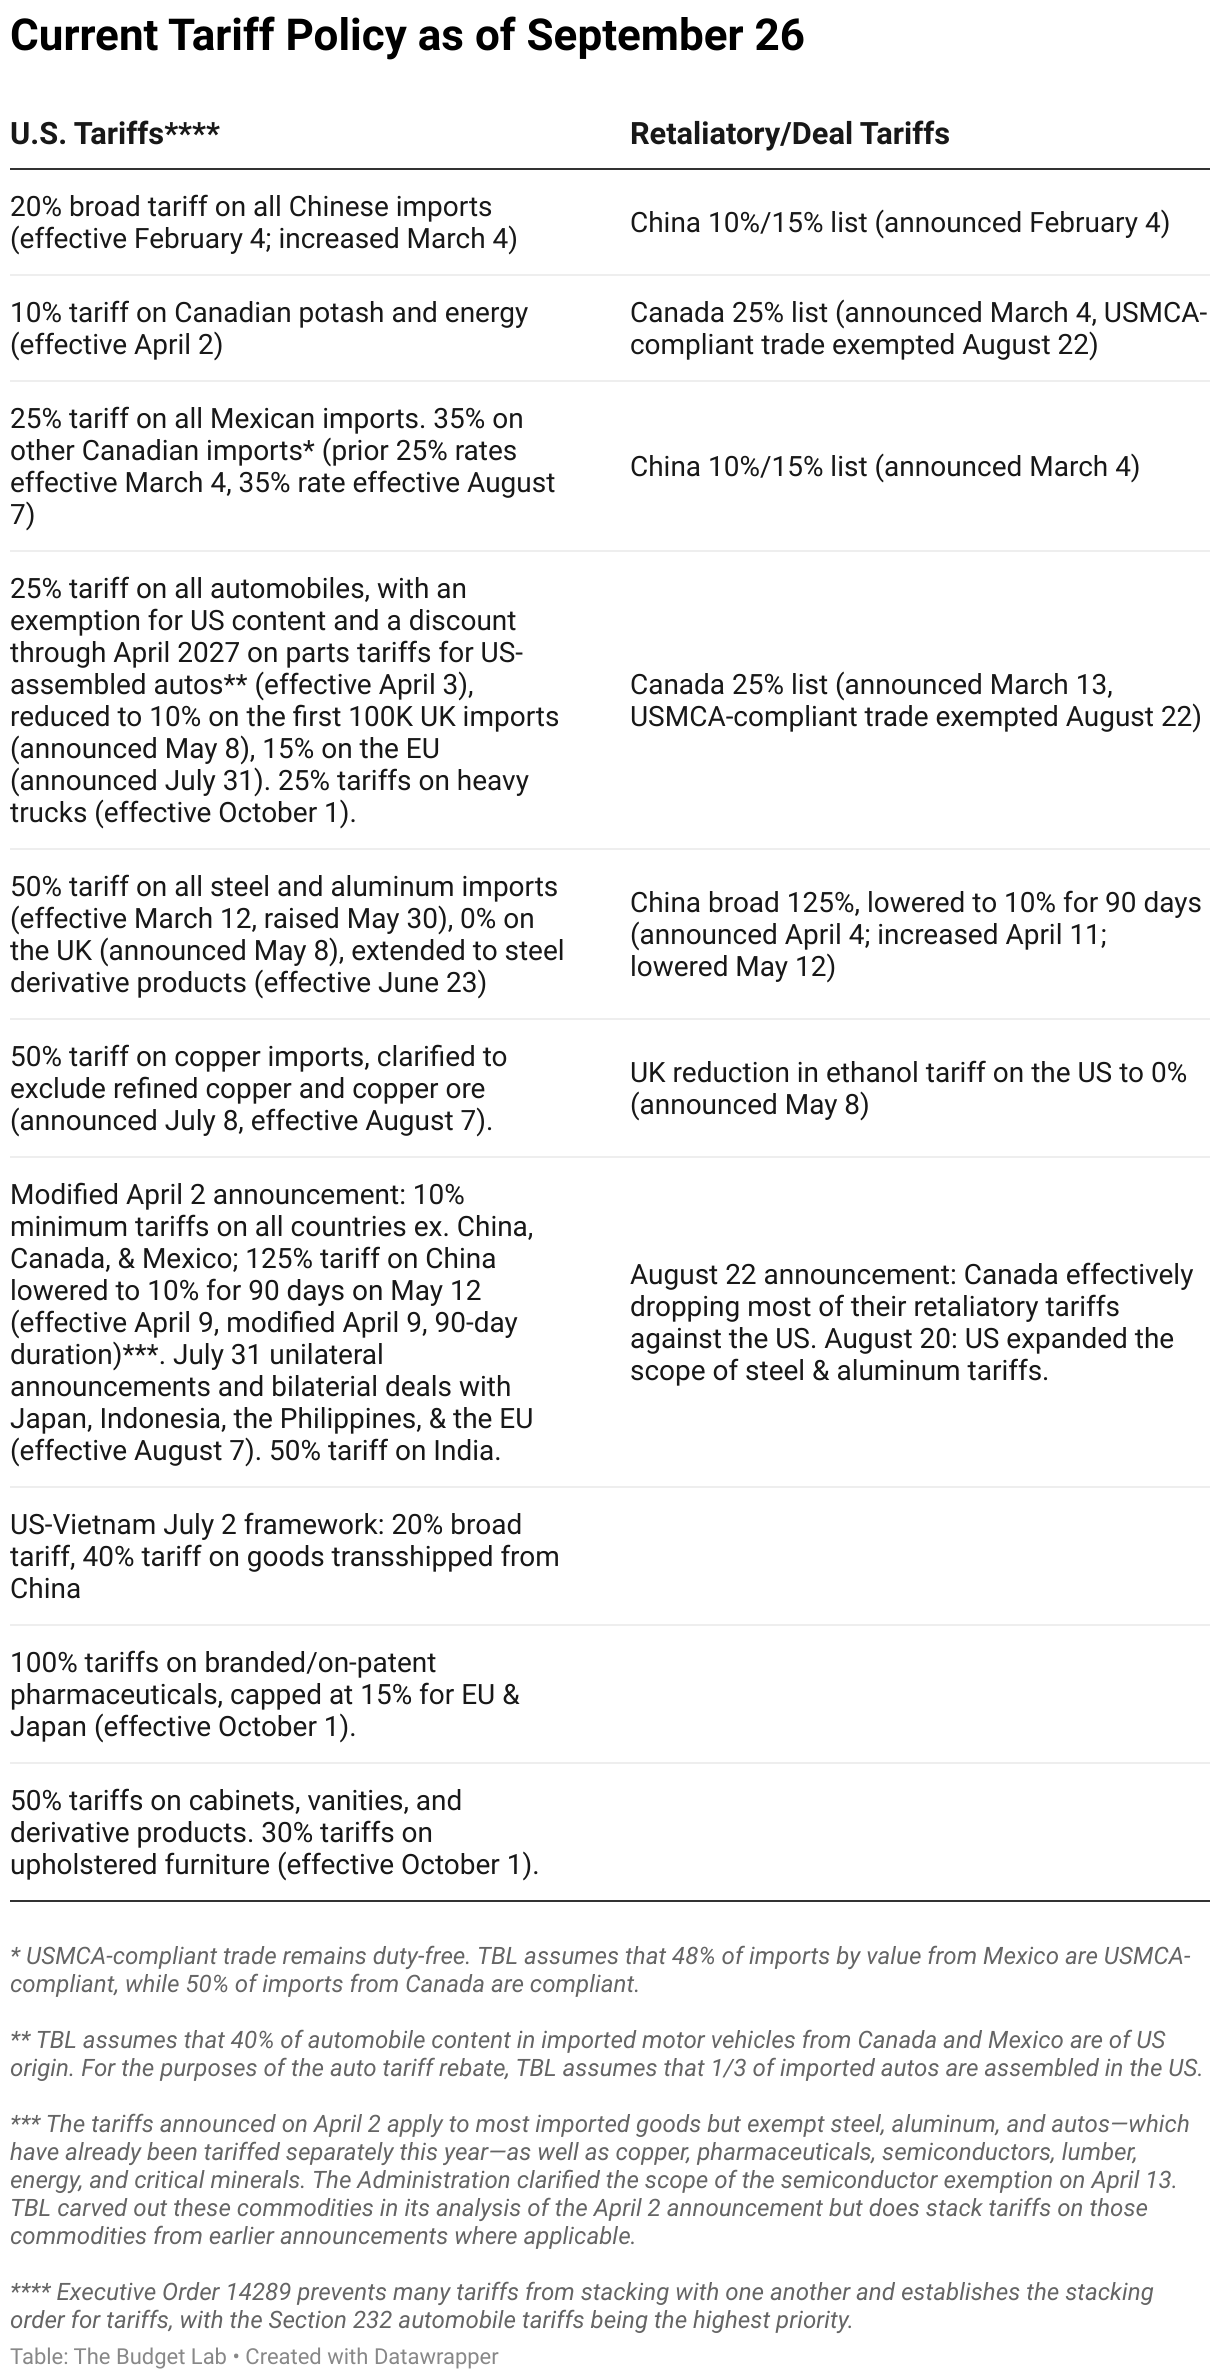
The Budget Lab (TBL) estimated the effects all US tariffs and foreign retaliation implemented in 2025 through September 26, including the pharmaceutical, furniture, and heavy truck tariffs announced by President Trump beginning October 1. TBL assumes that these tariff policies remain in effect in perpetuity.
-
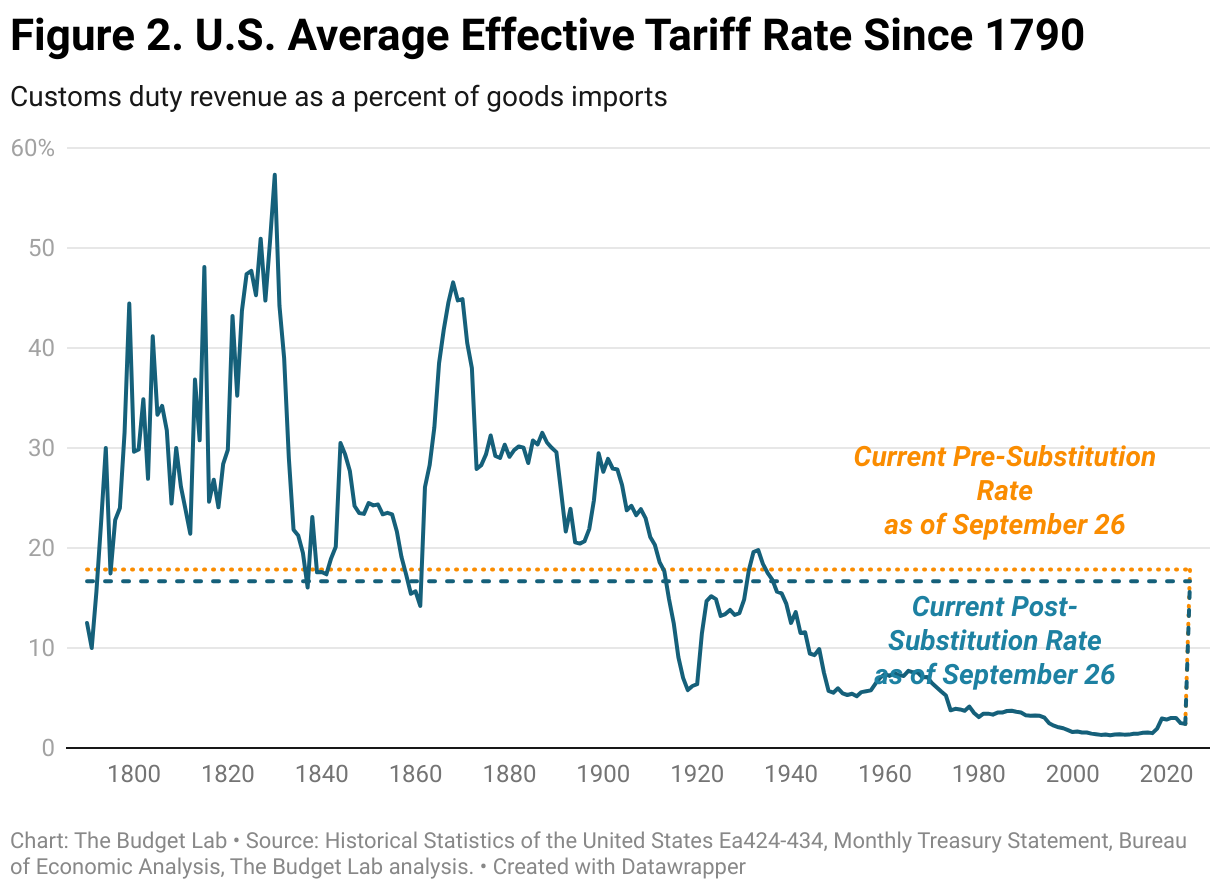
Current Tariff Rate: Consumers face an overall average effective tariff rate of 17.9%, the highest since 1934. After consumption shifts, the average tariff rate will be 16.7%, the highest since 1936.
-
Overall Price Level & Distributional Effects: The price level from all 2025 tariffs rises by 1.7% in the short-run, the equivalent of an average per household income loss of $2,400 in 2025$. This assumes the Federal Reserve does not react to tariffs and so the real income adjustment comes primarily through prices rather than nominal incomes; if the Federal Reserve reacted, the adjustment could in part come in the form of lower nominal incomes. Annual pre-substitution losses for households at the bottom of the income distribution are $1,350. The post-substitution price increase settles at 1.4%, a $1,900 loss per household.
-
Commodity Prices: The 2025 tariffs disproportionately affect leather products, with consumers facing 36% higher prices and 34% higher apparel prices in the short-run. Leather and apparel prices stay 12% and 11% higher in the long-run respectively.
-
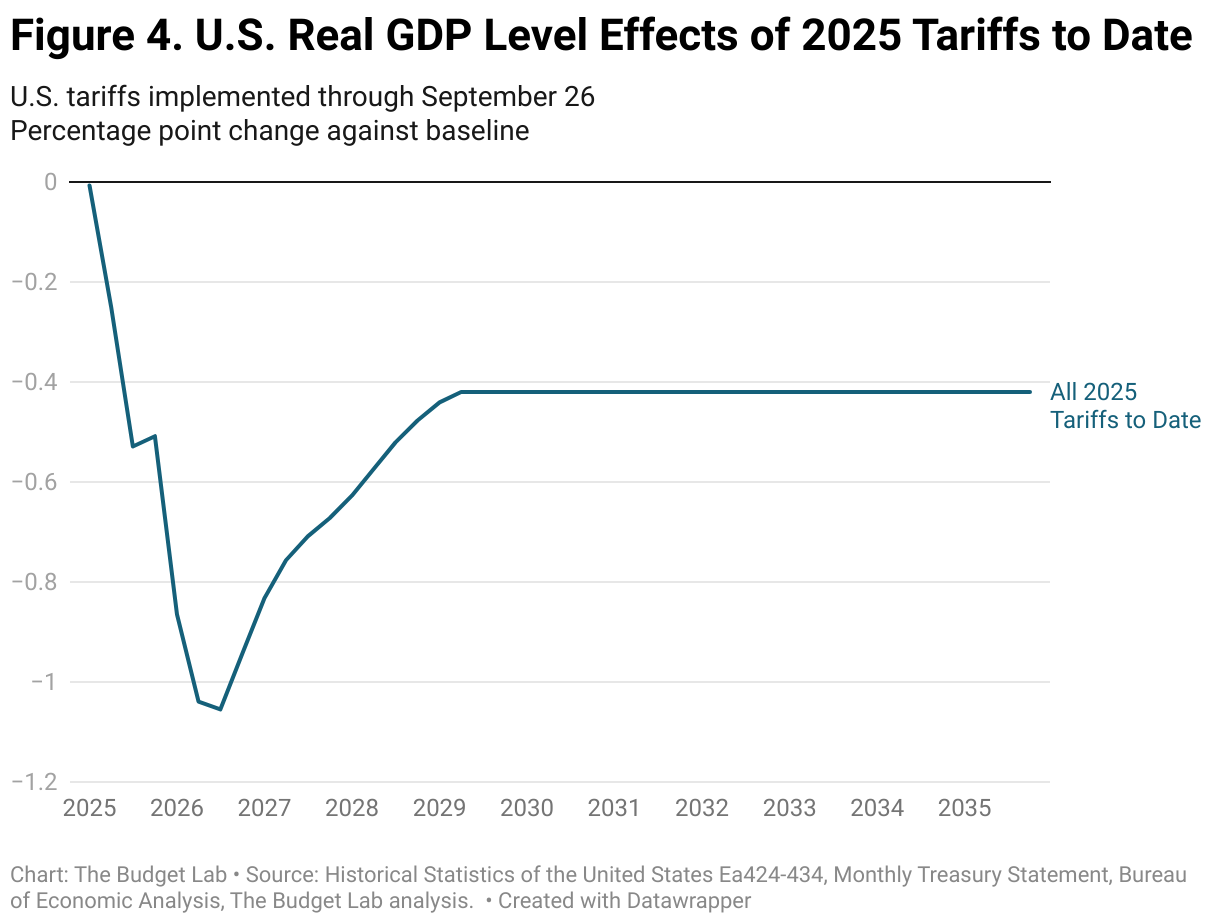
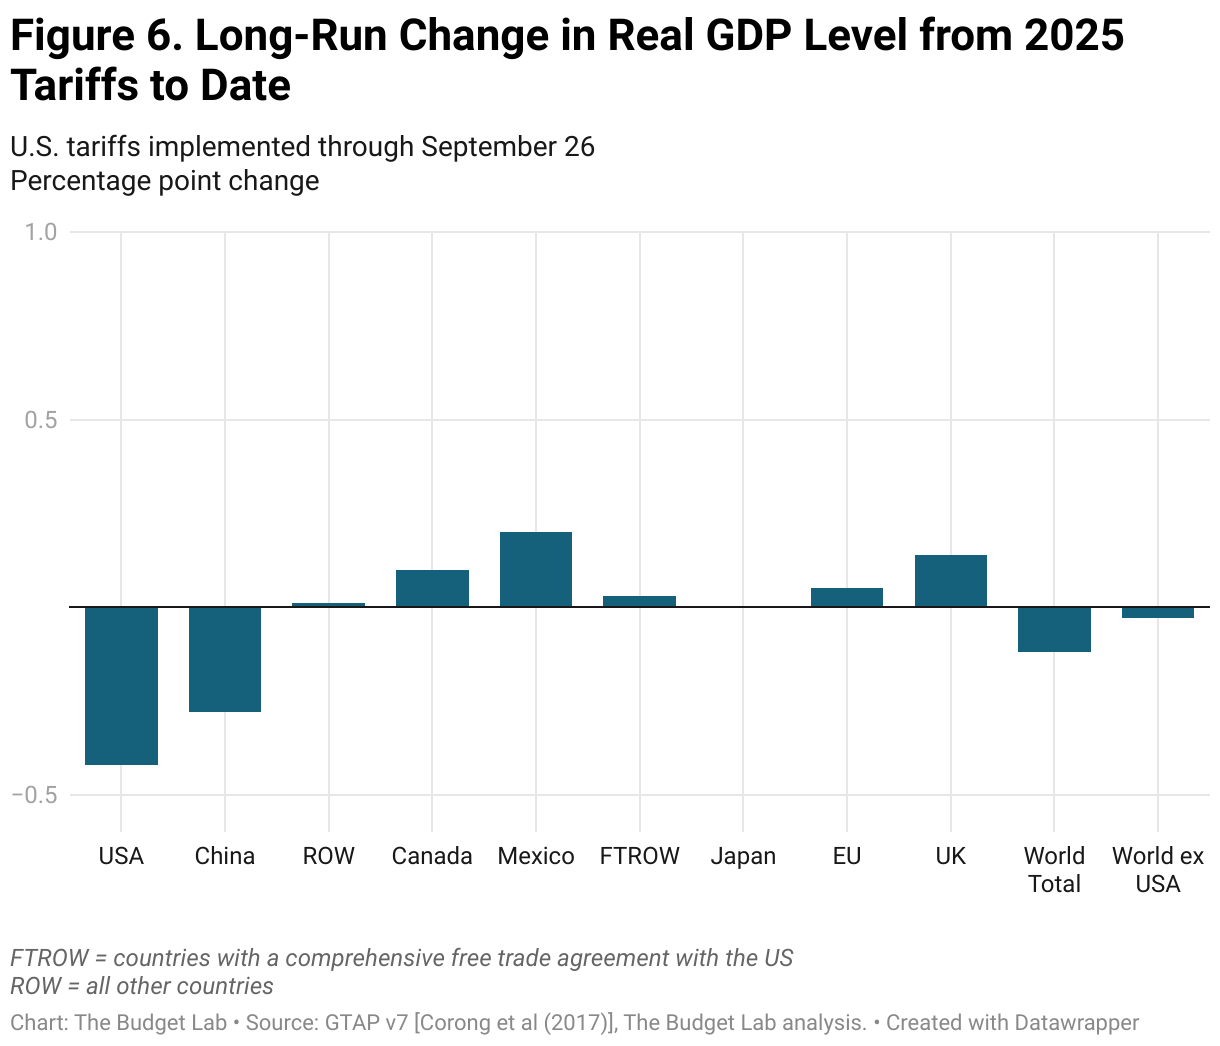
Real GDP Effects: US real GDP growth over 2025 is -0.5 pp lower, and -0.4 pp lower over 2026, from all new 2025 tariffs. In the long-run, the US economy is persistently -0.4% smaller, the equivalent of $125 billion annually in 2024$.
-
Labor Market Effects: The unemployment rate rises 0.3 percentage points by the end of 2025 and 0.7 percentage points by the end of 2026. Payroll employment is 490,000 lower by the end of 2025.
-
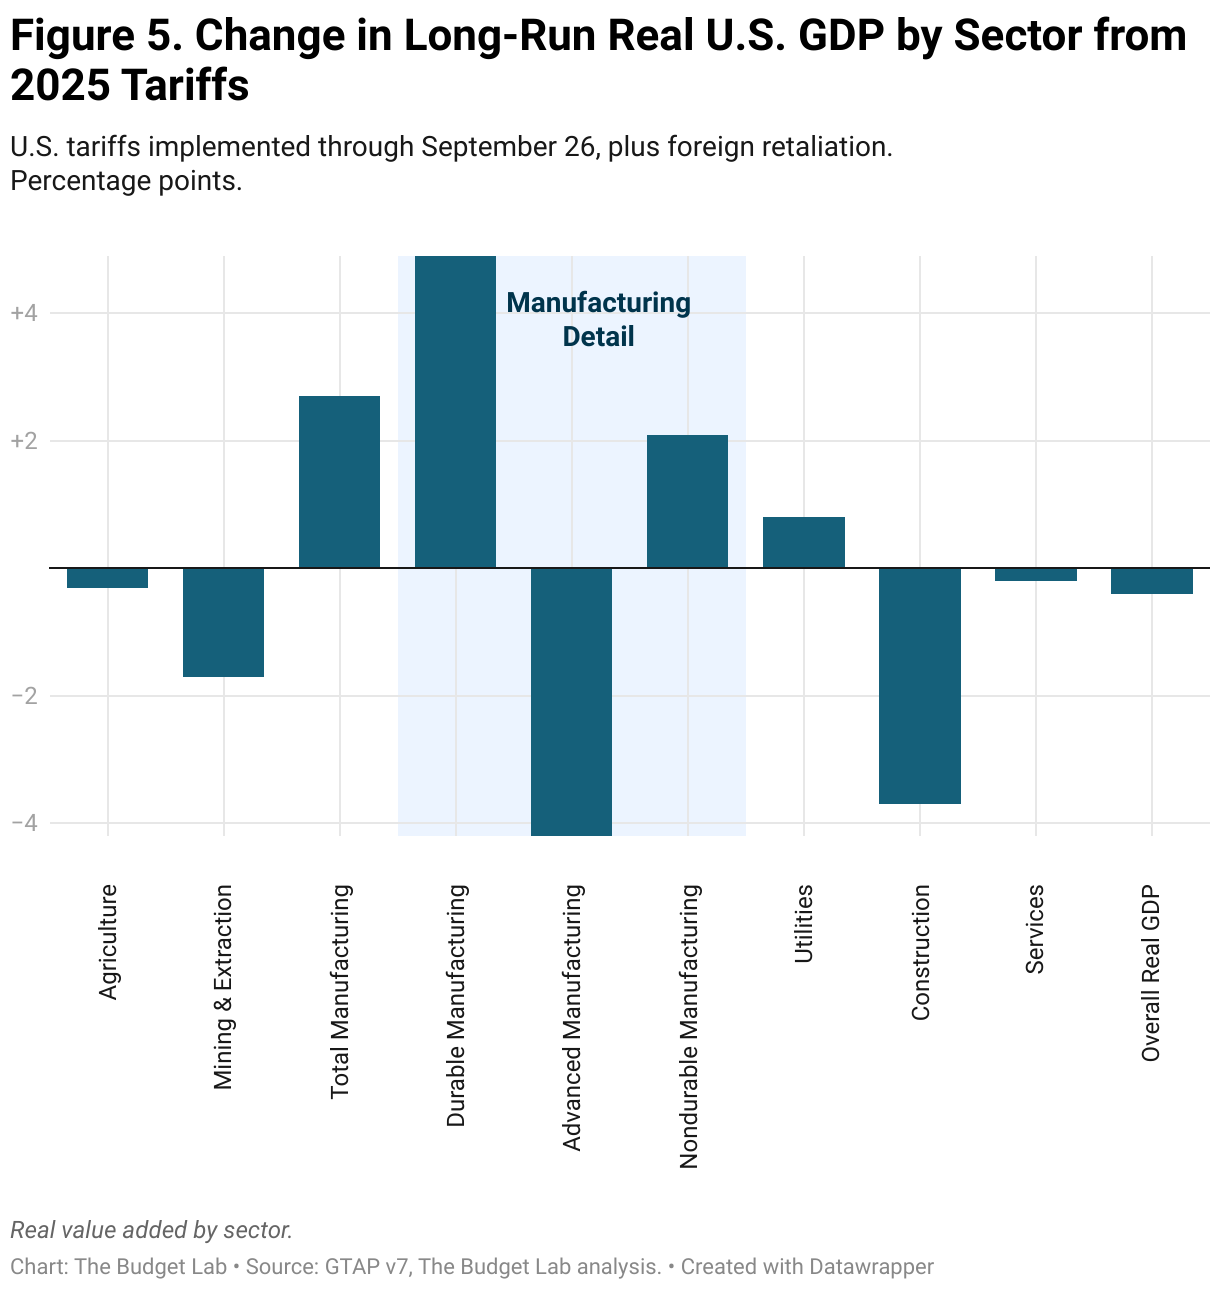
Long-Run Sectoral GDP & Employment Effects: In the long-run, tariffs present a trade-off. US manufacturing output expands by 2.7%, but these gains are more than crowded out by other sectors: construction output contracts by 3.7% and agriculture declines by 0.3%.
-
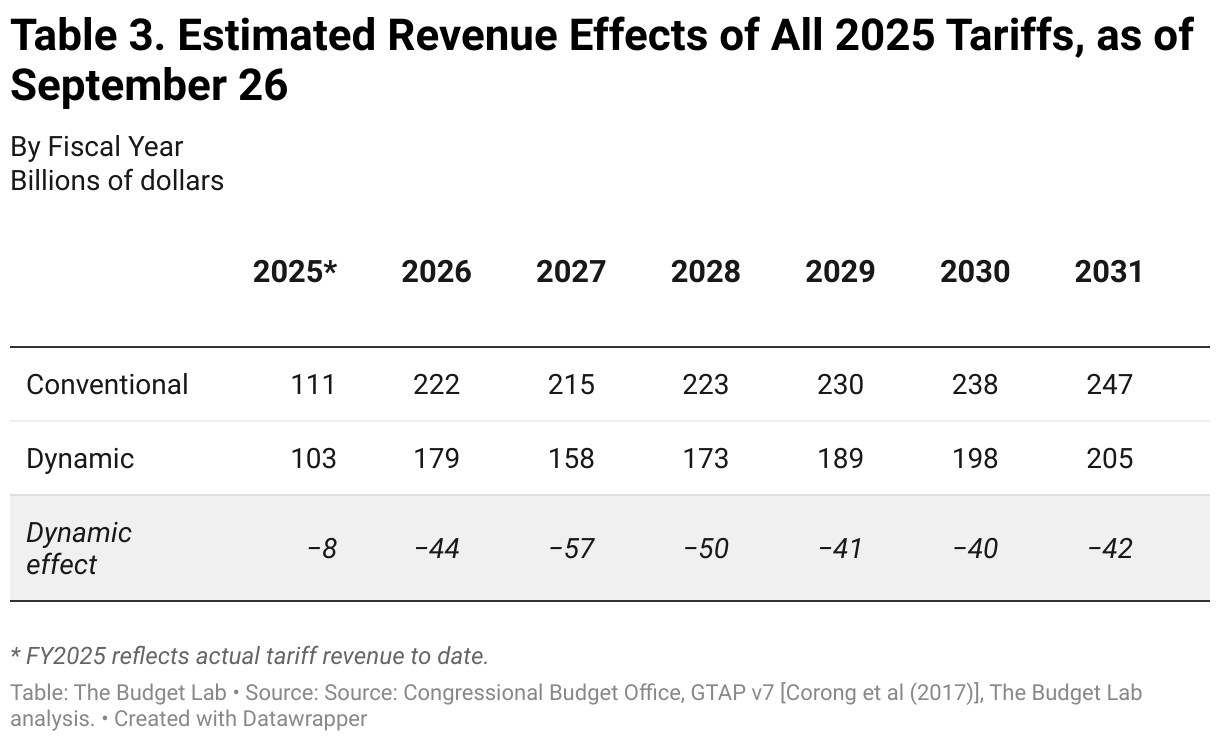
Fiscal Effects: All tariffs to date in 2025 raise $2.5 trillion over 2026-35, with $469 billion in negative dynamic revenue effects, bringing dynamic revenues to $2.0 trillion.
Changes Since the Last Report
TBL has incorporated the following policy changes since the September 4 report:
- On September 25, President Trump made the following announcements on social media:
- A 100% tariff on branded/on-patent pharmaceuticals;
- A 50% tariff on kitchen cabinets, bathroom vanities, and “associated products;”
- A 30% tariff on upholstered furniture; and,
- A 25% tariff on heavy trucks.
Although not stated explicitly by the president, TBL assumes that for all four of these changes, the Administration is claiming authority under Section 232 of the Trade Expansion Act of 1962. As a consequence, TBL further assumes that these new 232 tariffs do not “stack” with tariffs under other authorities like IEEPA.1
TBL analyzes tariffs on a “real-time current policy” basis, where policy as it stands as of date certain is assumed to continue in perpetuity, even if framed as a temporary policy.
Results
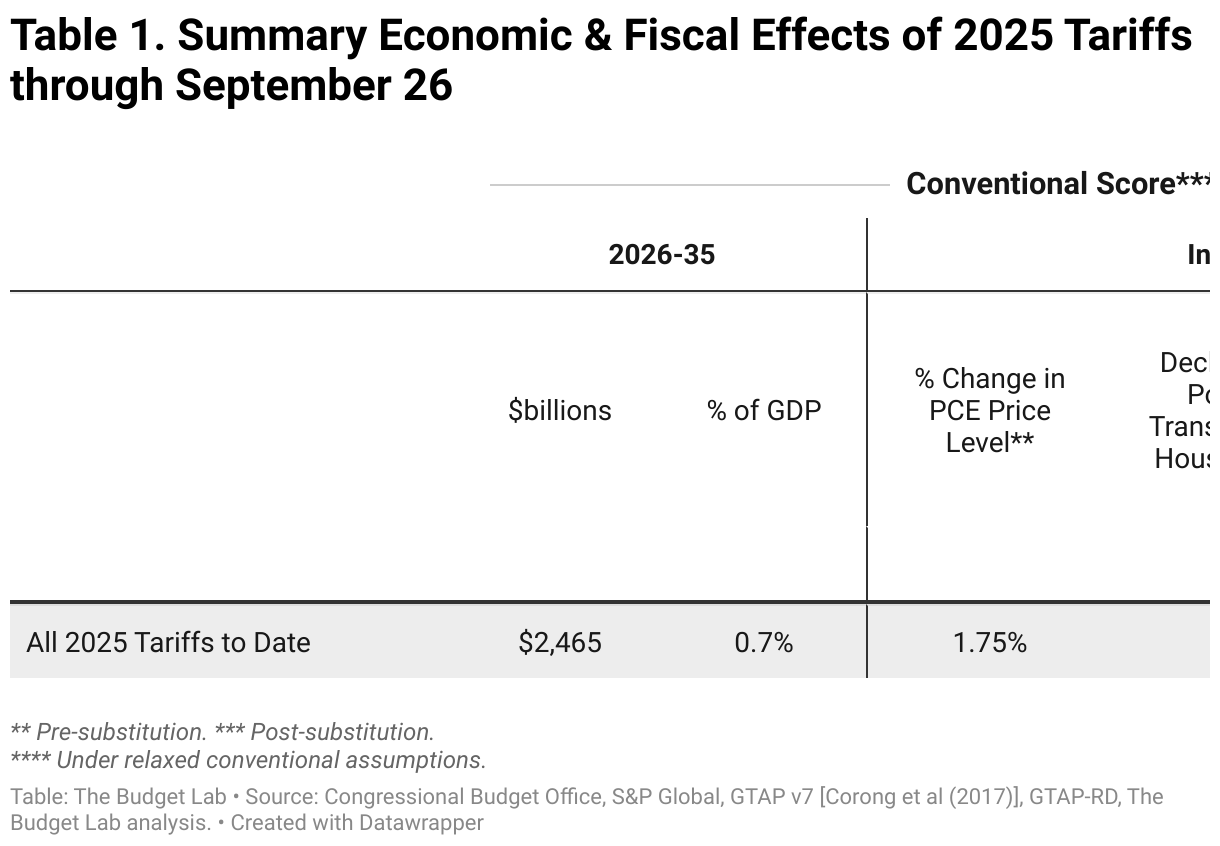
The table below summarizes the effects of current tariff policy as of September 26, assuming it stays in force indefinitely.
Average Effective Tariff Rate
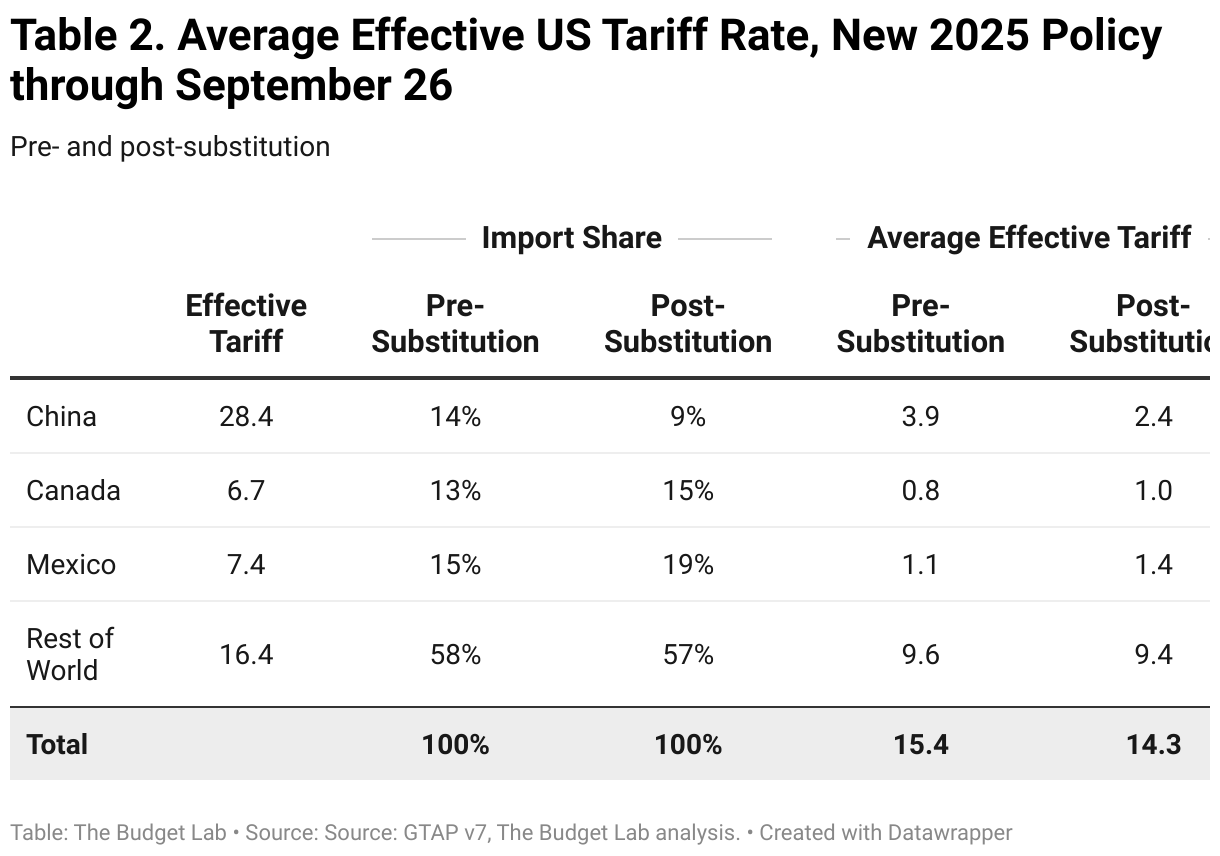
The distinction between pre-substitution metrics (before consumers and businesses shift purchases in response to the tariffs) and post-substitution (after they shift) is a crucial one. One metric where the difference is meaningful is the average effective tariff rate.
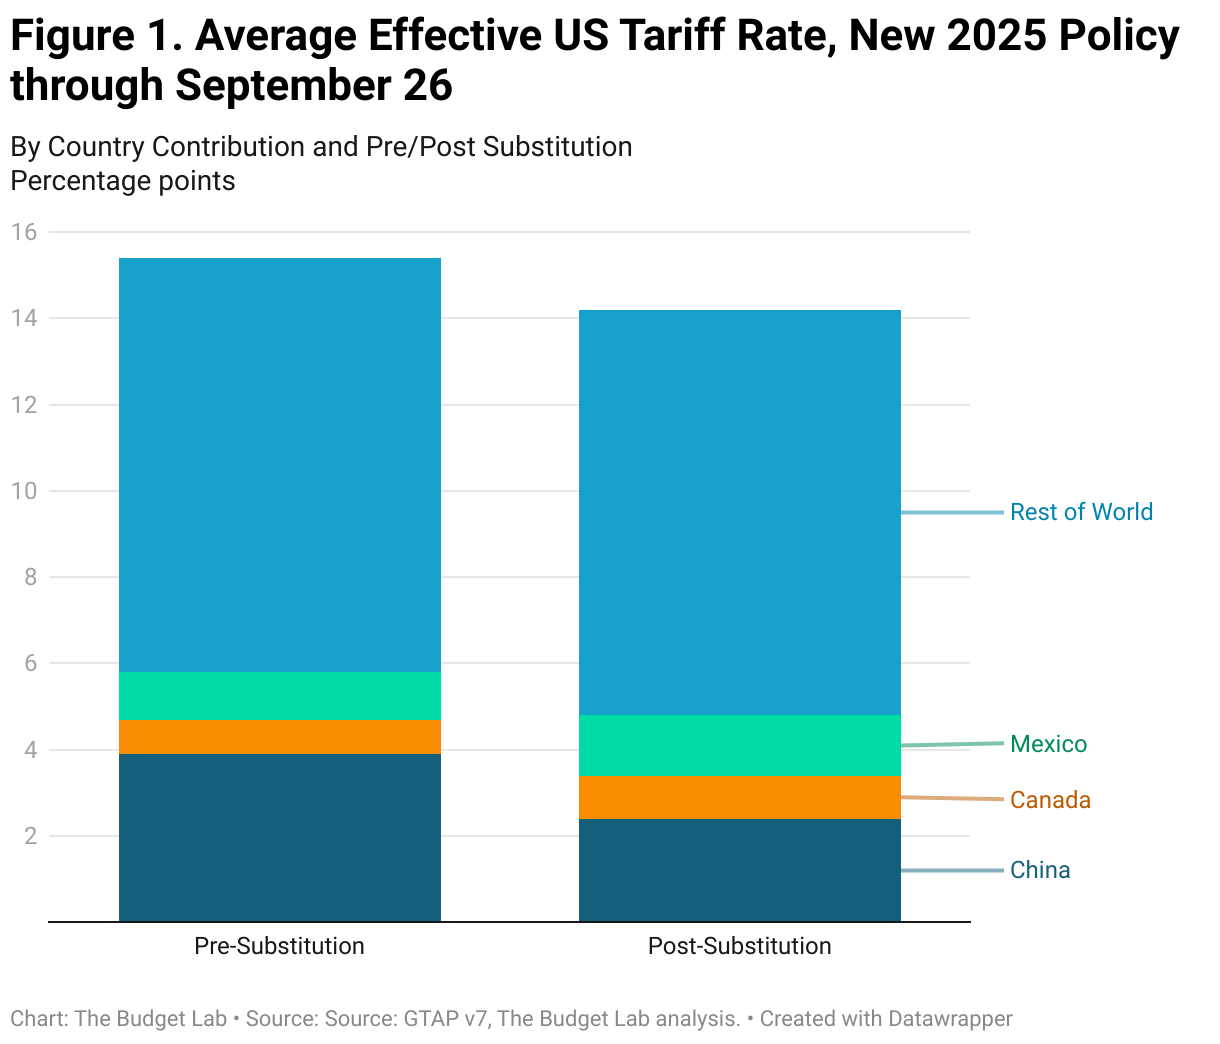
Measured pre-substitution — assuming there are no shifts in the import shares of different countries — the 2025 tariffs to date are the equivalent of a 15.4 percentage point increase in the US average effective tariff rate. That calculation assumes that, for example, the share of imports from China remains at 14%, where it was in 2024. This is the right way to think about the tariffs from the perspective of consumer welfare, since it reflects the full cost faced by consumers before they start making difficult spending choices. This increase would bring the overall US average effective tariff rate to 17.9%, the highest since 1934.
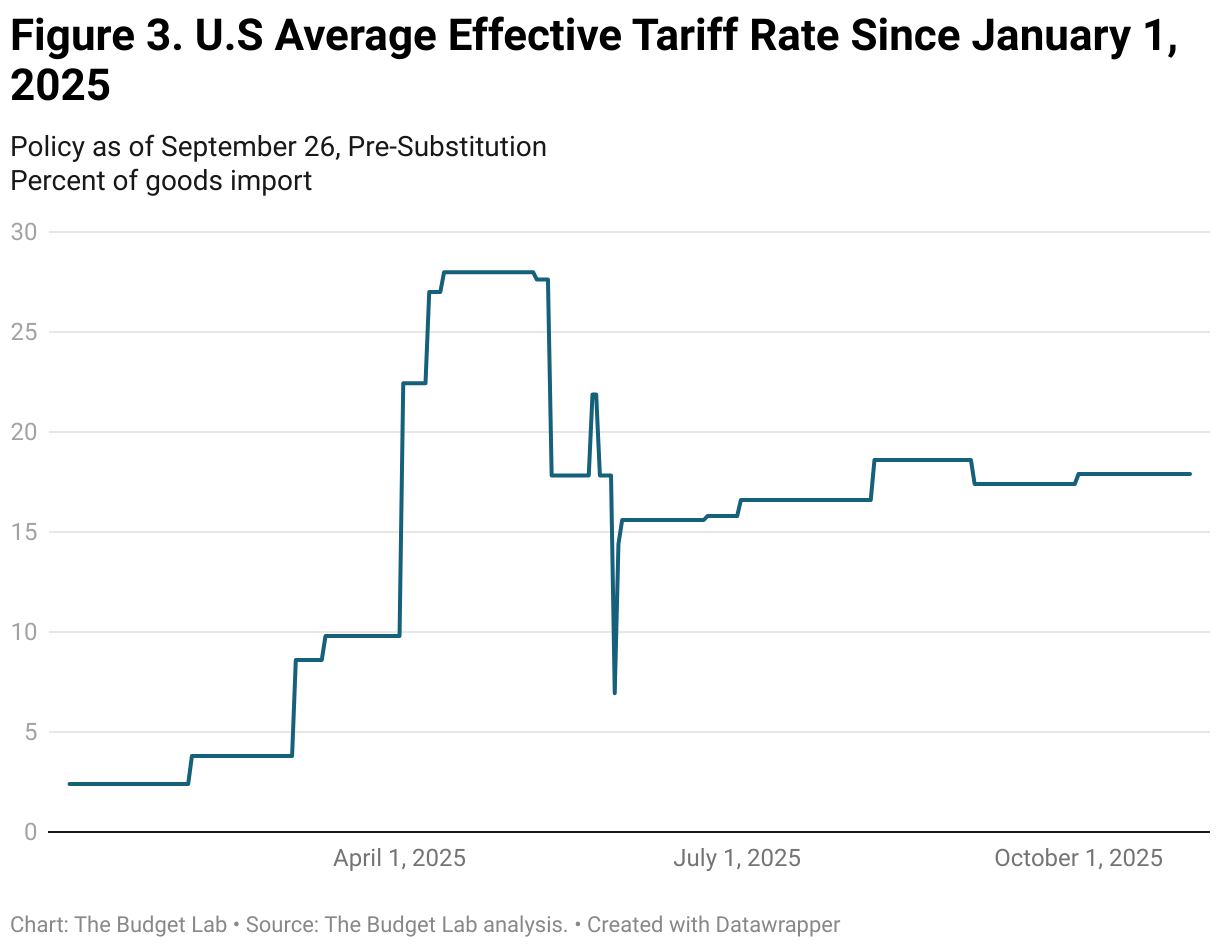
The effective tariff rate implied by policy has fluctuated substantially this year, starting at 2.4% in early January and peaking at 28% in the wake of the April 9 and 13 announcements.
Post-substitution — after imports shift in response to the tariffs — the 2025 tariffs are a 14.3 percentage point increase in the US average effective tariff rate, which brings the overall US effective tariff rate to 16.7%, the highest since 1936.
The timing of the transition from “pre” to “post” substitution is highly uncertain. Some shifts are likely to happen quickly—within days or weeks—while others may take longer.2
Average Aggregate Price Impact
The 2025 tariffs imply an increase in consumer prices of 1.7% in the short-run, assuming no policy reaction from the Federal Reserve and full passthrough of tariffs to consumers. As a result, TBL assumes the real income adjustment comes primarily through prices rather than nominal incomes. If the Federal Reserve reacted, the adjustment could in part come in the form of lower nominal incomes. This is a pre-substitution number that captures consumer welfare effects. It is the equivalent of a short-run income loss3 of $2,370 per household on average in 2025 dollars. The post-substitution price increase settles at 1.4%, a $1,940 short-run loss per household.
US Real GDP & Labor Market Effects
All 2025 US tariffs plus foreign retaliation lower real GDP growth by -0.5 pp over calendar year 2025 and by 0.4 percentage point over 2026 (Q4-Q4). The unemployment rate ends 2025 0.3 percentage point higher and 2026 0.7 percentage point higher, and payroll employment is 490,000 lower by the end of 2025. The level of real GDP remains persistently -0.4% smaller in the long run, the equivalent of $125 billion 2024$ annually, while exports are -14% lower.
Long-run US Sectoral Output & Employment Effects
Tariffs shrink the overall size of the US economy in the long-run by 0.4%, but beneath aggregate GDP they also drive reallocation across US sectors. Long-run output in the manufacturing sector expands by 2.7% under the tariffs, with nonadvanced durable manufacturing output 4.9% larger and nondurable manufacturing 2.1% larger. However, advanced manufacturing is down by 4.2%. Moreover, the expansion of the overall manufacturing sector more than crowds out the rest of the economy: construction contracts by 3.7%, agriculture by 0.3%, and mining & extraction by 1.7%.
Global Long-run Real GDP Effects
Mexico is the biggest winner from the 2025 tariffs to date, with its economy 0.2% larger in the long-run. Canada’s economy is 0.1% larger in real terms. China’s economy is -0.3% smaller, roughly three-quarters as large as the hit to the US. The EU’s economy is 0.05 percentage point larger in the long-run, while the UK’s is 0.14% bigger thanks in part to the benefits of US-UK trade deal.
Fiscal Impact & Historical Context
The 2025 tariffs to date, were they to remain in place, would raise $2.5 trillion over 2026-35 conventionally-scored ($2.3 trillion over 2025-34).4 5 Given the negative output effects of the tariffs, there would be additional dynamic reductions in tax revenue as a result. Based on Congressional Budget Office rules-of-thumb, TBL estimates that these effects would total -$469 billion over the decade (-$424 billion over 2025-34), bringing total dynamic revenue to $2.0 trillion over 2026-35 ($1.9 trillion over 2025-34).
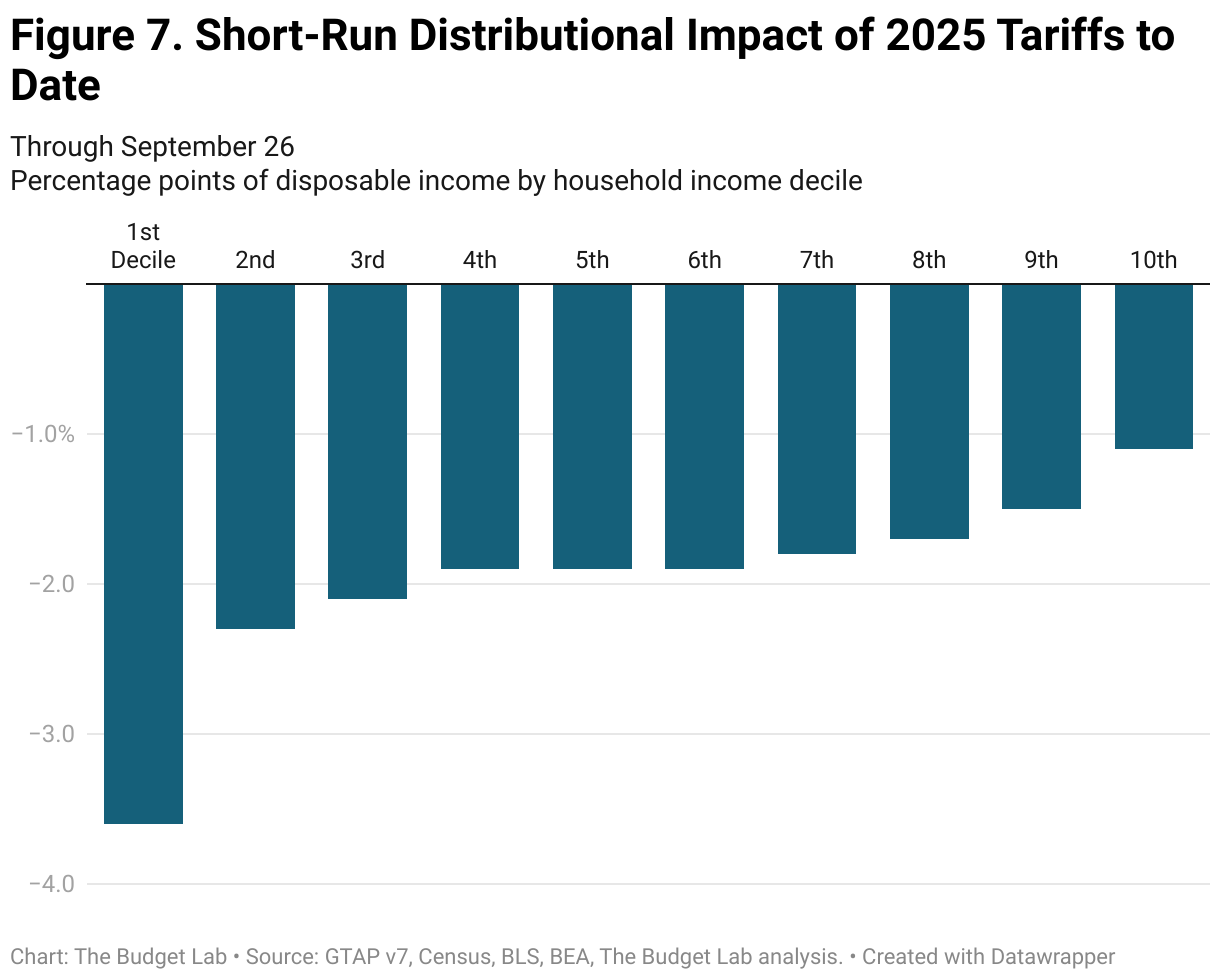
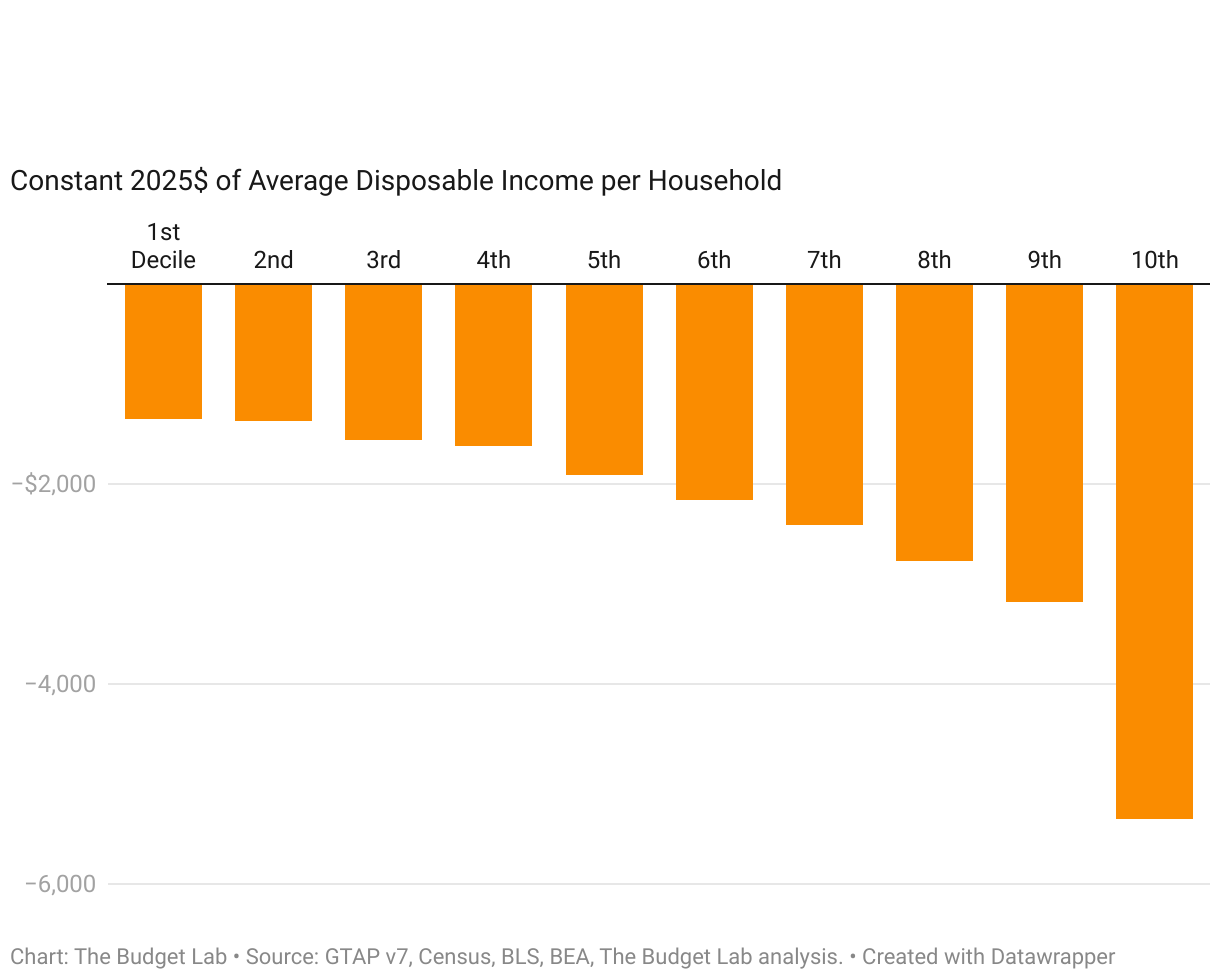
Short-run Distributional Impact
Tariffs are a regressive tax, especially in the short-run. This means that tariffs burden households at the bottom of the income ladder more than those at the top as a share of income. The regressivity is about the same when looking at all 2025 tariffs: the short-run burden on the first decile is more than three times that of the top decile (-3.6% versus -1.1%). The average annual cost to households in the first and top decile rise to $1,350 and $5,350 respectively in 2025$. The median cost is $2,000 per household.
Tariffs are more distributionally-ambiguous in the longer-run. Tariffs reduce both labor income and above-normal returns to capital, or rents. We assume that owners of capital hold rents rather than consume them in the short-run, but do consume them over their lifecycle in the long-run. The implication is that the tariff burden is more regressive in the short-run and more evenly-distributed across households in the long-run
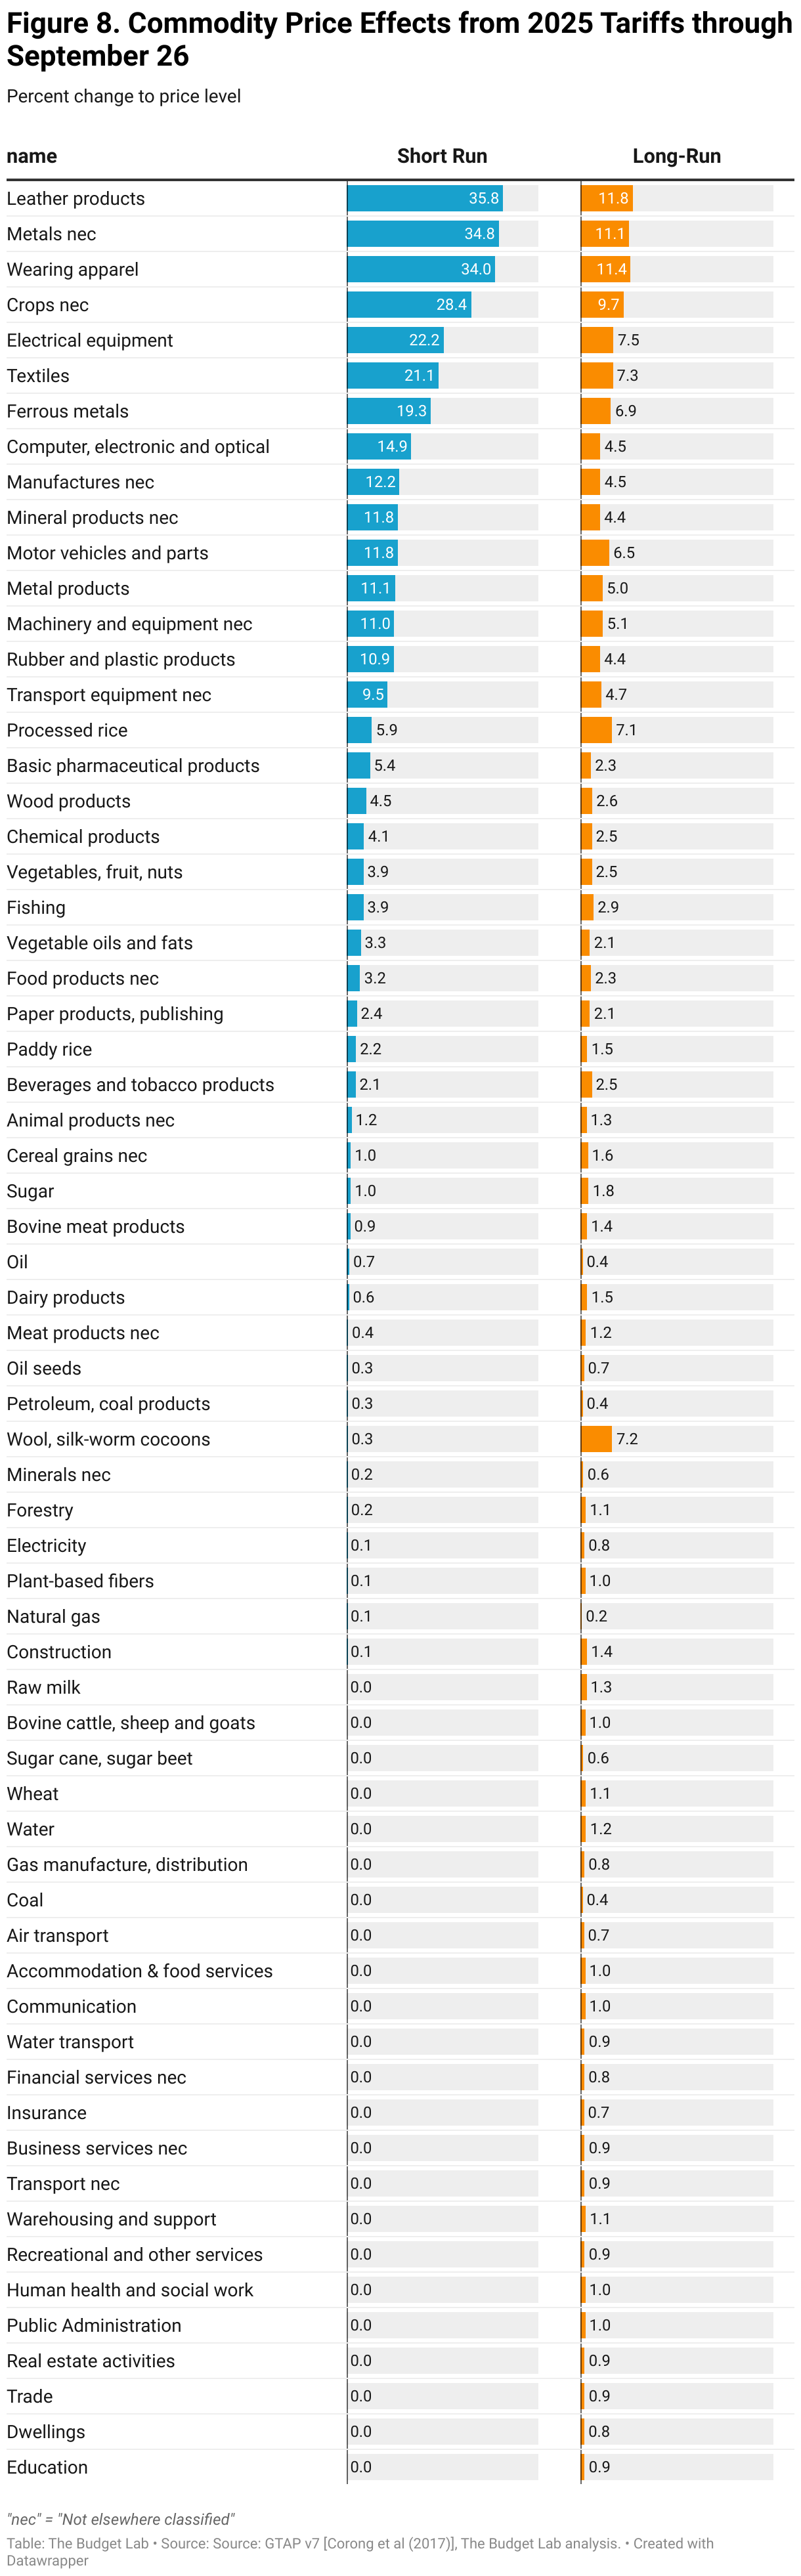
Commodity Price Effects
The charts below show how the 1.7% price level increase from the 2025 tariffs to date would look across individual commodities in the short-run (pre-substitution), as well as the 1.4% long-run price increase (post-substitution). Some high level takeaways:
- Consumers face particularly high increases in leather and clothing in the short-run: prices increase 36% for leather products (shoes and hand bags), 34% for apparel, and 21% for textiles. After substitution and global supply shifts in the long-run, prices remain 12%, 11%, and 7% higher, respectively.
- Food prices rise 2.4% in the short-run and stay 2.2% higher in the long-run. Fresh produce is initially 3.9% more expensive while stabilizing at 2.5% higher.
- Motor vehicle prices rise 12% in the short-run and 7% in the long-run, the equivalent of an additional $5,700 and $3,100 respectively to the price of an average 2024 new car.
Footnotes
- TBL also assumes that the recent US-EU and US-Japan trade deals effectively cap the pharmaceutical tariffs at 15% for both countries.
- TBL assumes throughout its tariff analysis that the transition to longer-run GTAP equilibria occurs after three years.
- TBL defines “income” as CBO-concept post-tax-and-transfer income. “Short-run” refers to the effect over the next couple of years; TBL proxies for this definition by using CBO projections of the distribution of income in 2027, expressed in 2025 dollars.
- TBL employs a “relaxed conventional” assumption for the retaliation scenario, whereby foreign income is permitted to fall but US income remains fixed.
- The Congressional Budget Office has projected that tariff policy in place as of August 19 reduces primary (non-interest) deficits by $3.3 trillion over 2025-35. On a like-for-like policy basis, the differences between CBO’s and TBL’s estimates can be entirely explained by three factors: 1) CBO quotes the fiscal effects of tariffs on an 11-year basis (2025-35), while TBL quotes the effects on a 10-year basis (2026-35); 2) CBO does not adjust its estimates for non-compliance, while TBL reduces its first stage revenue estimates by 10% to account for additional non-compliance not captured in underlying trade elasticities; and, 3) CBO and TBL have different estimates of the average effective US tariff rate: in its August 22 report, CBO calculated that the average tariff rate was 18 percentage points higher due to new 2025 tariffs, while TBL, in its September 4 report, calculated the rate was 15 percentage points higher.