
State of U.S. Tariffs: September 4, 2025
Key Takeaways
-
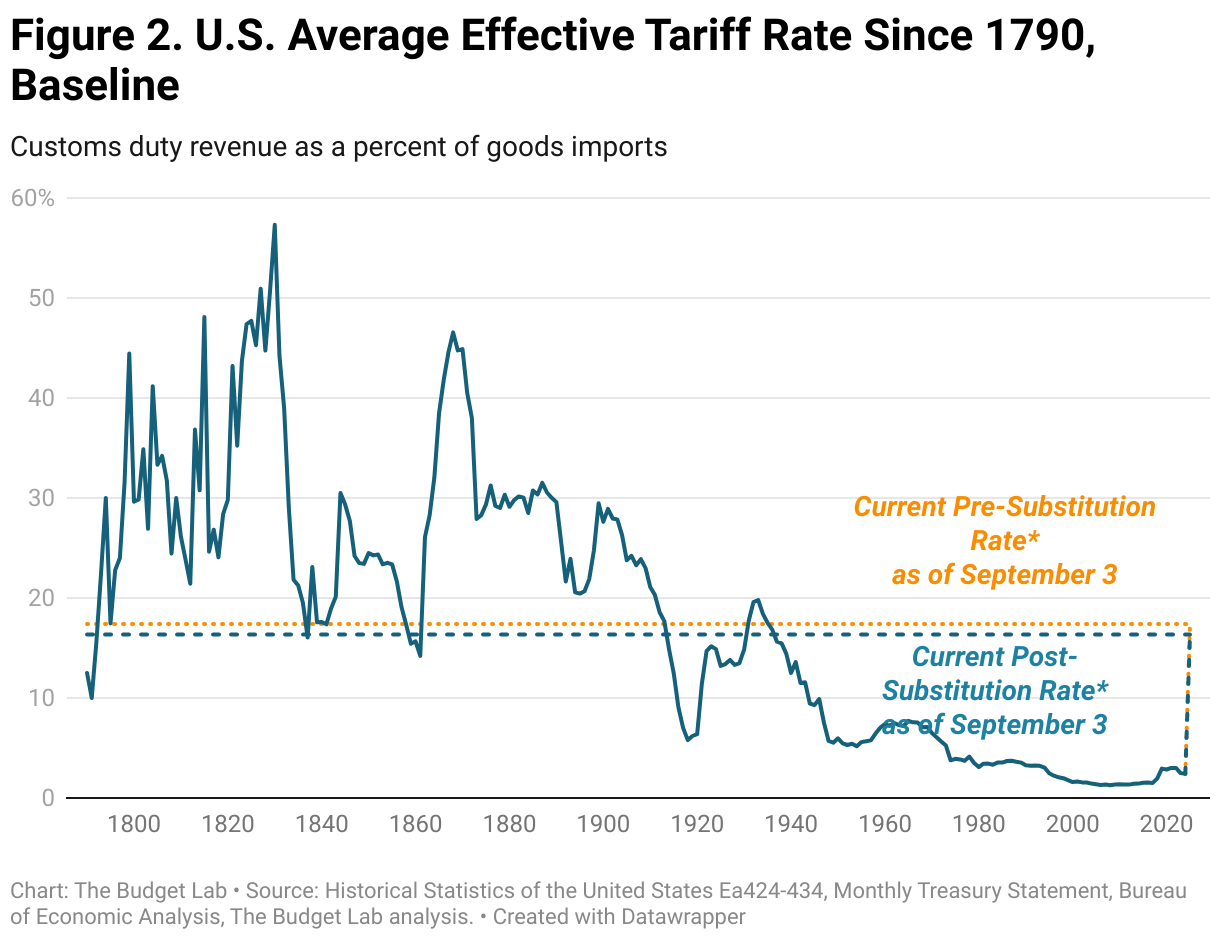
In the baseline scenario where all current tariffs are maintained in perpetuity, consumers face an overall average effective tariff rate of 17.4%, the highest since 1935.
-
IEEPA is a significant portion of the 2025 tariffs. In an alternative scenario where the IEEPA tariffs are declared illegal and not replaced with other trade authorities, that would erase 71% of the 2025 tariffs imposed to date.
-
In the baseline scenario, all tariffs to date in 2025 raise $2.4 trillion over 2026-35. Under the invalidation of IEEPA tariffs, $704 billion is raised over the same time horizon.
-
In the baseline scenario, the price level from all 2025 tariffs rises by 1.7%, equivalent of an average per household income loss of $2,300 in 2025$. Under the invalidation of IEEPA tariffs, the price level rises by 0.5%, equivalent of an average per household income loss of $700.
Summary of Results
-
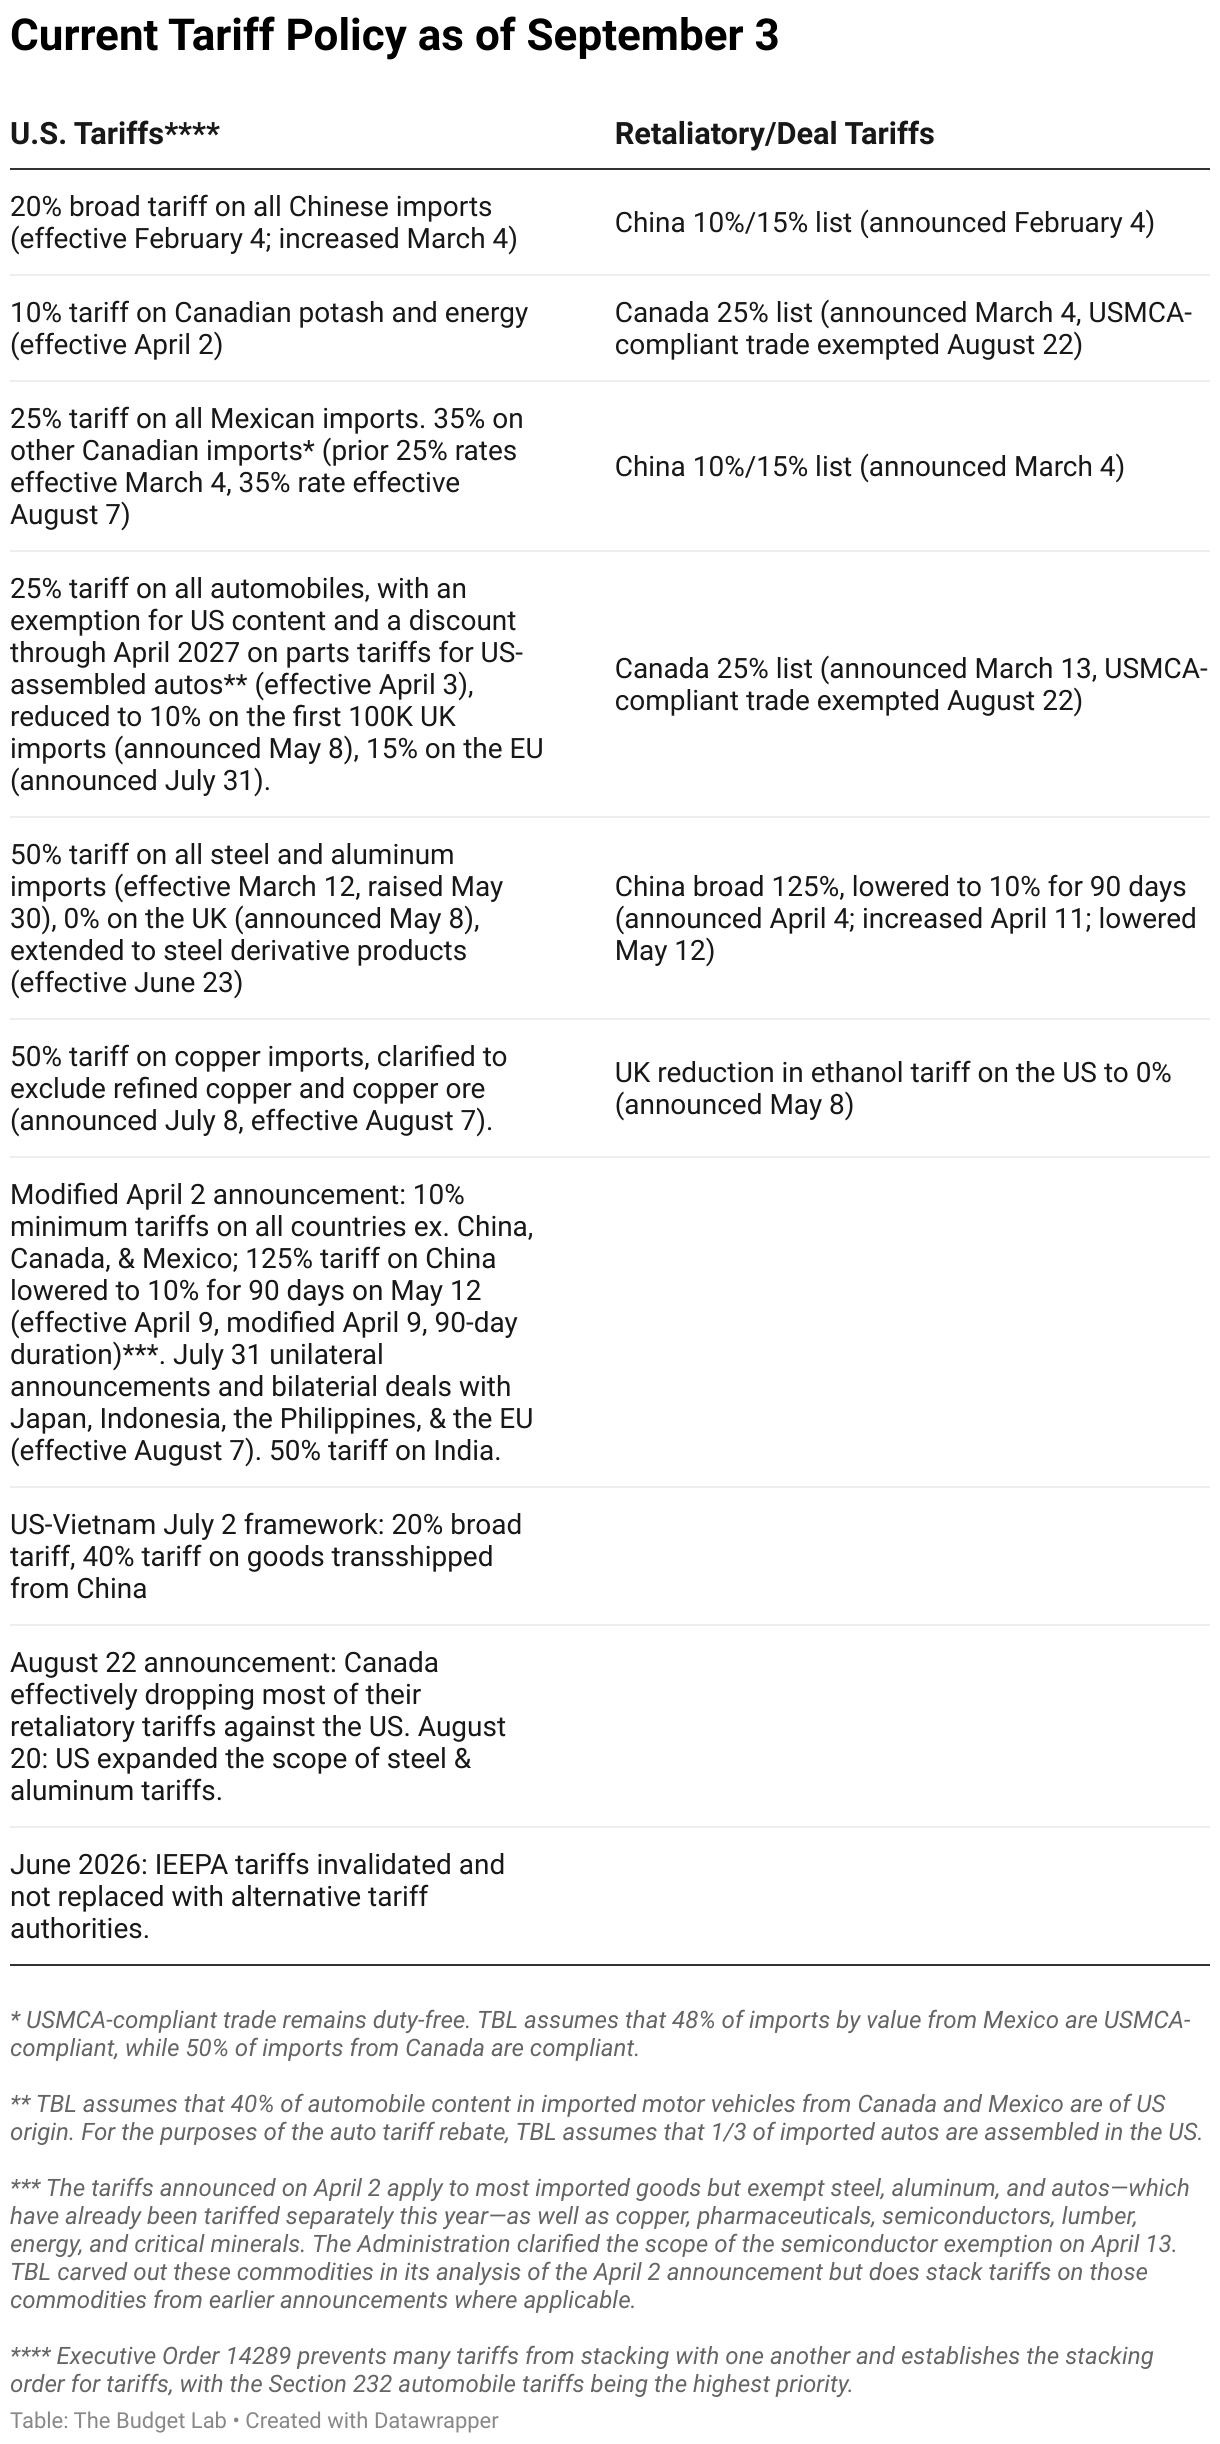
The Budget Lab (TBL) estimated the effects all US tariffs and foreign retaliation implemented in 2025 through September 3 under two scenarios. Under the baseline scenario, TBL analyzed the September 3 tariff rates as if they stayed in effect in perpetuity. Under the No IEEPA scenario, the Supreme Court invalidates the IEEPA tariffs in June 2026 and they are not replaced with tariffs under alternative authorities.
-
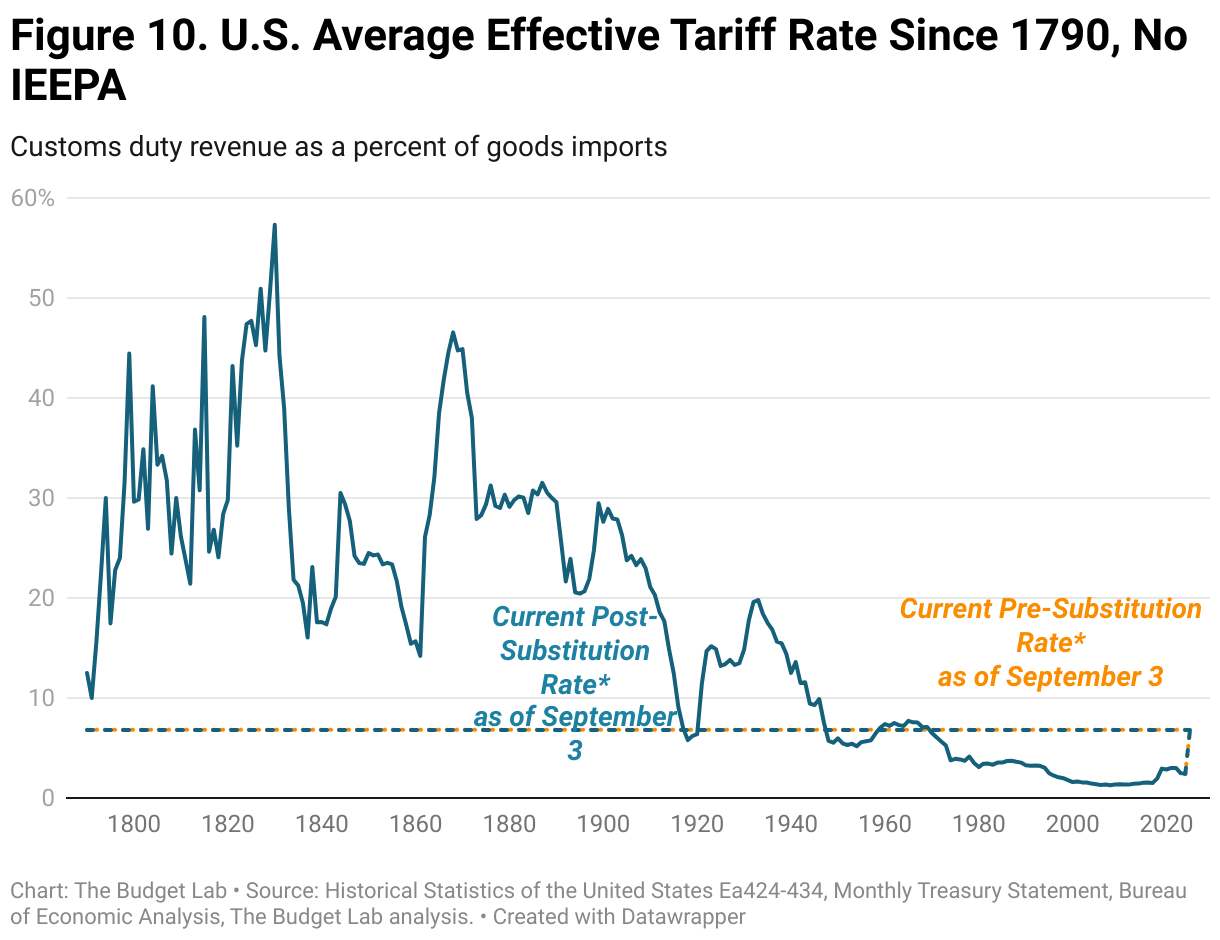
Current Tariff Rate: In the baseline scenario, consumers face an overall average effective tariff rate of 17.4%, the highest since 1935. After consumption shifts, the average tariff rate will be 16.4%, the highest since 1936.
On the other hand, under the invalidation of the IEEPA tariffs, Consumers face an overall average effective tariff rate of 6.8%, the highest since 1969 . After consumption shifts, the average tariff rate will still be 6.8%.
-
Overall Price Level & Distributional Effects: The price level from all 2025 tariffs rises by 1.7% in the short-run under the baseline scenario, the equivalent of an average per household income loss of $2,300 in 2025$, in the baseline scenario. This assumes the Federal Reserve does not react to tariffs and so the real income adjustment comes primarily through prices rather than nominal incomes; if the Federal Reserve reacted, the adjustment could in part come in the form of lower nominal incomes. Annual pre-substitution losses for households at the bottom of the income distribution are $1,300. The post-substitution price increase settles at 1.4%, a $1,900 loss per household.
Under the invalidation of the IEEPA tariffs, the price level from all 2025 tariffs rises by 0.5% in the short-run, the equivalent of an average per household income loss of $663 in 2025$. Annual pre-substitution losses for households at the bottom of the income distribution are $211. The post-substitution price increase settles at 0.5%, a $642 loss per household.
-
Commodity Prices: In the baseline scenario, the 2025 tariffs disproportionately affect leather products, with consumers facing 37% higher prices and 35% higher apparel prices in the short-run. Leather and apparel prices stay 13% and 13% higher in the long-run respectively.
Under the invalidation of the IEEPA tariffs, the 2025 tariffs disproportionately affect metals and ferrous metals, with consumers facing 52% higher metal prices and 32% higher ferrous metals prices in the short-run. Metals and ferrous metals stay 15% and 11% higher in the long-run respectively.
-
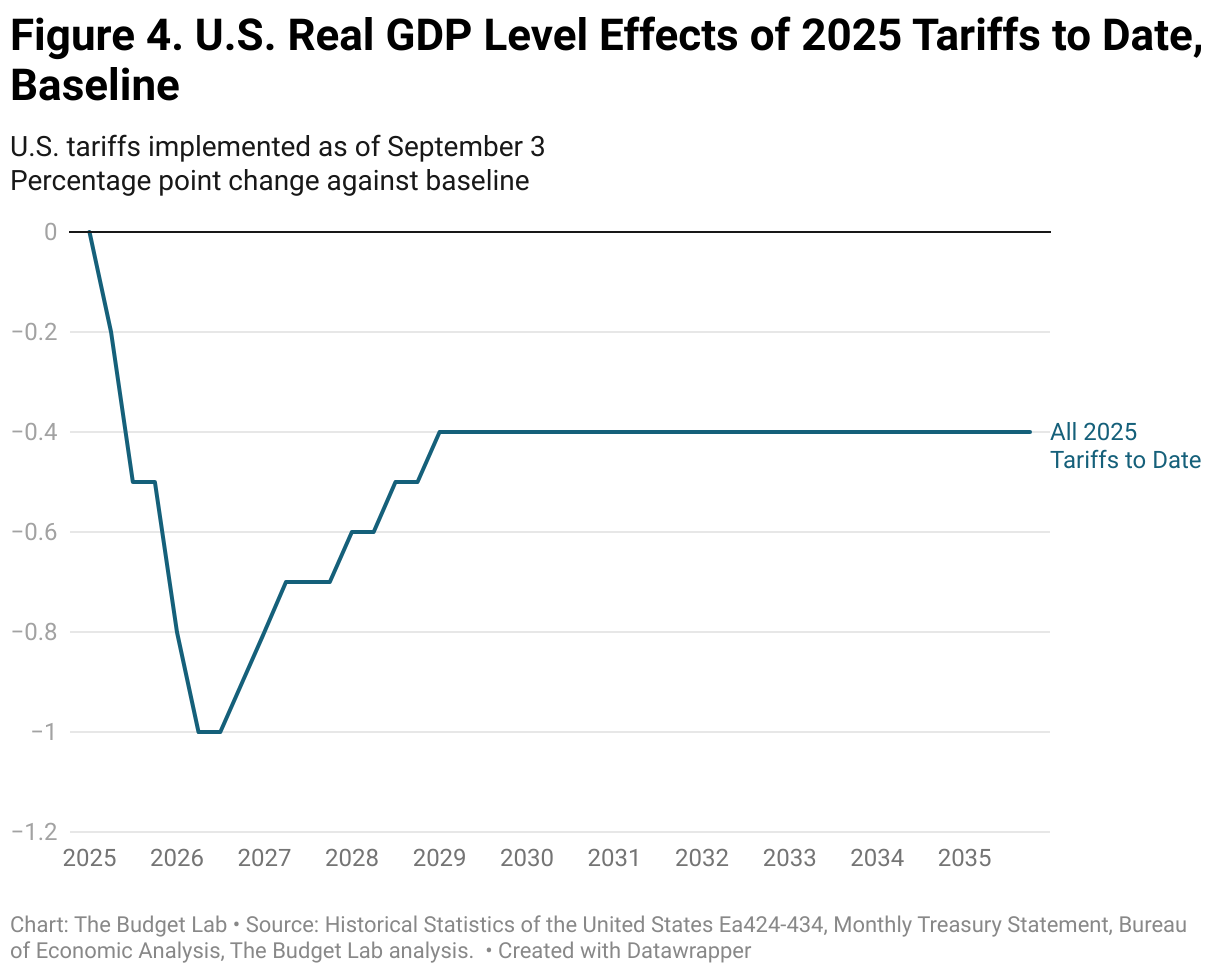
Real GDP Effects: In the baseline scenario, US real GDP growth over 2025 and 2026 is -0.5 pp lower each year from all 2025 tariffs. In the long-run, the US economy is persistently -0.4% smaller, the equivalent of $120 billion annually in 2024$.
Under the invalidation of the IEEPA tariffs, US real GDP growth over 2025 and 2026 is -0.5 pp lower each year from all 2025 tariffs. In the long-run, the US economy is persistently -0.1% smaller, the equivalent of $25 billion annually in 2024$.
-
Labor Market Effects: In the baseline scenario, the unemployment rate rises 0.28 percentage points by the end of 2025 and 0.65 percentage points by the end of 2026. Payroll employment is 480,000 lower by the end of 2025.
Under the invalidation of the IEEPA tariffs, the unemployment rate rises 0.3 percentage points by the end of 2025 and 0.5 percentage points by the end of 2026. Payroll employment is 480,000 lower by the end of 2025 (the same as the baseline scenario since we assume IEEPA is not invalidated until June 2026).
-
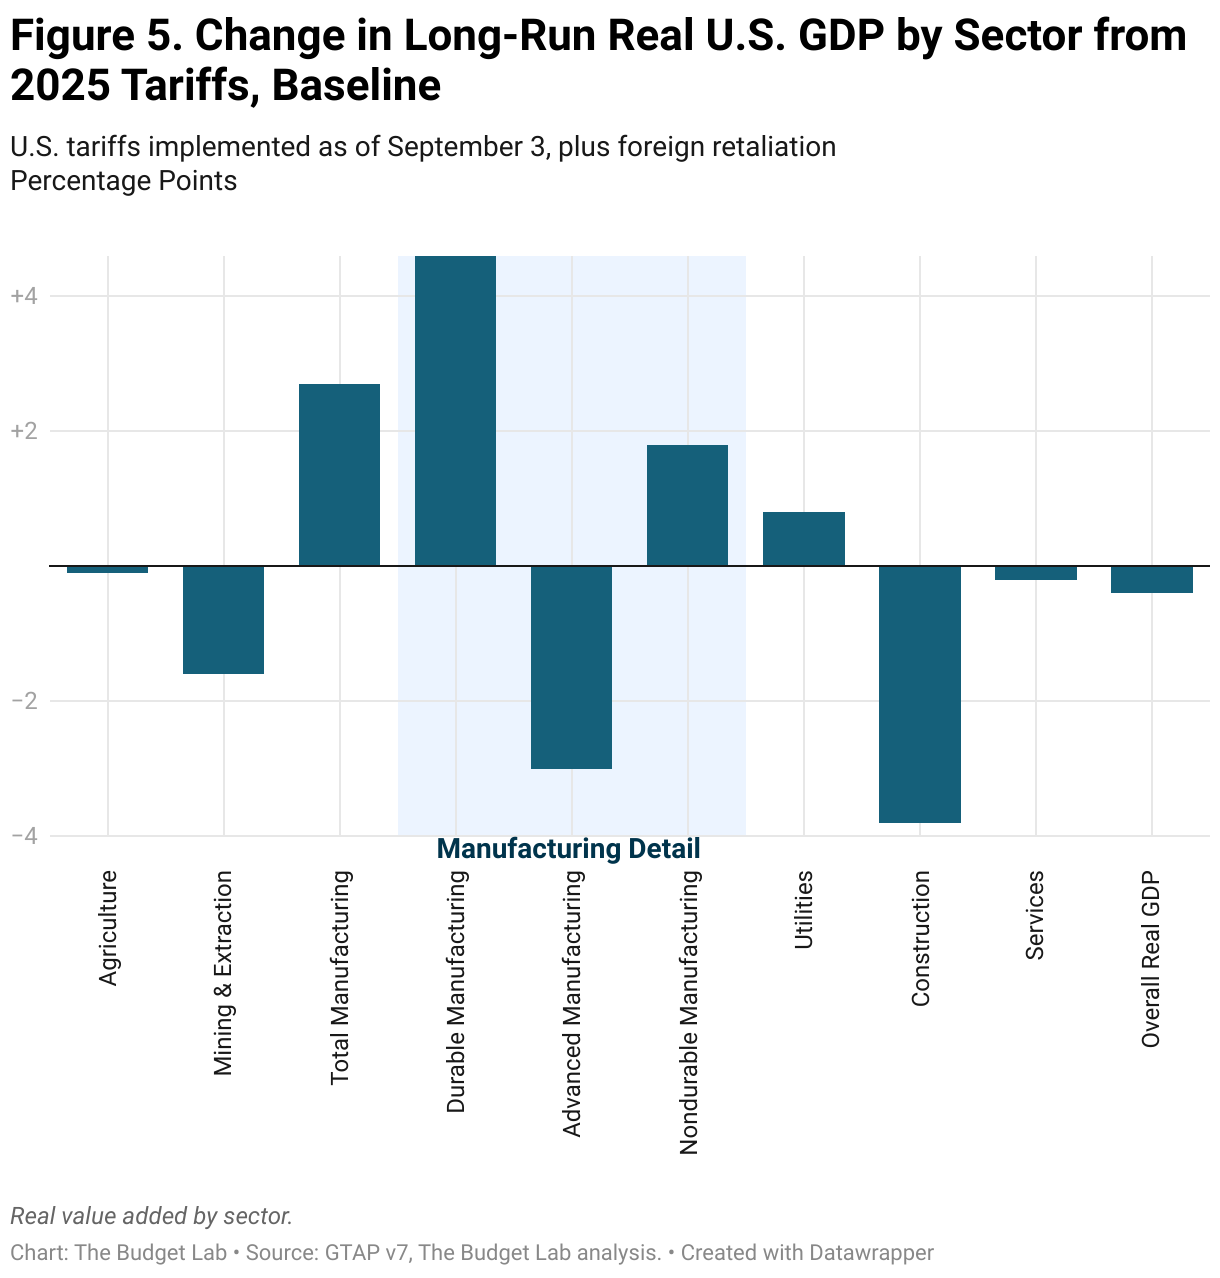
Long-Run Sectoral GDP & Employment Effects: In the baseline scenario, in the long-run, tariffs present a trade-off. US manufacturing output expands by 2.7%, but these gains are more than crowded out by other sectors: construction output contracts by 3.8% and agriculture declines by 0.1%.
Under the invalidation of the IEEPA tariffs, in the long-run, tariffs present a trade-off. US manufacturing output expands by 0.5%, but these gains are more than crowded out by other sectors: construction output contracts by 1.6% and agriculture declines by 0.6%.
-
Fiscal Effects: In the baseline scenario, all tariffs to date in 2025 raise $2.4 trillion over 2026-35, with $451 billion in negative dynamic revenue effects, bringing dynamic revenues to $2.0 trillion.
Under the invalidation of the IEEPA tariffs, all tariffs to date in 2025 raise $704 billion over 2026-35, with $211 billion in negative dynamic revenue effects, bringing dynamic revenues to $496 billion.
Changes Since the Last Report
This report, unlike most recent TBL tariff reports, presents two scenarios. The first makes the policy and methodological adjustments described below, but otherwise assumes current tariff policy stays in place in perpetuity (the same approach as typical TBL tariff updates). The second scenario assumes that International Emergency Economic Powers Act (IEEPA) tariffs are invalidated by the Supreme Court in June 2026 and not replaced with alternative tariff authorities. This second scenario will be referred to as “No IEEPA”. This is meant to be a purely illustrative scenario of how a particularly sweeping judicial decision against executive tariff authority might affect the economic and the fiscal effects laid out in the first scenario.1
TBL has made both policy and methodological changes since the August 7 report:
Policy Changes
- Canada announced August 22 that they were effectively dropping most of their retaliatory tariffs against the US. This changes TBL’s analysis by substantially reducing the long-run effect of 2025 tariff policy on Canadian real GDP.
- The Trump Administration expanded the scope of the steel & aluminum tariffs on August 20, slightly increasing the average effective tariff rate all else equal.
Methodological Changes
- As a result of our recent review of the short-run economic effects from tariffs, TBL has concluded that the USMCA-compliant share of imports from Canada and Mexico understates the true tariff-free share of imports from those countries, as a meaningful share of their imports appear to be entering the US on tariff-free authorities other than USMCA, such as MFN zero-rate lines. TBL now calculates the effective tariff rates on Canada and Mexico using total tariff-free shares of imports on a commodity-by-commodity basis. This change lowers TBL’s estimates of the average effective tariff rate by 6pp for Canada and nearly 3pp for Mexico and brings the statutory effective tariff rate much closer in line with the actual effective tariff rates calculated from incoming revenues.
- TBL has incorporated the new distributional weights first used in the August 12 combined distributional report and described in detail in that report’s appendix.
- TBL’s FY2025 fiscal effects now incorporate actual fiscal-year-to-date tariff revenues.
TBL analyzes tariffs on a “real-time current policy” basis, where policy as it stands as of date certain is assumed to continue in perpetuity, even if framed as a temporary policy.
Baseline Scenario Results
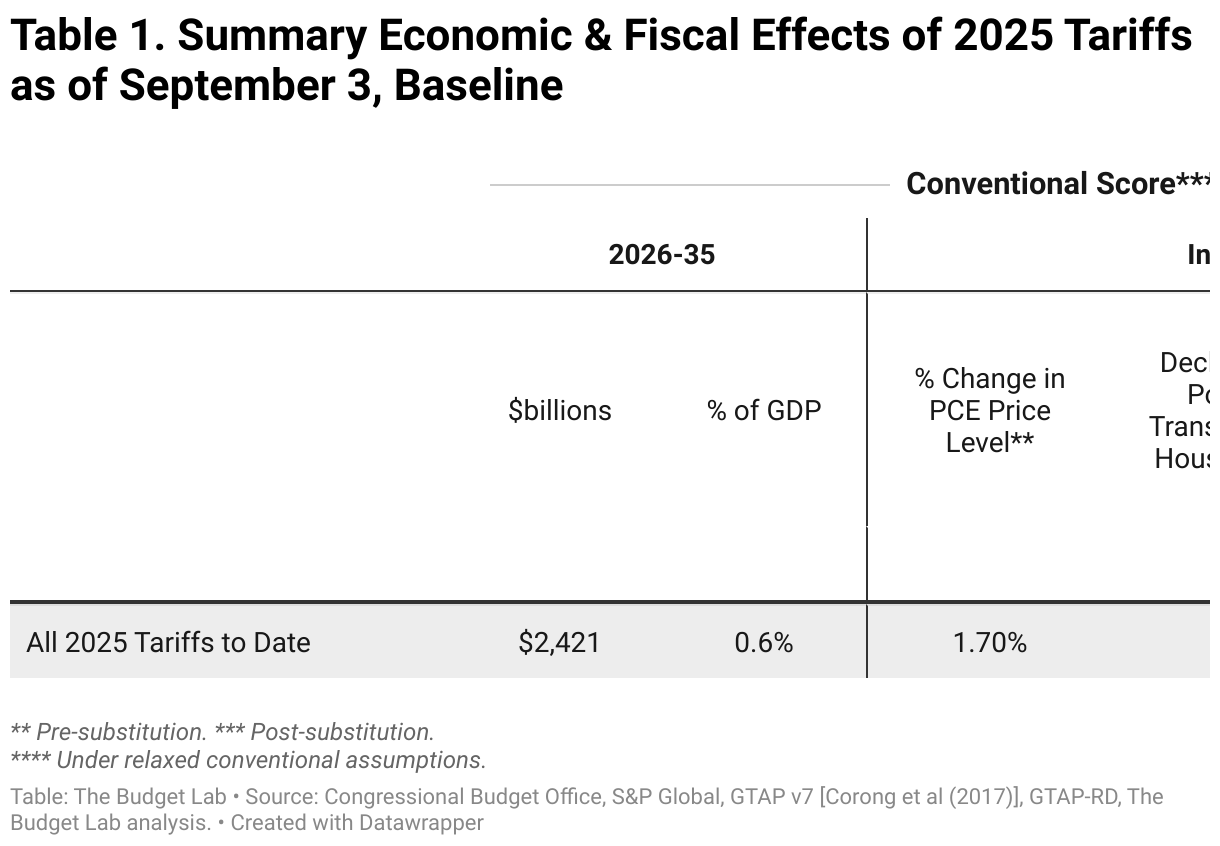
The table below summarizes the effects of current tariff policy as of September 3, assuming it stays in force indefinitely.
Average Effective Tariff Rate
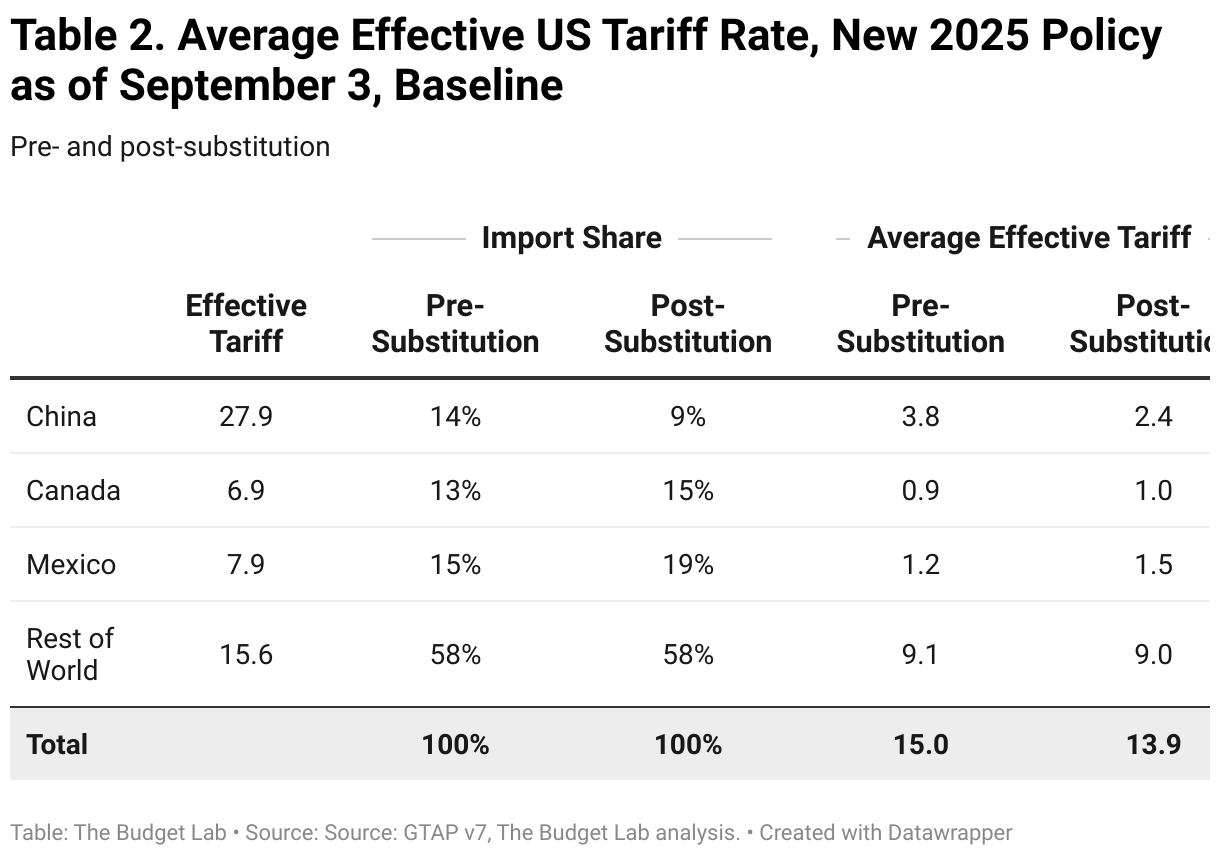
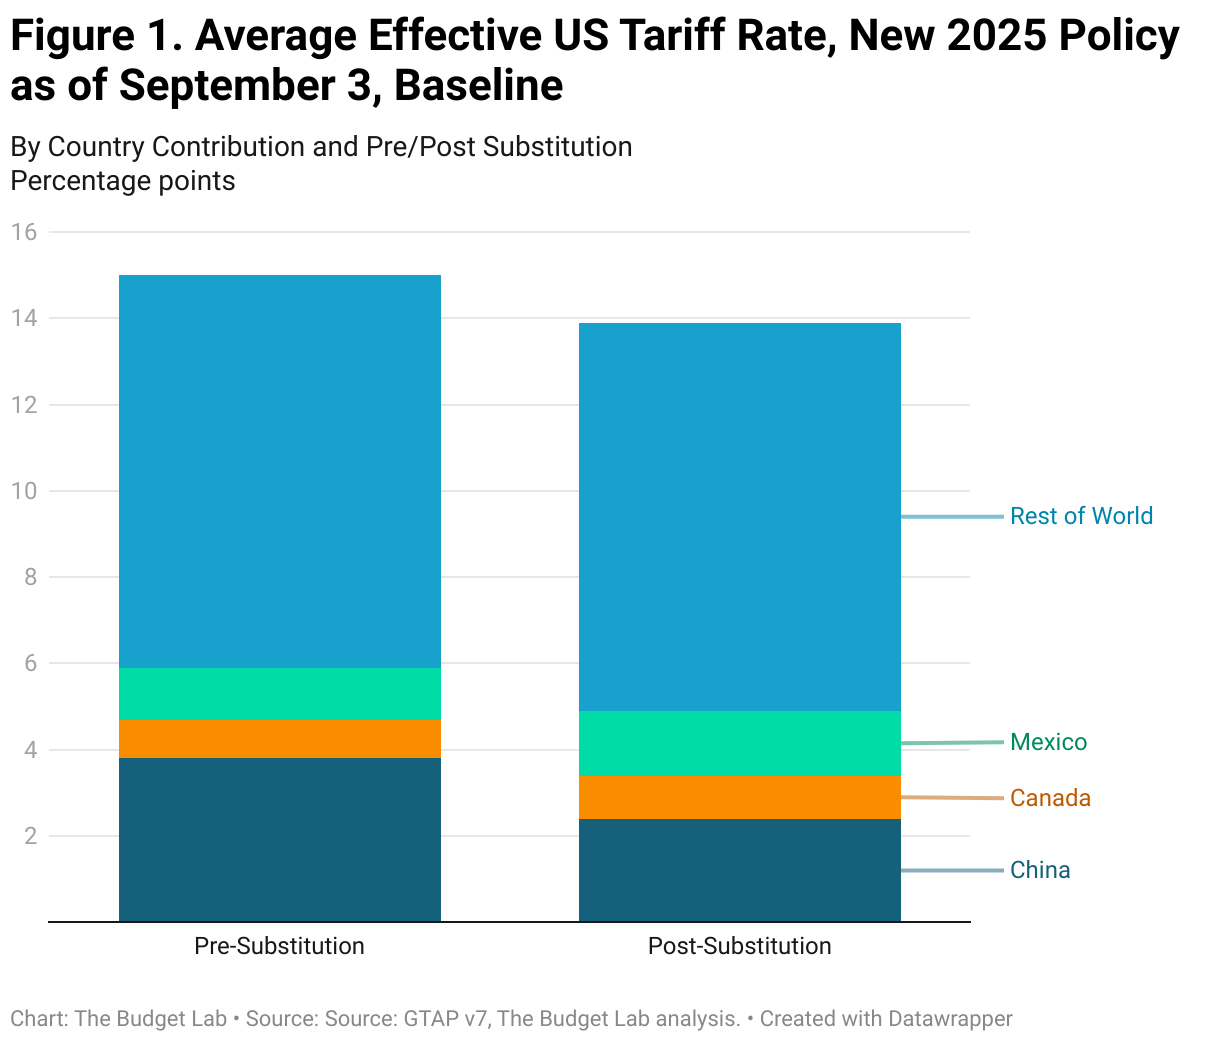
The distinction between pre-substitution metrics (before consumers and businesses shift purchases in response to the tariffs) and post-substitution (after they shift) is a crucial one. One metric where the difference is meaningful is the average effective tariff rate.
Measured pre-substitution—assuming there are no shifts in the import shares of different countries—the 2025 tariffs to date are the equivalent of a 15 percentage point increase in the US average effective tariff rate. That calculation assumes that, for example, the share of imports from China remains at 14%, where it was in 2024. This is the right way to think about the tariffs from the perspective of consumer welfare, since it reflects the full cost faced by consumers before they start making difficult spending choices. This increase would bring the overall US average effective tariff rate to 17.4%, the highest since 1935.
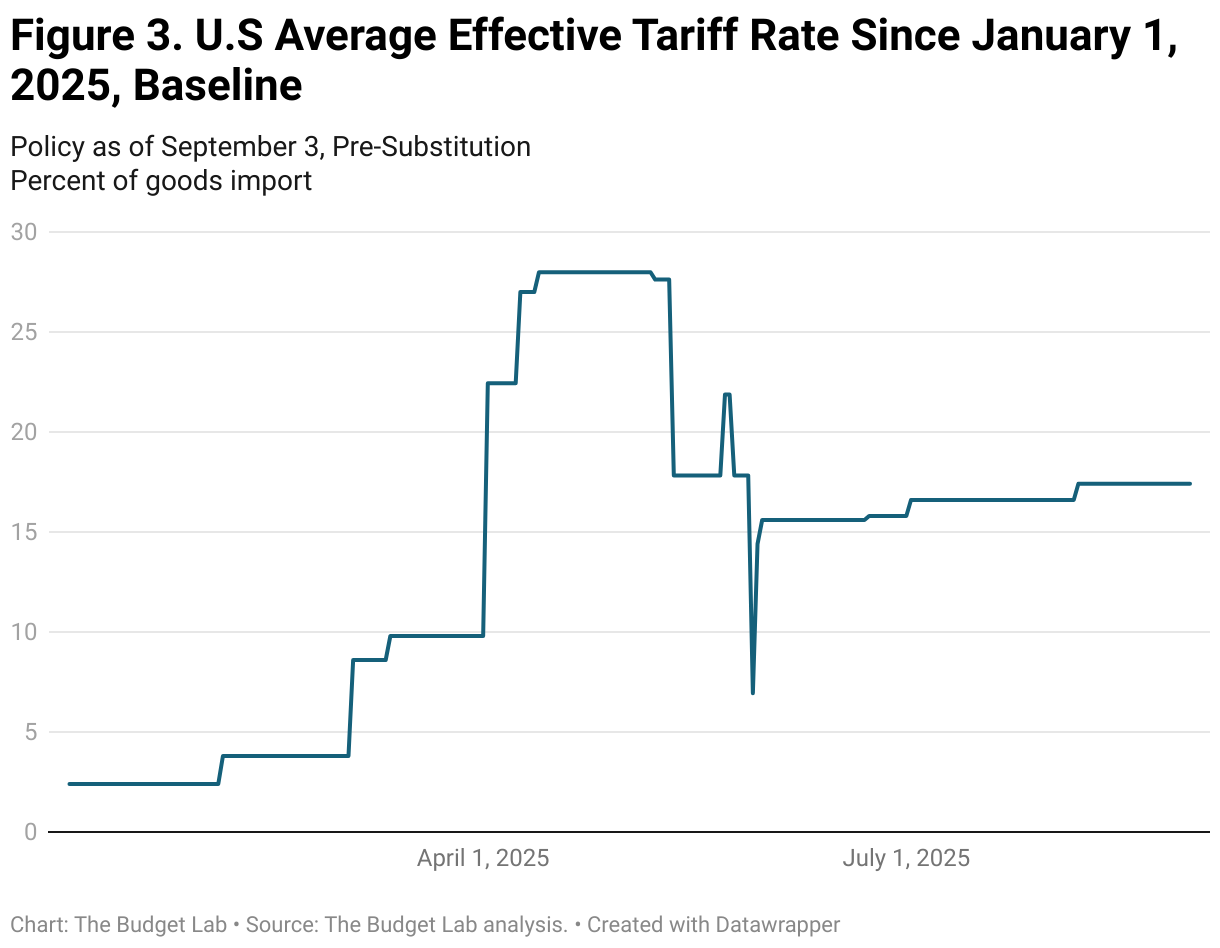
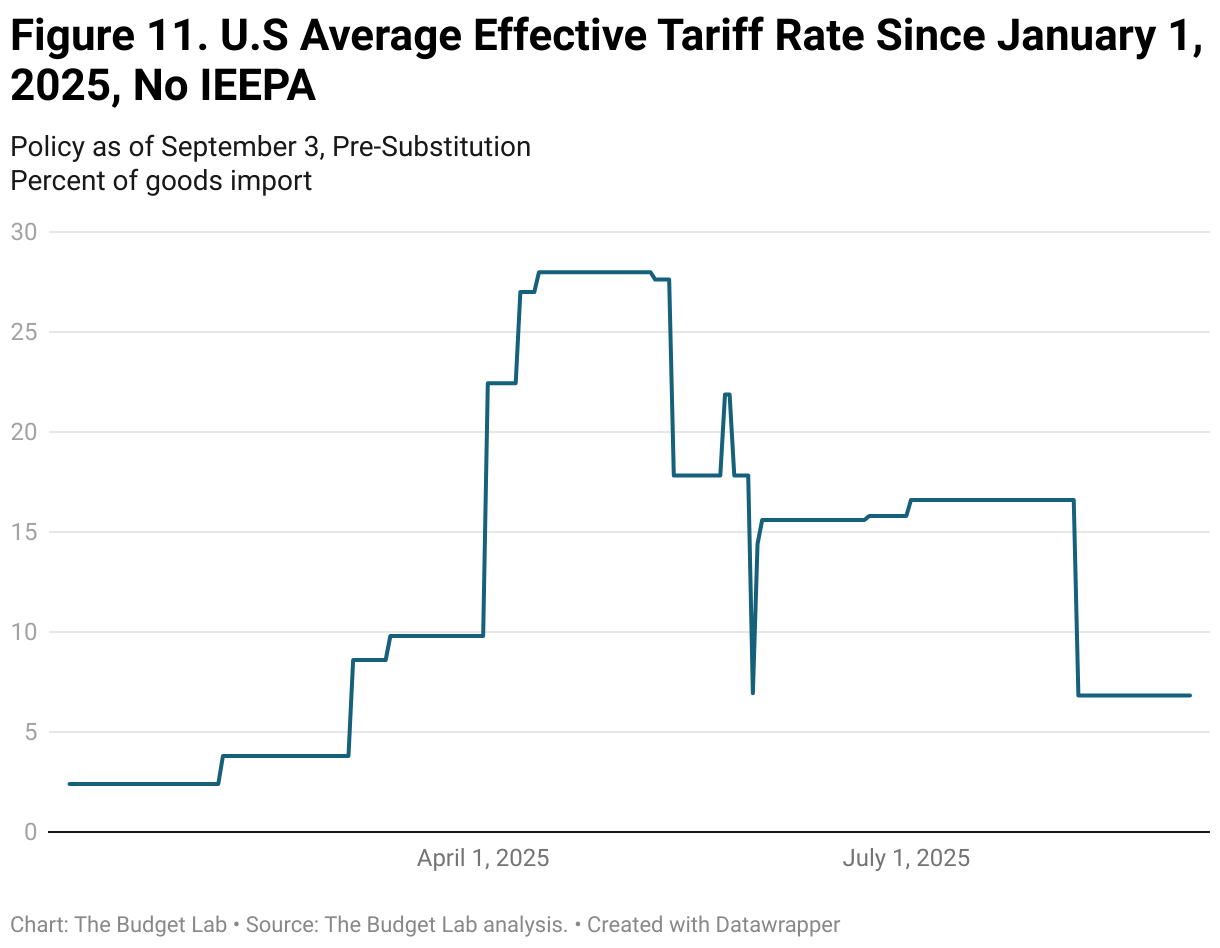
The effective tariff rate implied by policy has fluctuated substantially this year, starting at 2.4% in early January and peaking at 28% in the wake of the April 9 and 13 announcements.
Post-substitution—after imports shift in response to the tariffs—the 2025 tariffs are a 14 percentage point increase in the US average effective tariff rate, which brings the overall US effective tariff rate to 16.4%, the highest since 1936.
The timing of the transition from “pre” to “post” substitution is highly uncertain. Some shifts are likely to happen quickly—within days or weeks—while others may take longer.2
Average Aggregate Price Impact
The 2025 tariffs imply an increase in consumer prices of 1.7% in the short-run, assuming no policy reaction from the Federal Reserve and full passthrough of tariffs to consumers. As a result, TBL assumes the real income adjustment comes primarily through prices rather than nominal incomes. If the Federal Reserve reacted, the adjustment could in part come in the form of lower nominal incomes. This is a pre-substitution number that captures consumer welfare effects. It is the equivalent of a short-run income loss3 of $2,300 per household on average in 2025 dollars. The post-substitution price increase settles at 1.4%, a $1,900 short-run loss per household.
US Real GDP & Labor Market Effects
All 2025 US tariffs plus foreign retaliation lower real GDP growth by -0.51 pp each over calendar years 2025 and 2026 (Q4-Q4). The unemployment rate ends 2025 0.28 percentage point higher and 2026 0.65 percentage point higher, and payroll employment is 480,000 lower by the end of 2025. The level of real GDP remains persistently -0.4% smaller in the long run, the equivalent of $120 billion 2024$ annually, while exports are -15% lower.
Long-run US Sectoral Output & Employment Effects
Tariffs shrink the overall size of the US economy in the long-run by 0.4%, but beneath aggregate GDP they also drive reallocation across US sectors. Long-run output in the manufacturing sector expands by 2.7% under the tariffs, with nonadvanced durable manufacturing output 4.6% larger and nondurable manufacturing 1.8% larger. However, advanced manufacturing is down by 3.0%. Moreover, the expansion of the overall manufacturing sector more than crowds out the rest of the economy: construction contracts by 3.8%, agriculture by 0.1%, and mining & extraction by 1.6%.
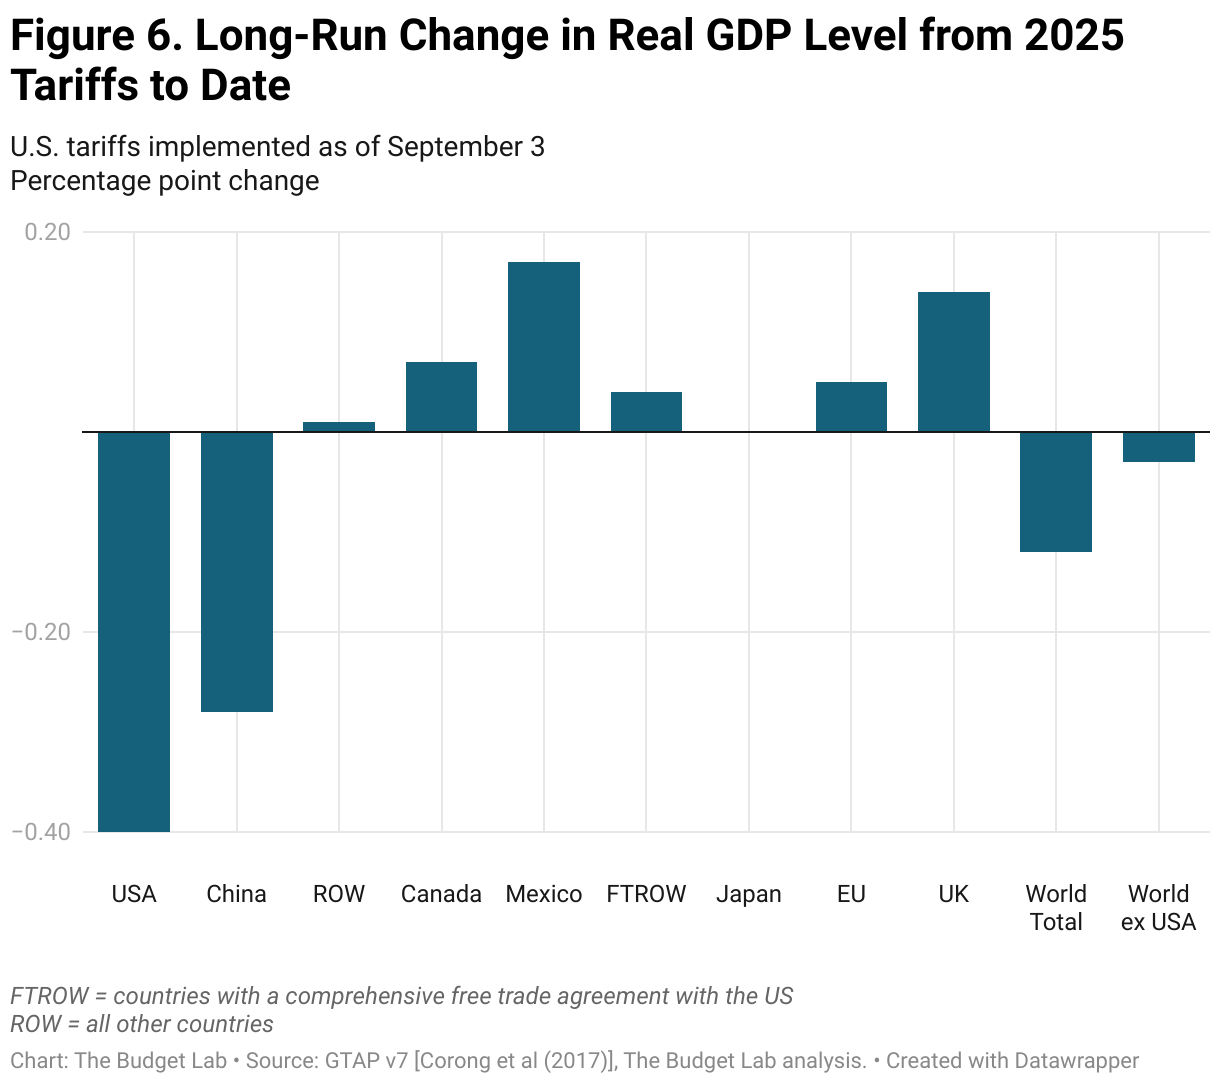
Global Long-run Real GDP Effects
With the suspension of most of Canada’s retaliatory tariffs against the US and TBL’s lower assumed effective tariff rate, Canada no longer bears the brunt of the economic damage from US tariffs so far: its long-run economy is 0.1% larger in real terms. China’s economy is -0.3% smaller, more than half as large as the hit to the US. The EU’s economy is 0.05 percentage point larger in the long-run, while the UK’s is 0.1% bigger thanks in part to the benefits of US-UK trade deal.
Fiscal Impact & Historical Context
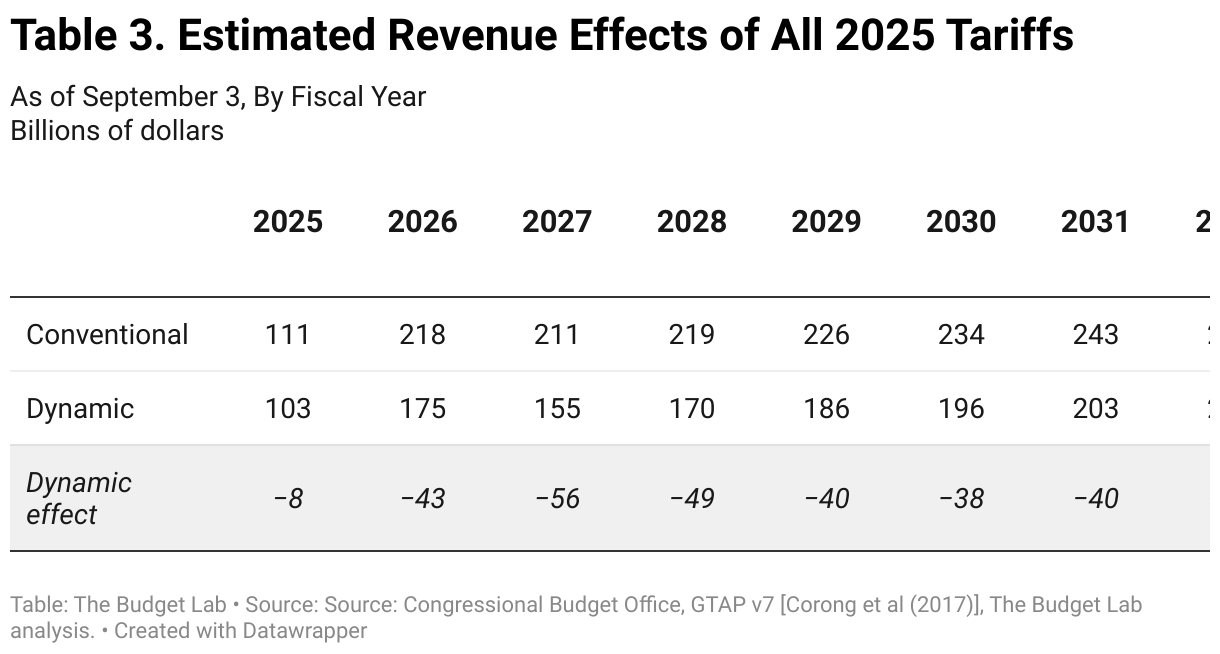
The 2025 tariffs to date, were they to remain in place, would raise $2.4 trillion over 2026-35 conventionally-scored ($2.3 trillion over 2025-34).4 Given the negative output effects of the tariffs, there would be additional dynamic reductions in tax revenue as a result. Based on Congressional Budget Office rules-of-thumb, TBL estimates that these effects would total -$454 billion over the decade (-$411 billion over 2025-34), bringing total dynamic revenue to $2.0 trillion over 2026-35 ($1.8 trillion over 2025-34).
Short-run Distributional Impact
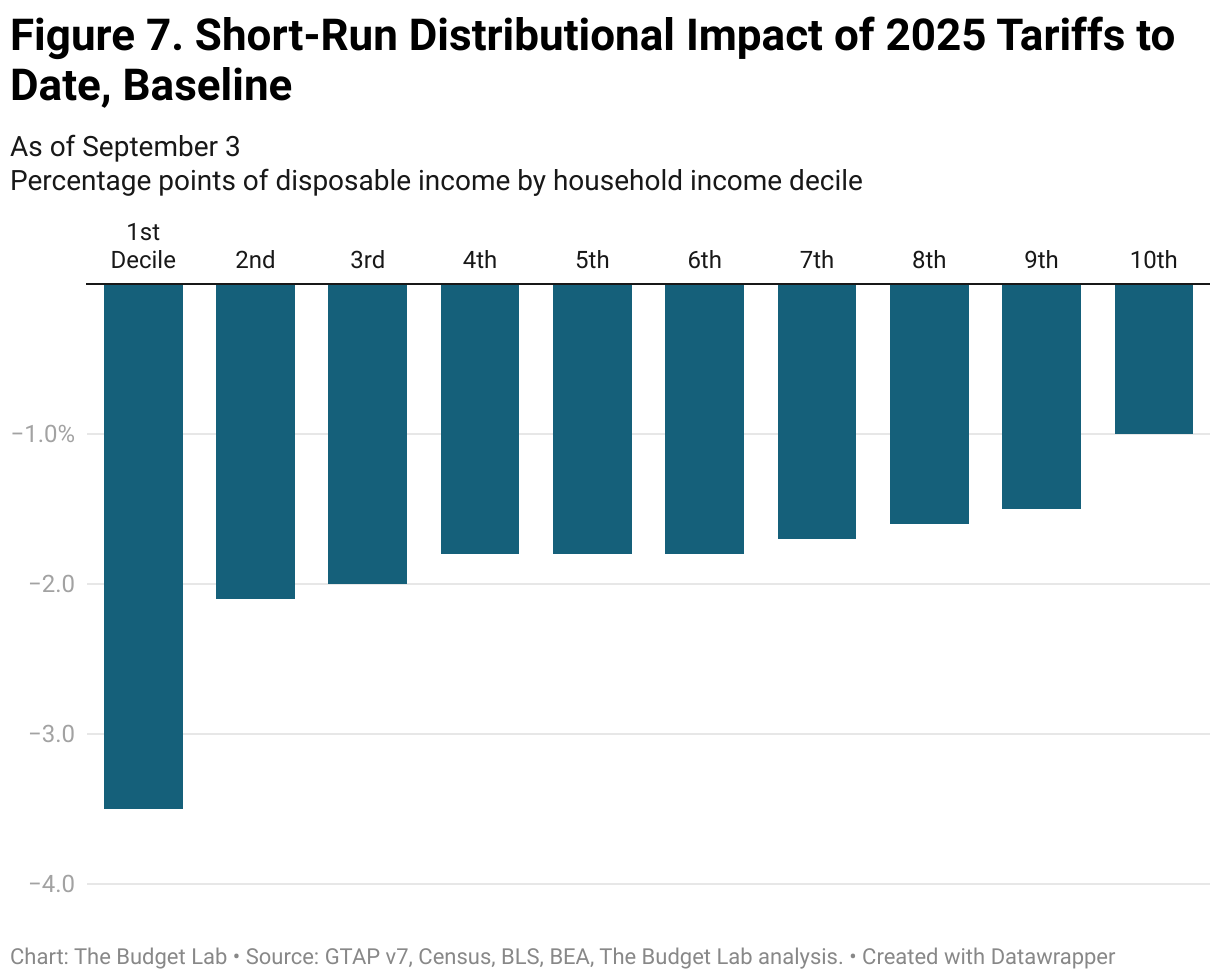
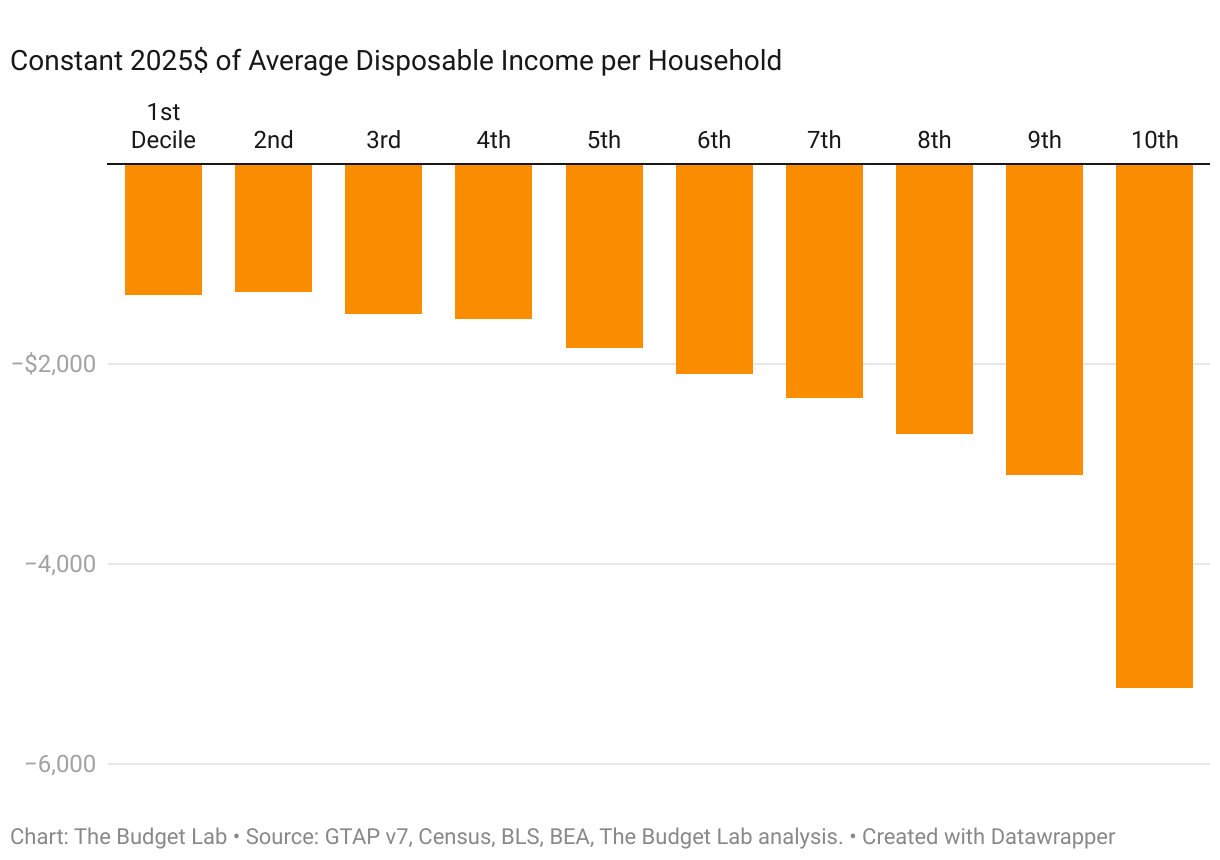
Tariffs are a regressive tax, especially in the short-run. This means that tariffs burden households at the bottom of the income ladder more than those at the top as a share of income. The regressivity is about the same when looking at all 2025 tariffs: the short-run burden on the first decile is more than three times that of the top decile (-3.5% versus -1.0%). The average annual cost to households in the first and top decile rise to $1,300 and $5,200 respectively in 2025$. The median cost is $2,000 per household.
Tariffs are more distributionally-ambiguous in the longer-run. Tariffs reduce both labor income and above-normal returns to capital, or rents. We assume that owners of capital hold rents rather than consume them in the short-run, but do consume them over their lifecycle in the long-run. The implication is that the tariff burden is more regressive in the short-run and more evenly-distributed across households in the long-run.
Commodity Price Effects
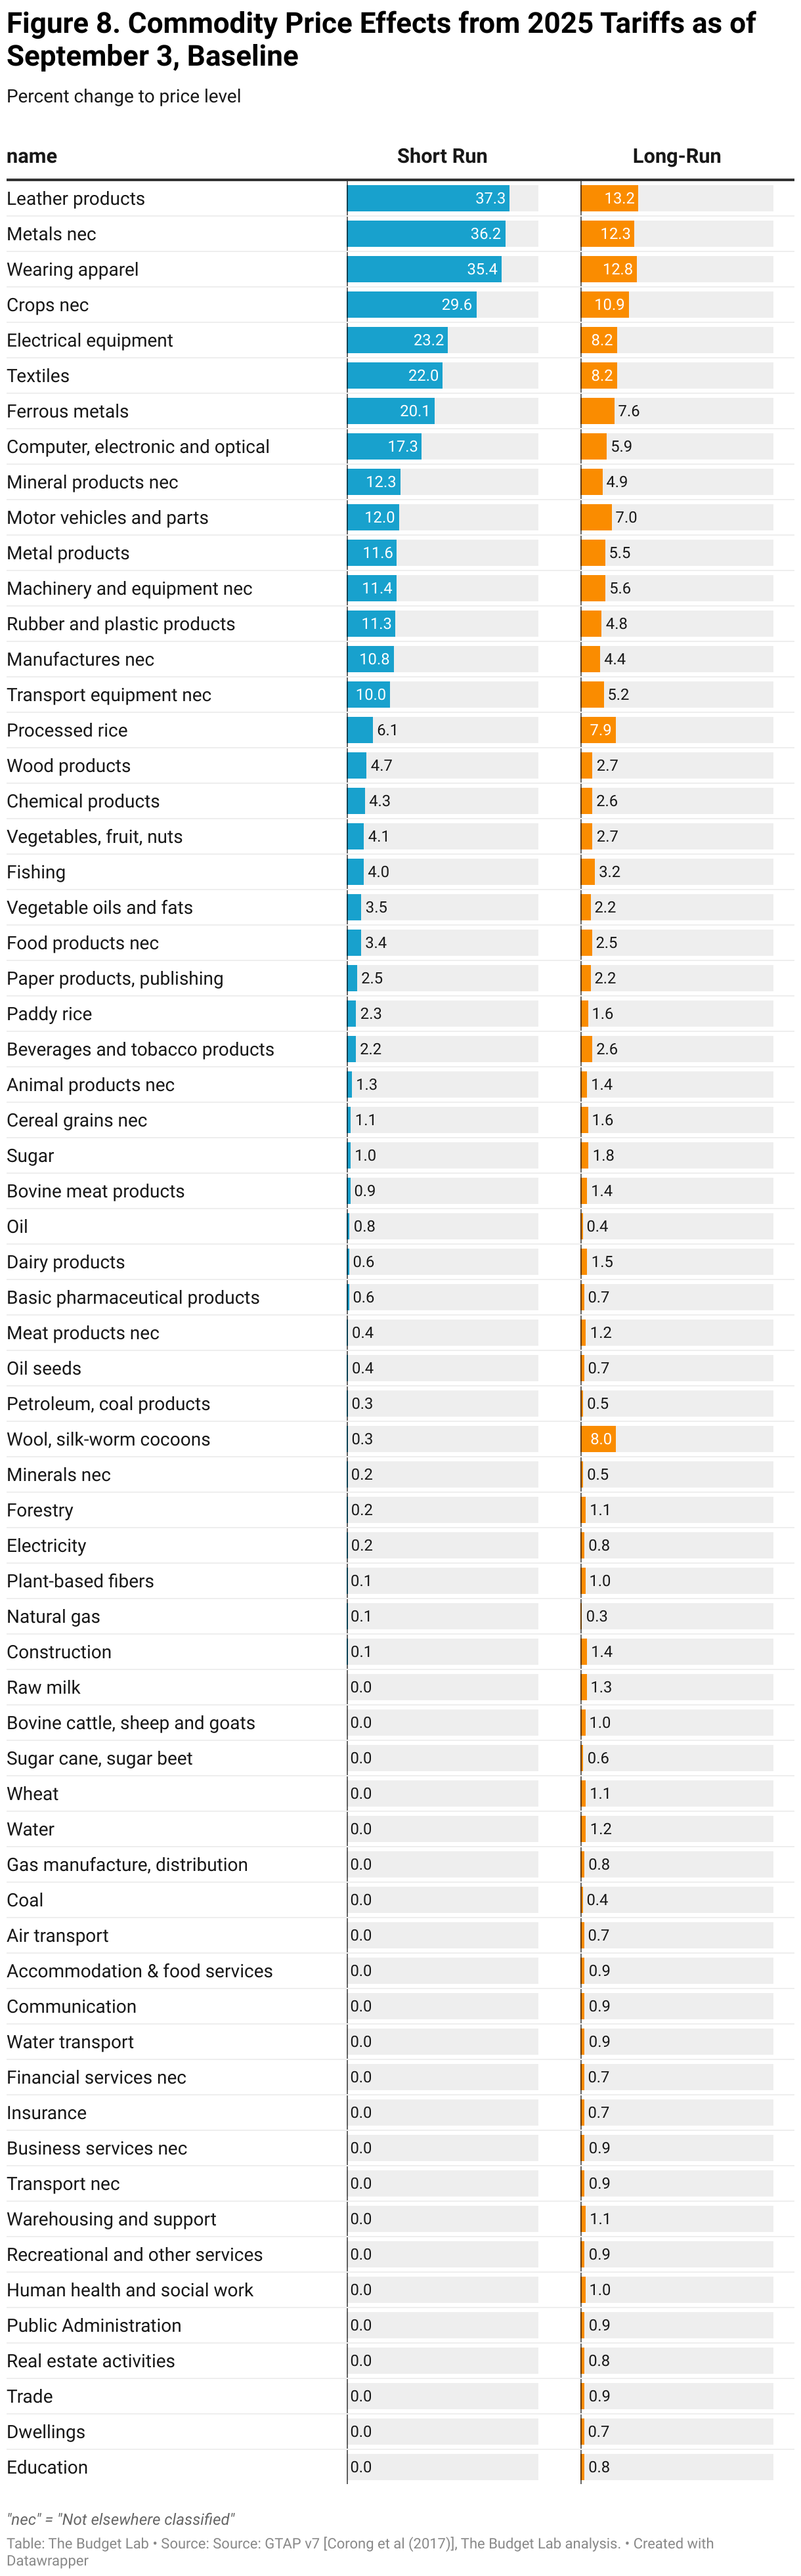
The charts below show how the 1.7% price level increase from the 2025 tariffs to date would look across individual commodities in the short-run (pre-substitution), as well as the 1.4% long-run price increase (post-substitution). Some high level takeaways:
- Consumers face particularly high increases in leather and clothing in the short-run: prices increase 37.3% for leather products (shoes and hand bags), 36.2% for apparel, and 22% for textiles. After substitution and global supply shifts in the long-run, prices remain 13.2%, 12.8%, and 8.2% higher, respectively.
- Food prices rise 3.4% in the short-run and stay 2.5% higher in the long-run. Fresh produce is initially 4.1% more expensive while stabilizing at 2.7% higher.
- Motor vehicle prices rise 12% in the short-run and 7% in the long-run, the equivalent of an additional $5,800 and $3,400 respectively to the price of an average 2024 new car.
No IEEPA Scenario Results
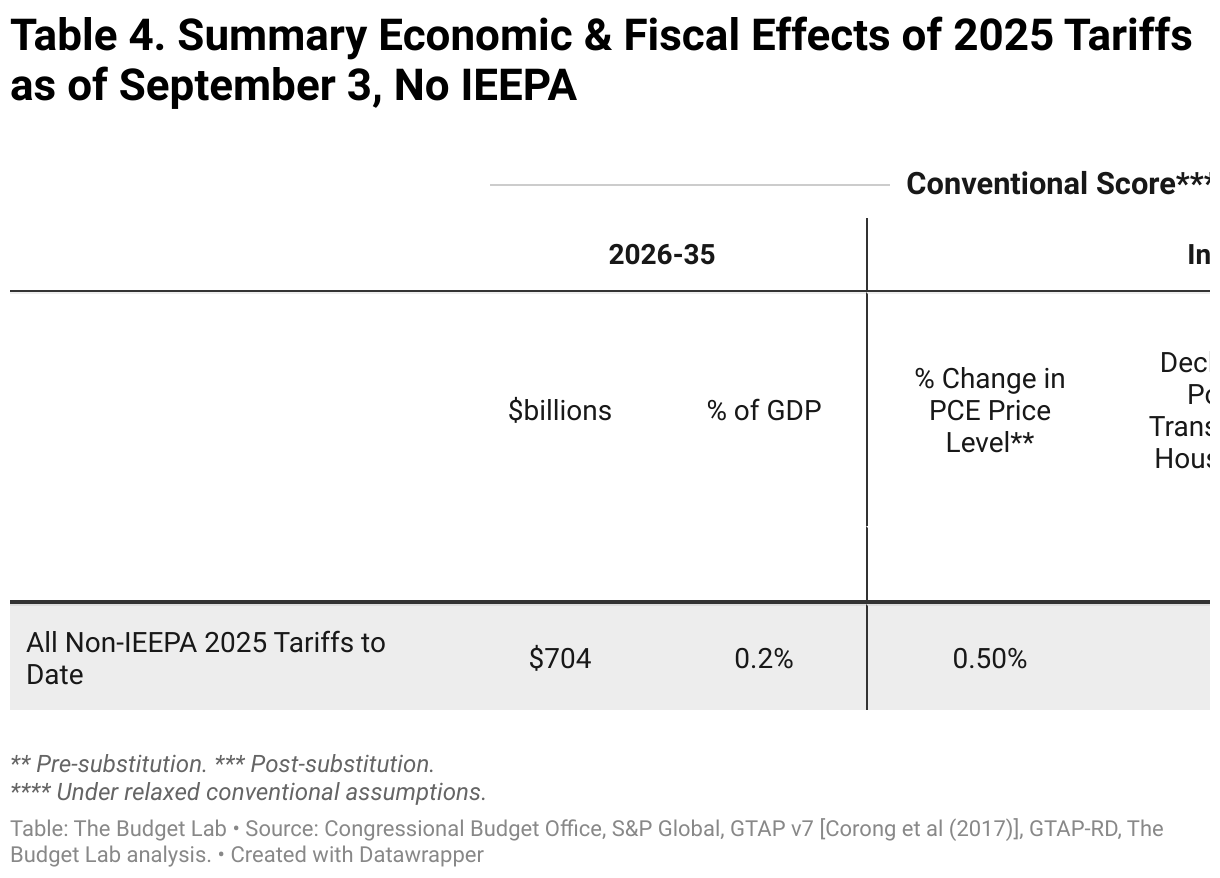
The table below summarizes the effects of the invalidation of IEEPA tariffs in June 2026, assuming the remaining tariffs in place as of September 3 (primarily ones authorized under Section 232) stay in force indefinitely.
Average Effective Tariff Rate
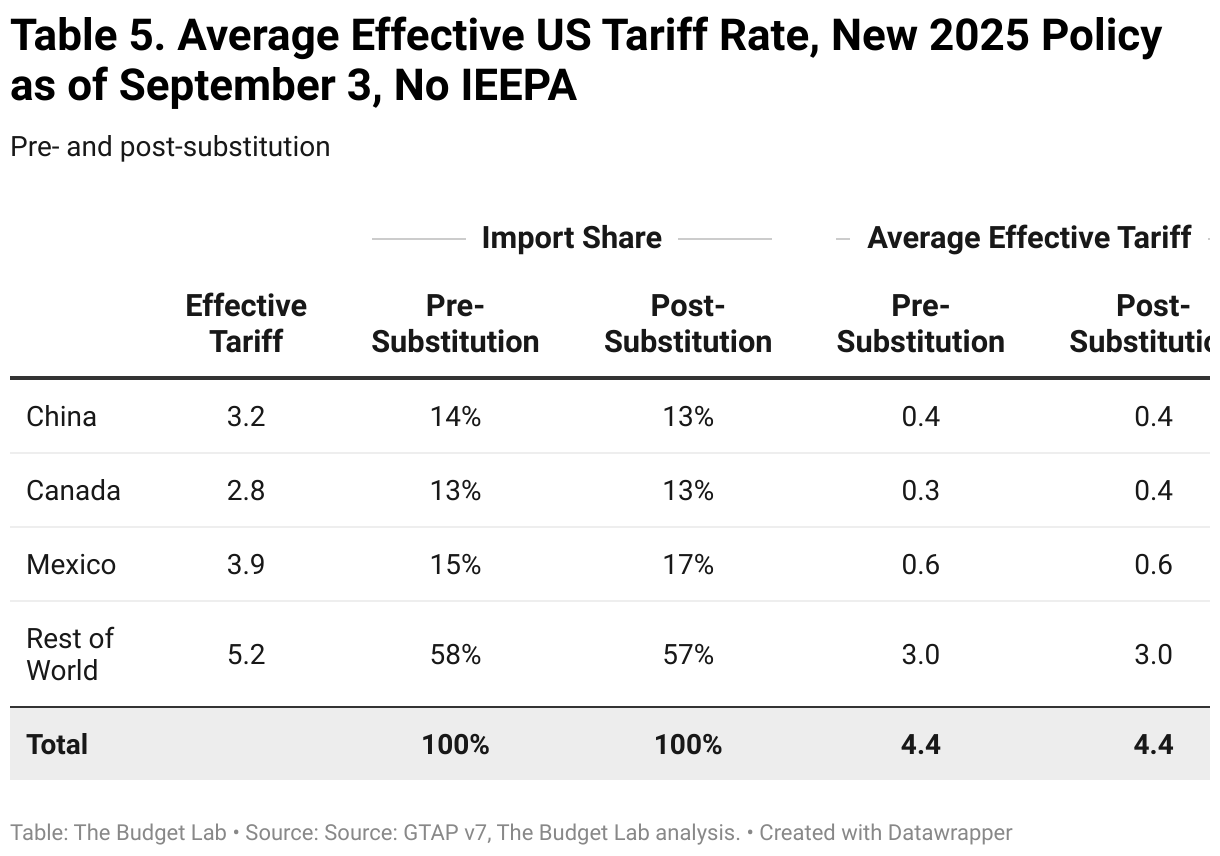
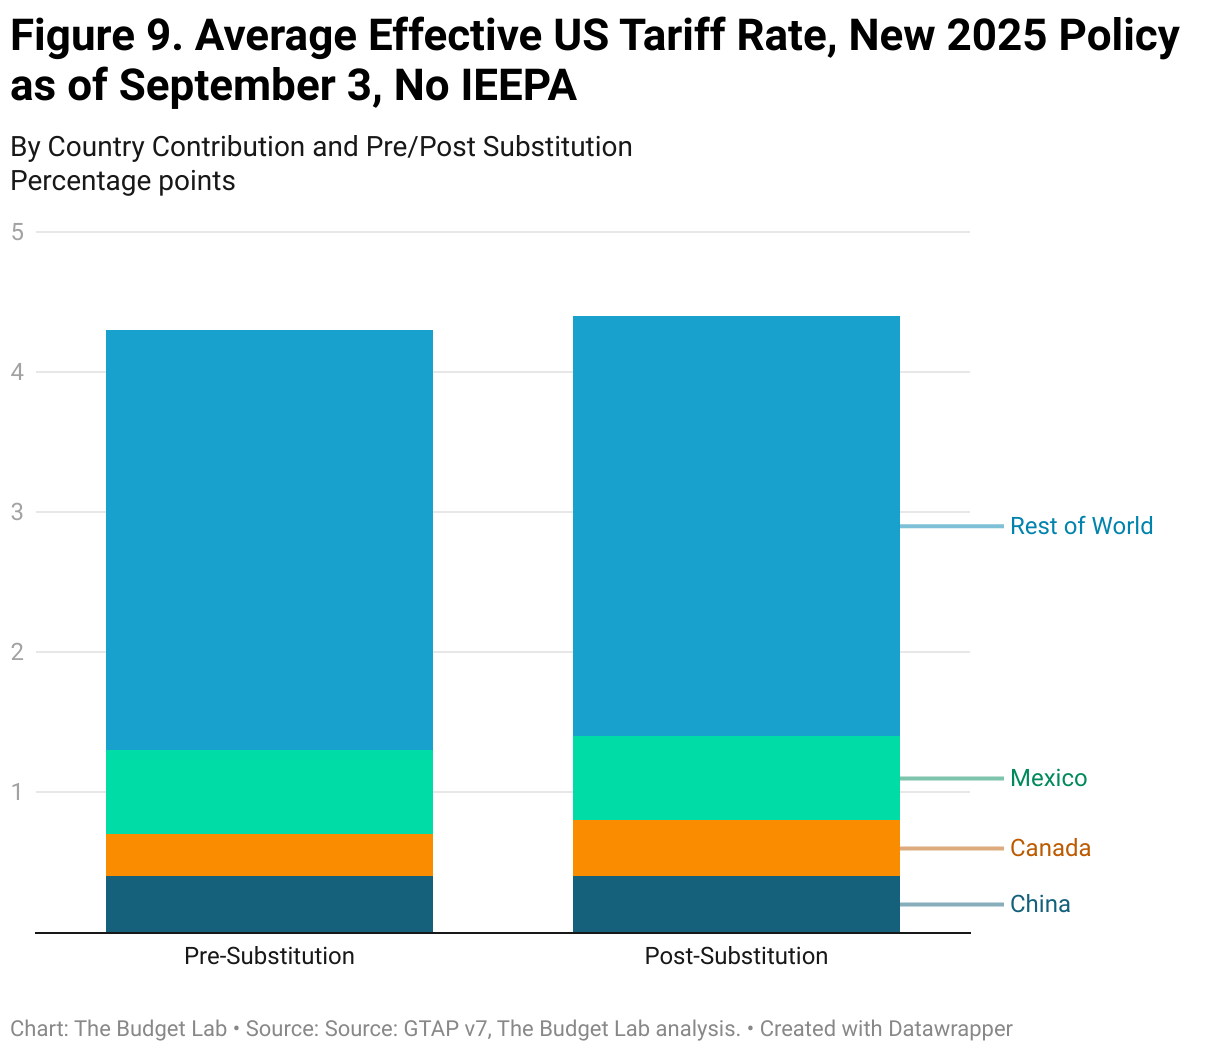
Measured pre-substitution—assuming there are no shifts in the import shares of different countries—the 2025 tariffs to date are the equivalent of a 4.4 percentage point increase in the US average effective tariff rate, which brings the overall US effective tariff rate to 6.8%, the highest since 1969.
Post-substitution—after imports shift in response to the tariffs—the 2025 tariffs are a 4.4 percentage point increase in the US average effective tariff rate, which brings the overall US effective tariff rate to 6.8%, the highest since 1969.
Average Aggregate Price Impact
The 2025 tariffs imply an increase in consumer prices of 0.5% in the short-run, assuming no policy reaction from the Federal Reserve and full passthrough of tariffs to consumers. This is a pre-substitution number that captures consumer welfare effects. It is the equivalent of a short-run income loss5 of $663 per household on average in 2025 dollars. The post-substitution price increase settles at 0.5%, a $642 short-run loss per household.
US Real GDP & Labor Market Effects
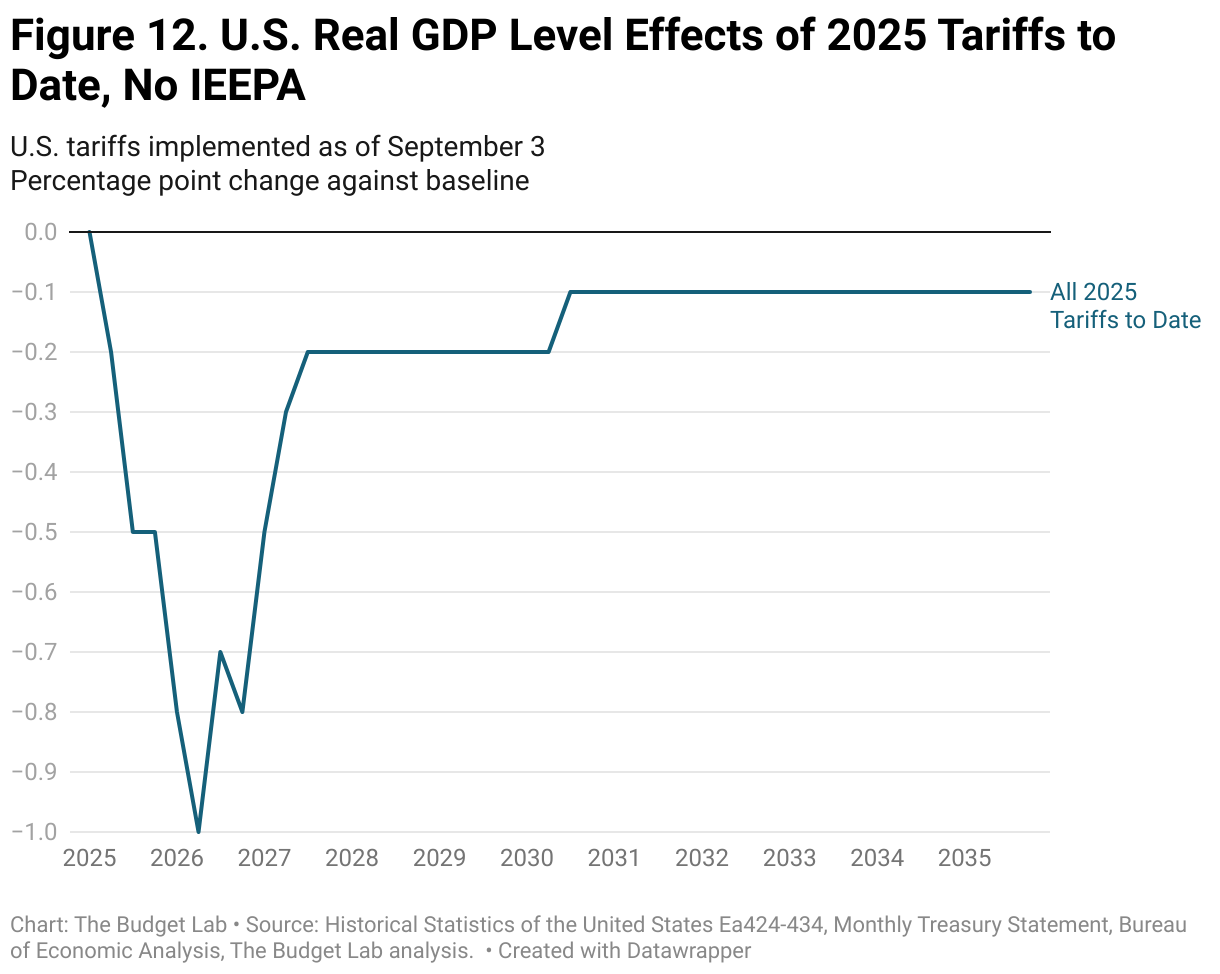
All 2025 US tariffs plus foreign retaliation lower real GDP growth by -0.5 pp each over calendar years 2025 and 2026 (Q4-Q4). The unemployment rate ends 2025 0.3 percentage point higher and 2026 0.5 percentage point higher, and payroll employment is 480,000 lower by the end of 2025. The level of real GDP remains persistently -0.1% smaller in the long run, the equivalent of $25 billion 2024$ annually, while exports are -4.4% lower.
Long-run US Sectoral Output & Employment Effects
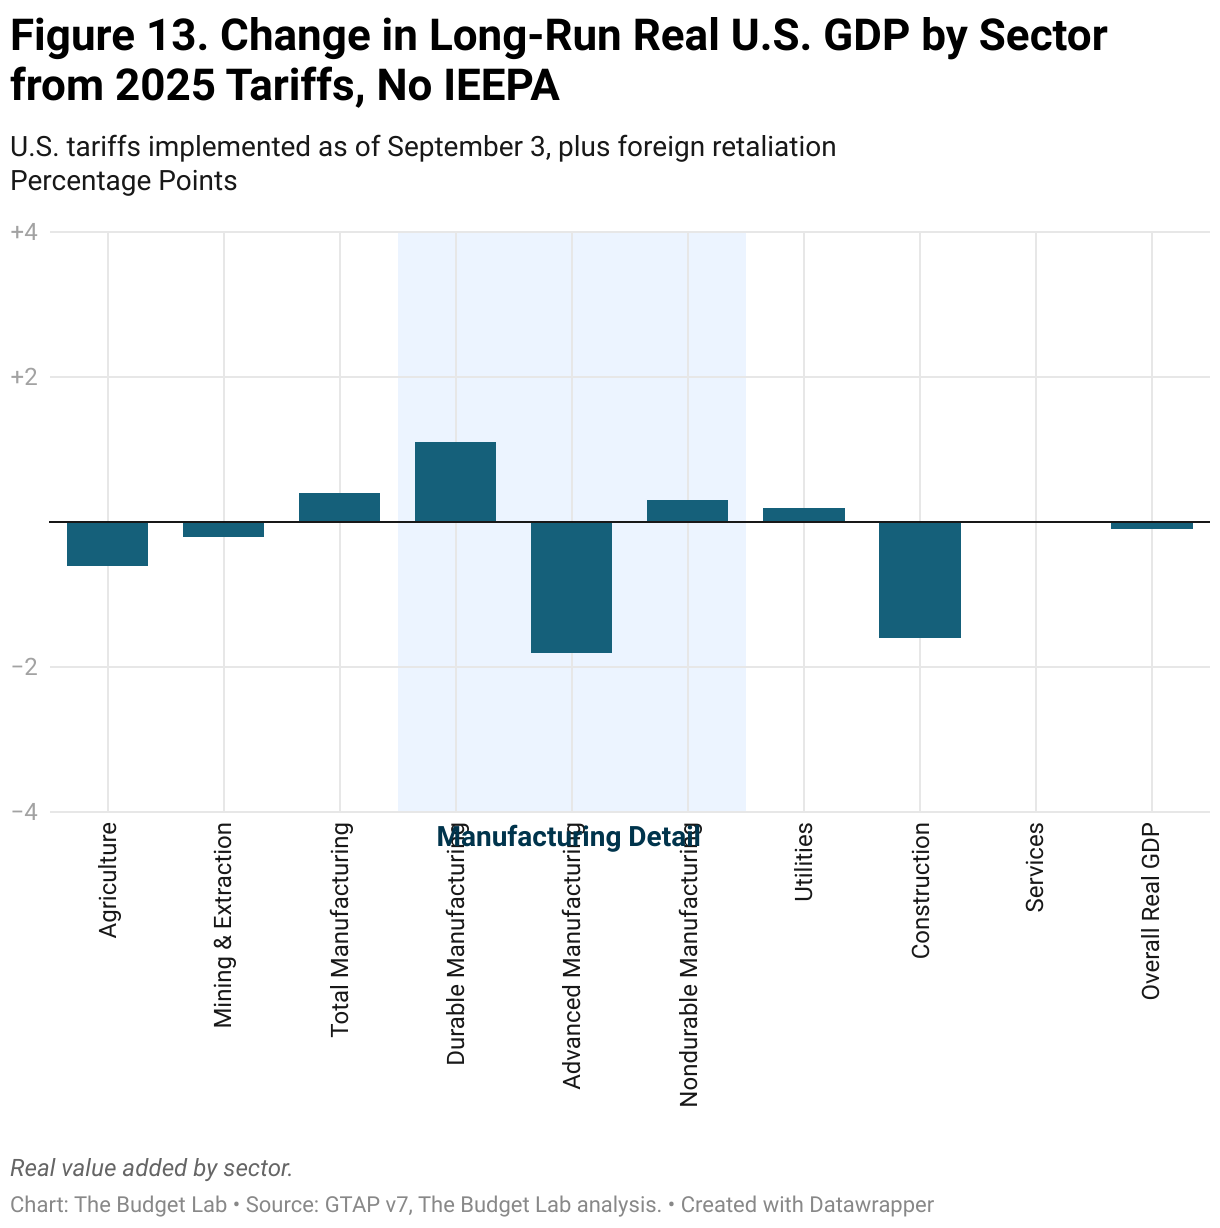
Tariffs shrink the overall size of the US economy in the long-run by 0.1%, but beneath aggregate GDP they also drive reallocation across US sectors. Long-run output in the manufacturing sector expands by 0.5% under the tariffs, with nonadvanced durable manufacturing output 1.1% larger and nondurable manufacturing 0.3% larger. However, advanced manufacturing is down by 1.8%. Moreover, the expansion of the overall manufacturing sector more than crowds out the rest of the economy: construction contracts by 1.6%, agriculture by 0.6%, and mining & extraction by 0.2%.
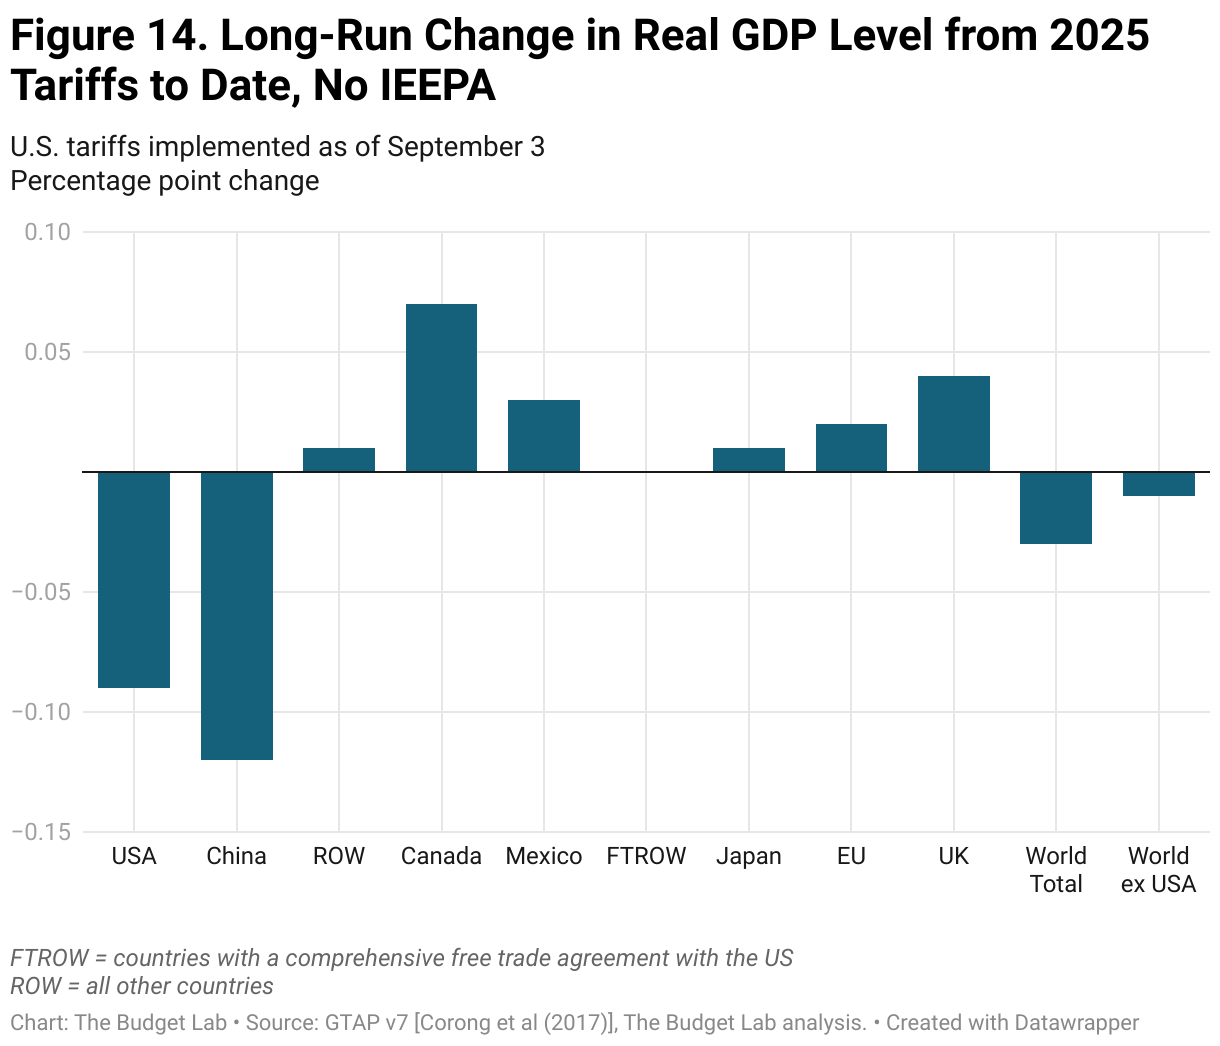
Global Long-run Real GDP Effects
With the suspension of most of Canada’s retaliatory tariffs against the US and TBL’s lower assumed effective tariff rate, Canada no longer bears the brunt of the economic damage from US tariffs so far: its long-run economy is 0.1% larger in real terms. China’s economy is -0.1% smaller, roughly half as large as the hit to the US. The EU’s economy is 0.02 percentage point larger in the long-run, while the UK’s is 0.04% bigger thanks in part to the benefits of US-UK trade deal.
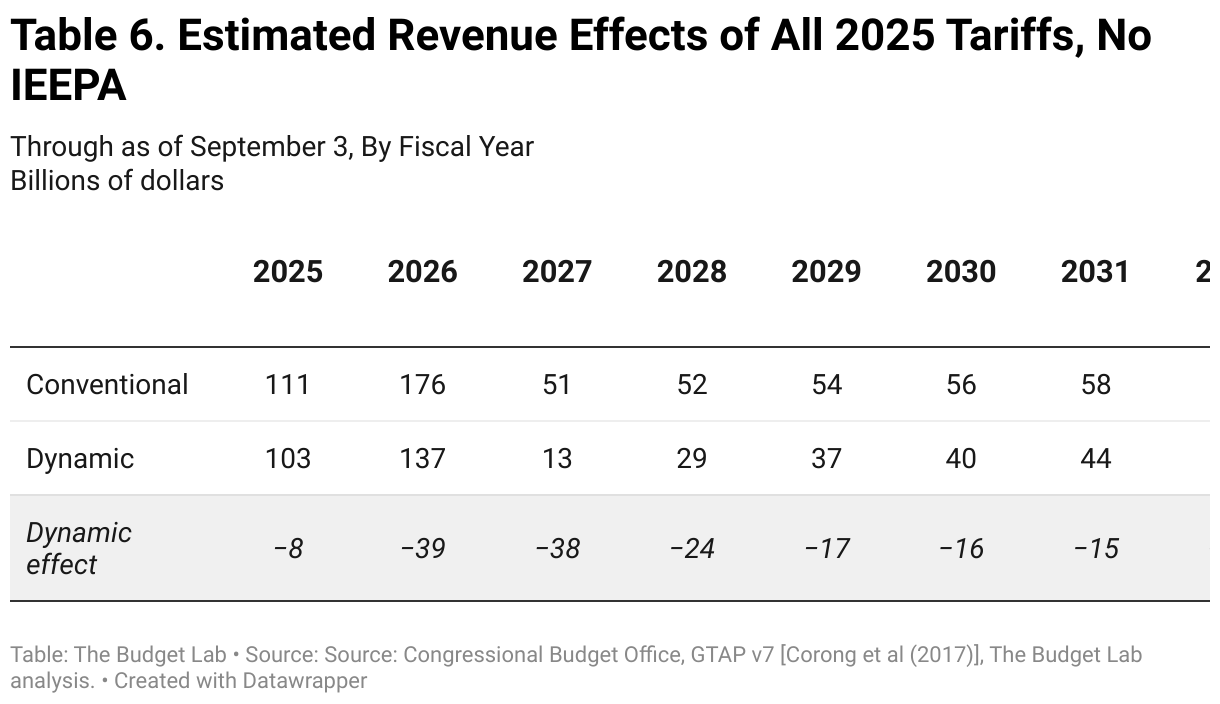
Fiscal Impact & Historical Context
The 2025 tariffs to date, were they to remain in place, would raise $0.70 trillion over 2026-35 conventionally-scored ($0.75 trillion over 2025-34).6 Given the negative output effects of the tariffs, there would be additional dynamic reductions in tax revenue as a result. Based on Congressional Budget Office rules-of-thumb, TBL estimates that these effects would total -$211.2 billion over the decade (-$202.4 billion over 2025-34), bringing total dynamic revenue to $0.5 trillion over 2026-35 ($0.6 trillion over 2025-34).
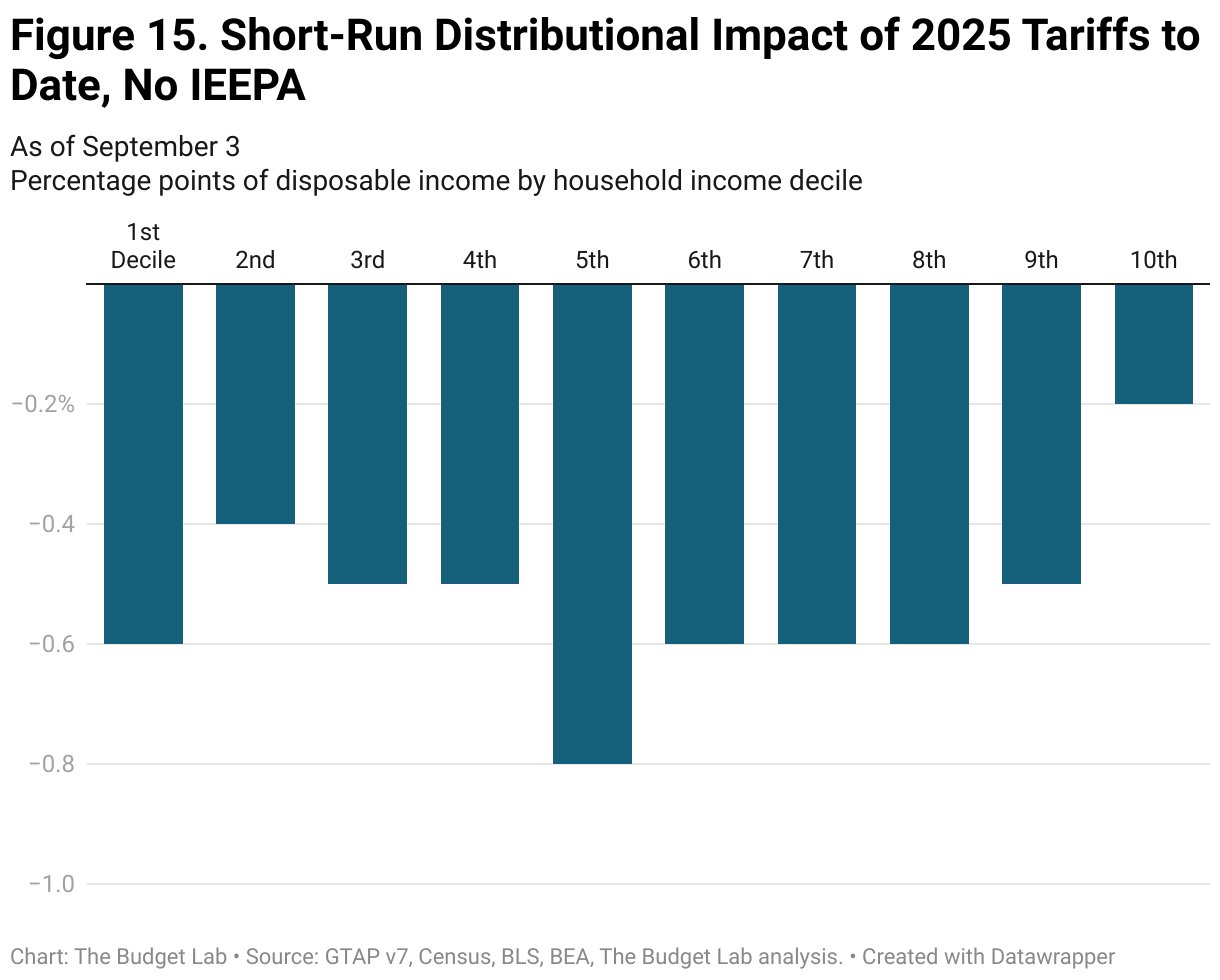
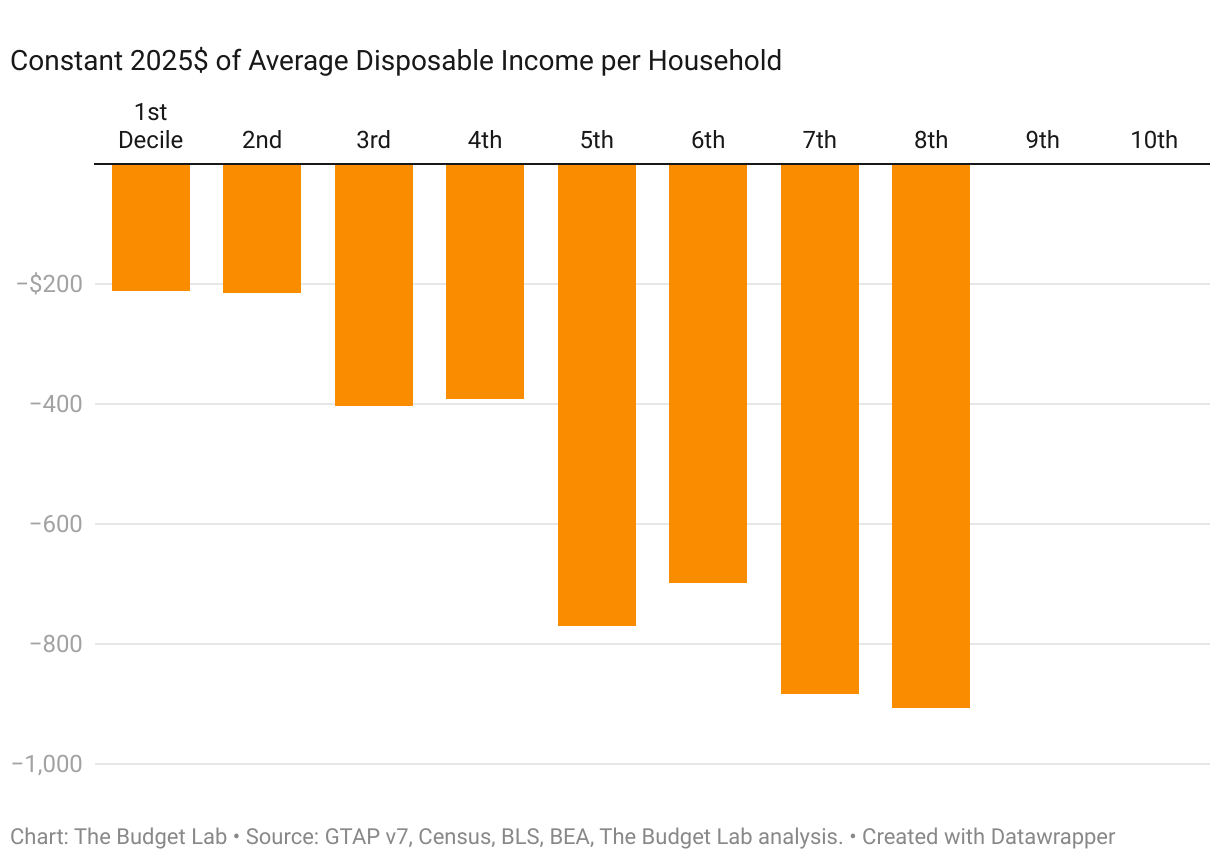
Short-run Distributional Impact
Tariffs are a regressive tax, especially in the short-run. This means that tariffs burden households at the bottom of the income ladder more than those at the top as a share of income. The regressivity is about the same when looking at all 2025 tariffs: the short-run burden on the first decile is more than three times that of the top decile (-0.6% versus -0.2%). The average annual cost to households in the first and top decile rise to $211.4 and $1049 respectively in 2025$. The median cost is $734 per household.
Tariffs are more distributionally-ambiguous in the longer-run. Tariffs reduce both labor income and above-normal returns to capital, or rents. We assume that owners of capital hold rents rather than consume them in the short-run, but do consume them over their lifecycle in the long-run. The implication is that the tariff burden is more regressive in the short-run and more evenly-distributed across households in the long-run.
Commodity Price Effects
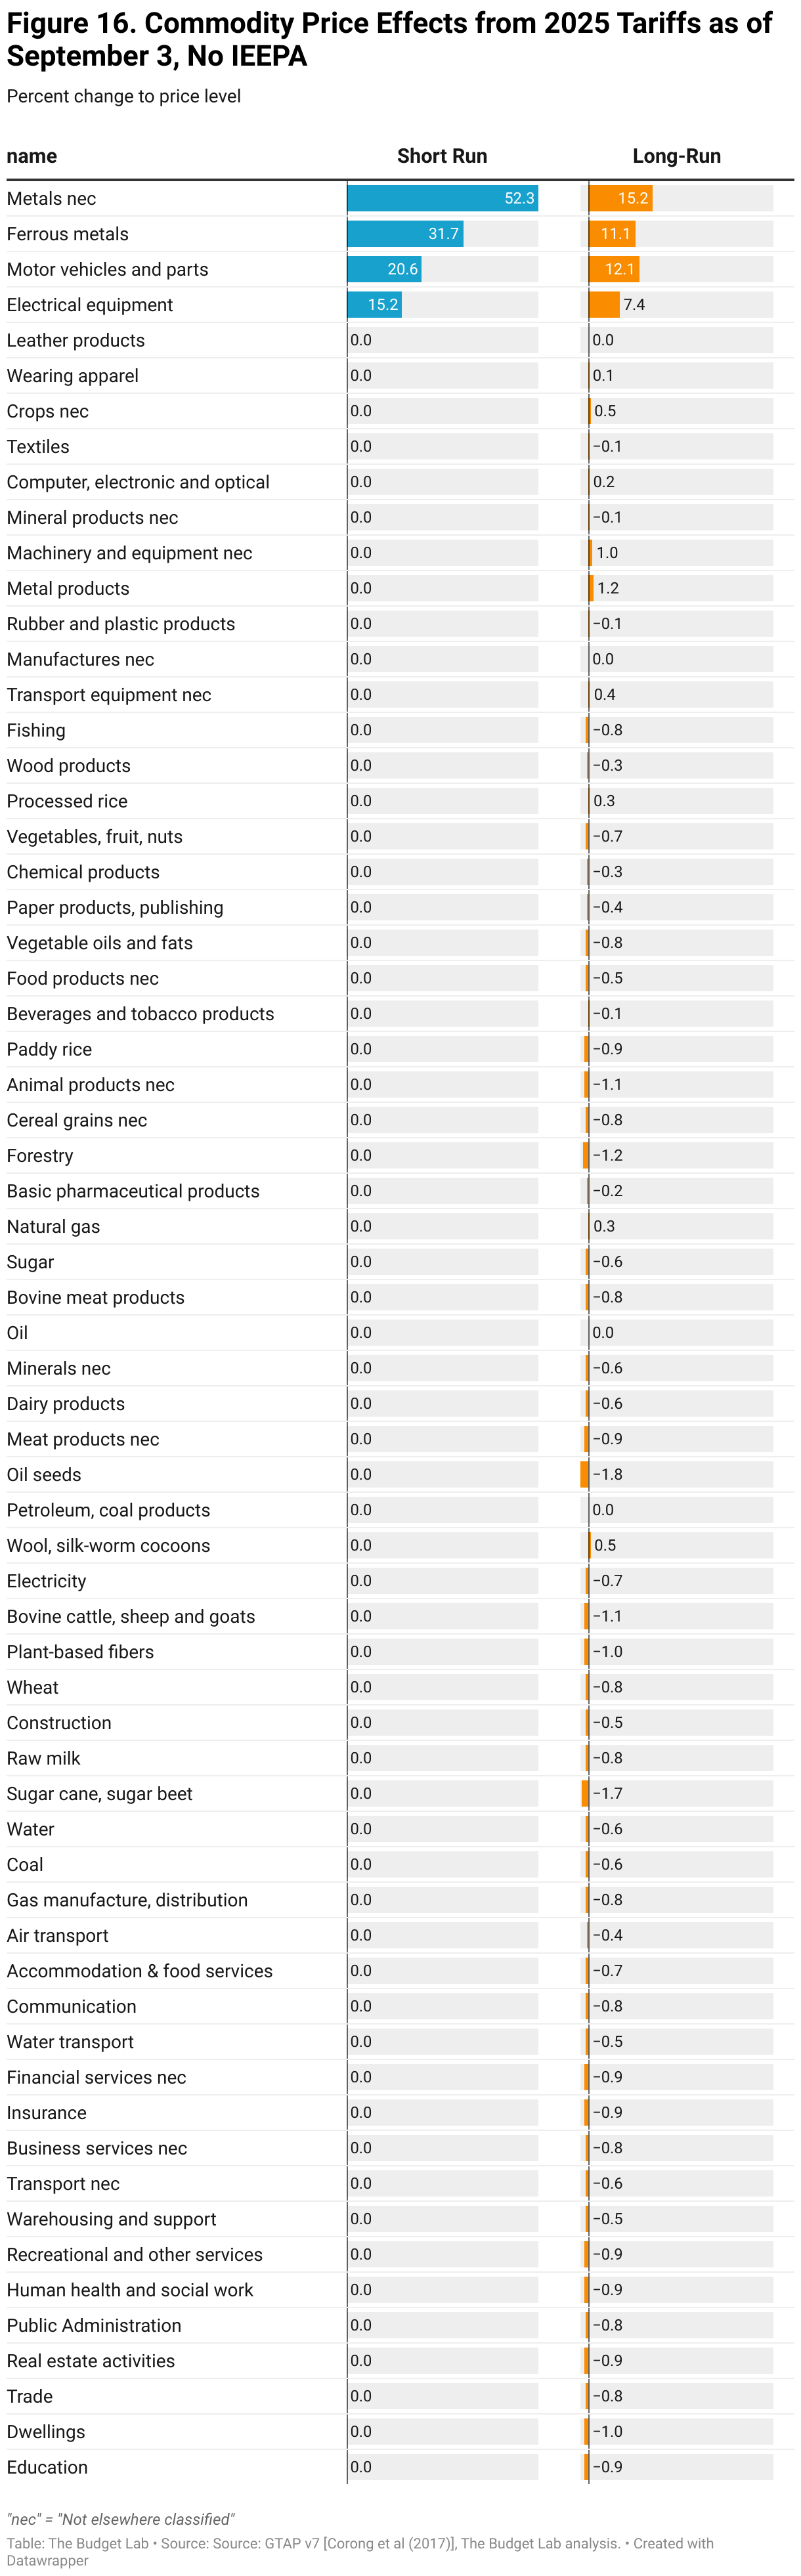
The charts below show how the 0.5% price level increase from the 2025 tariffs to date would look across individual commodities in the short-run (pre-substitution), as well as the 0.5% long-run price increase (post-substitution). Some high level takeaways:
- Consumers face particularly high increases in metals and ferrous metals: prices increase 052.3% for metal products and 31.7% for ferrous metals. After substitution and global supply shifts in the long-run, prices remain 15.2% and 11.1% higher, respectively.
- Electrical equipment prices rise 15.2% in the short-run and stay 7.4% higher in the long-run.
- Motor vehicle prices rise 20.6% in the short-run and 12.1% in the long-run, the equivalent of an additional $10,000 and $5,800 respectively to the price of an average 2024 new car.
Footnotes
- Estimating the likelihood of such a scenario—with both a sweeping Supreme Court decision and no replacement of the IEEPA tariffs with tariffs under a different legal authority—is beyond the purview of this report. However, there are several non-IEEPA statutes that explicitly authorize the imposition of tariffs under certain criteria. Some, like Section 232 of the Trade Expansion Act of 1962 and Section 301 of the Trade Act of 1974, have already been used by this and prior administrations to impose tariffs, but come with specific conditions and criteria. Others, like Section 338 of the Tariff Act of 1930 and Section 122 of the Trade Act of 1974, have fewer limitations but are hitherto unprecedented as justifications for tariffs.
- TBL assumes throughout its tariff analysis that the transition to longer-run GTAP equilibria occurs after three years.
- TBL defines “income” as CBO-concept post-tax-and-transfer income. “Short-run” refers to the effect over the next couple of years; TBL proxies for this definition by using CBO projections of the distribution of income in 2027, expressed in 2025 dollars.
- TBL employs a “relaxed conventional” assumption for the retaliation scenario, whereby foreign income is permitted to fall but US income remains fixed.