
State of U.S. Tariffs: October 30, 2025
Key Takeaways
-
The Budget Lab (TBL) estimates the effects of all US tariffs and foreign retaliation implemented in 2025 through October 30, including the reported cut to tariffs on Chinese imports and the new tariffs on medium- and heavy-duty vehicles and buses. This report looks at two scenarios: one where these tariff policies remain in effect in perpetuity, and another where the IEEPA tariffs are invalidated and refunded after the Supreme Court decision and are not replaced under other authorities.
-
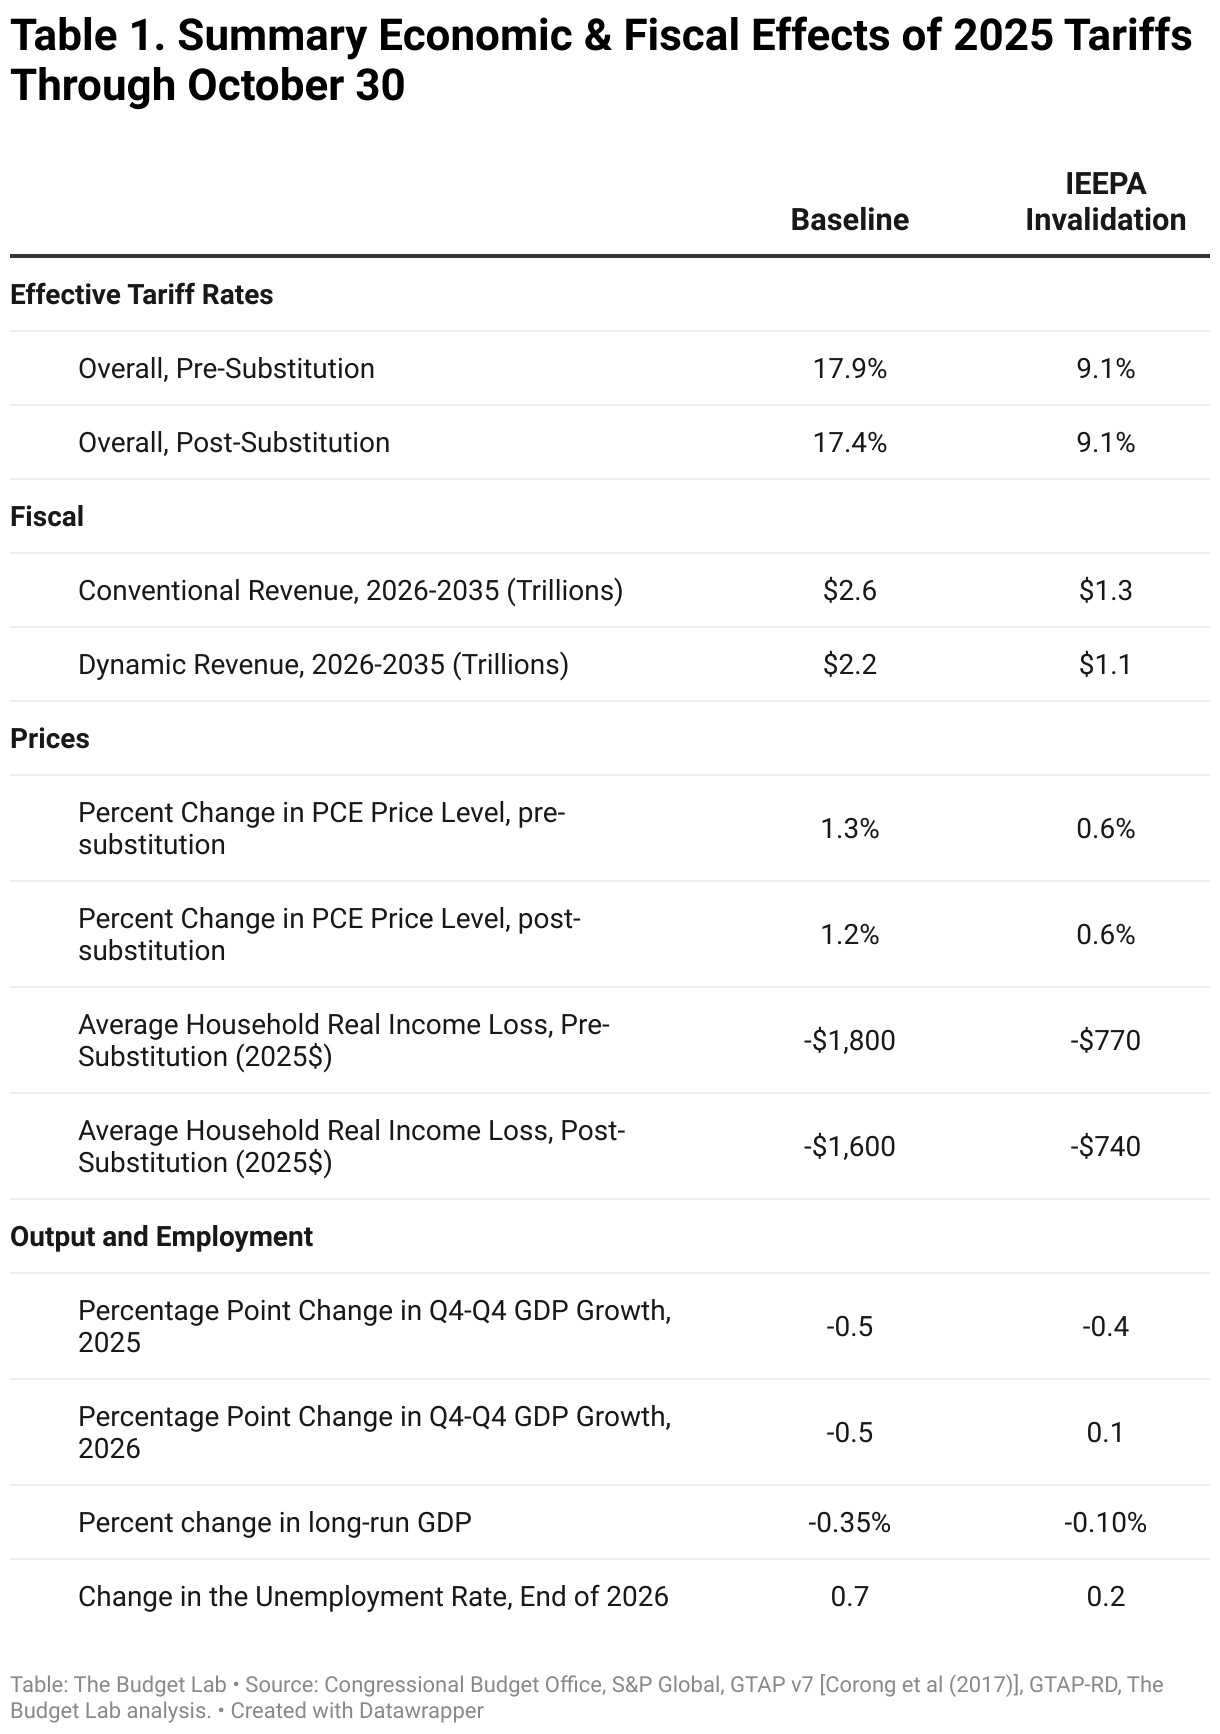
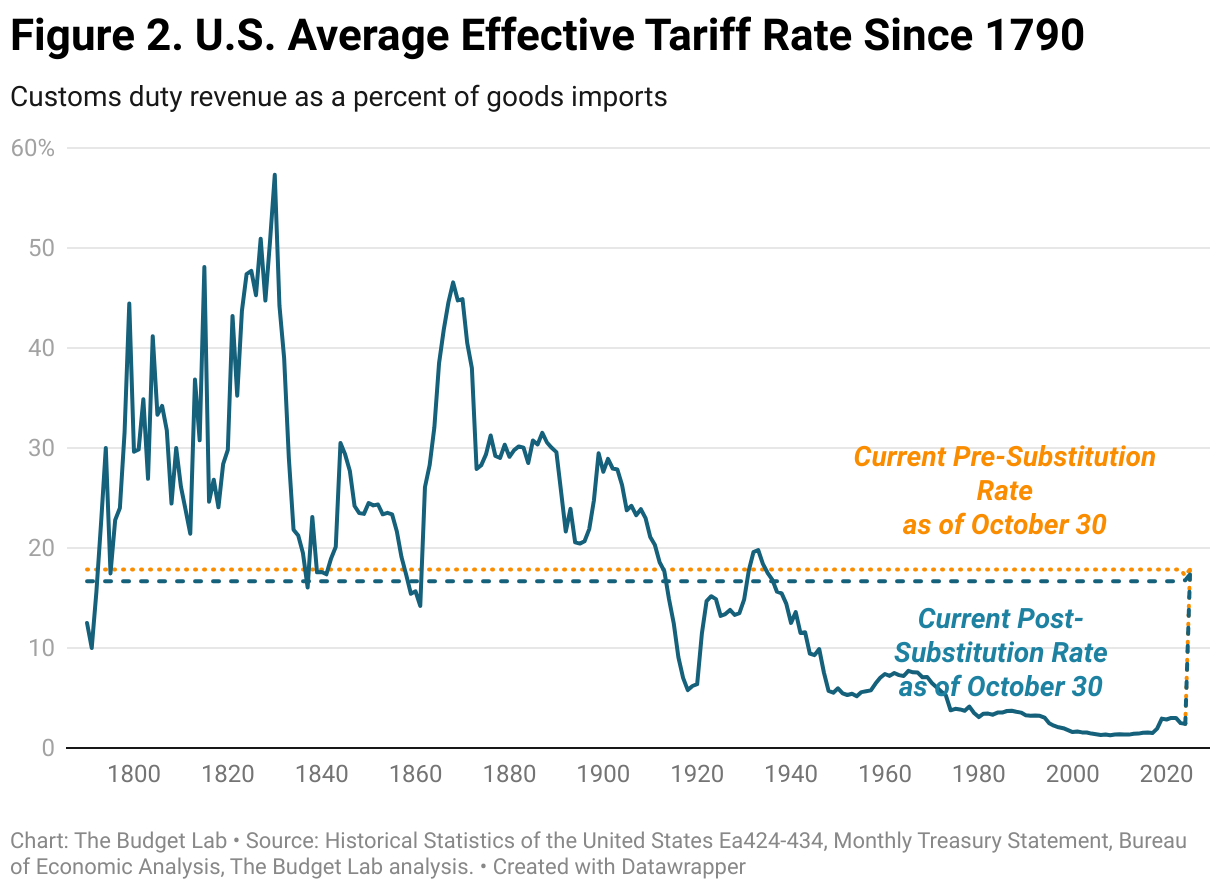
Current Tariff Rate: Consumers face an overall average effective tariff rate of 17.9%, the highest since 1934. After consumption shifts, the average tariff rate will be 17.4%. (If IEEPA tariffs are invalidated, the rate would be 9.1%.)
-
Overall Price Level & Distributional Effects: TBL assumes the Federal Reserve “looks through” the tariffs and allows prices to rise such that the tax burden is felt through prices rather than nominal incomes. The price level rises by 1.3% in the short run, representing a loss of $1,800 for the average household and $1,000 for households at the bottom of the income distribution. (Without IEEPA, the price level impact would instead be 0.6%.)
-
Commodity Prices: The 2025 tariffs fall most heavily on apparel, products with high metal content like electrical equipment and computers, and motor vehicles. (If IEEPA tariffs are invalidated, the burden on apparel and related products would largely be relieved.)
-
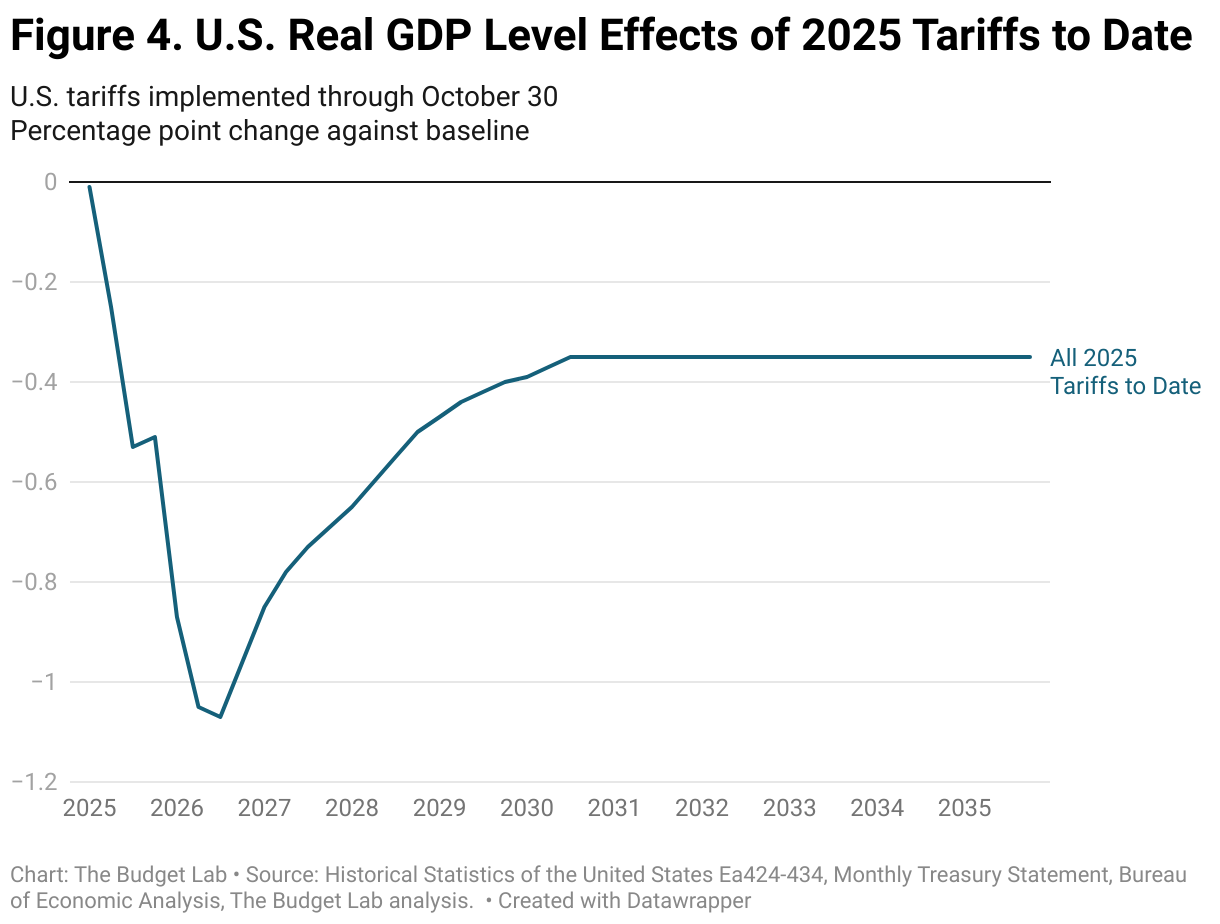
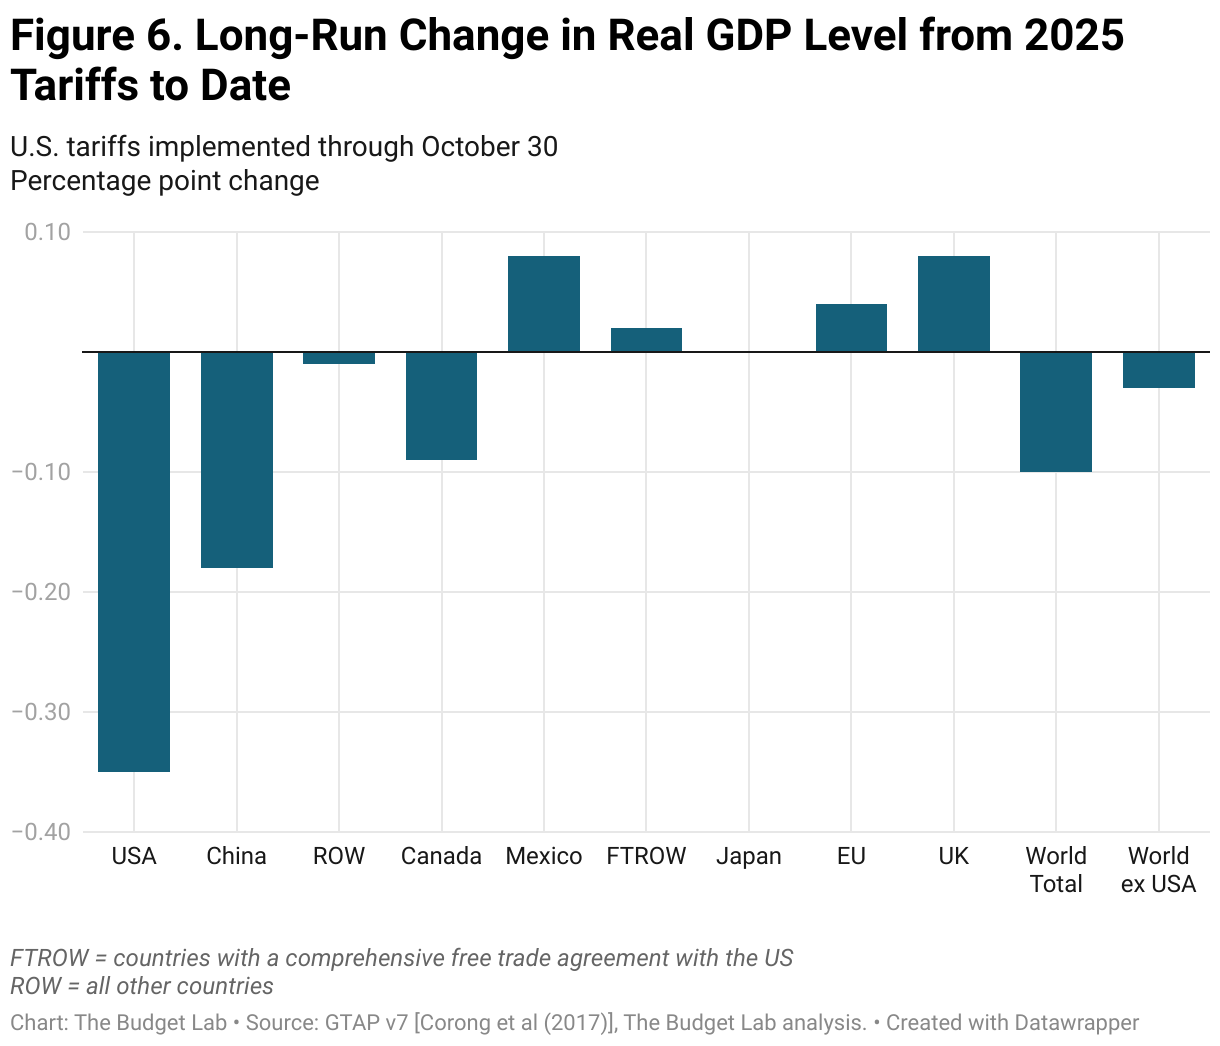
Real GDP Effects: Tariffs slow US real GDP growth by 0.5 pp in both 2025 and 2026. In the long run, the US economy is persistently 0.35% smaller, the equivalent of $105 billion annually in 2024$. (If IEEPA tariffs are invalidated, the long-run hit to output is instead 0.1%.)
-
Labor Market Effects: The unemployment rate rises 0.3 percentage points by the end of 2025 and 0.7 percentage points by the end of 2026. Payroll employment is about 490,000 lower by the end of 2025. (If IEEPA tariffs are struck down and collections are refunded, the 2026 hit to employment would be smaller.)
-
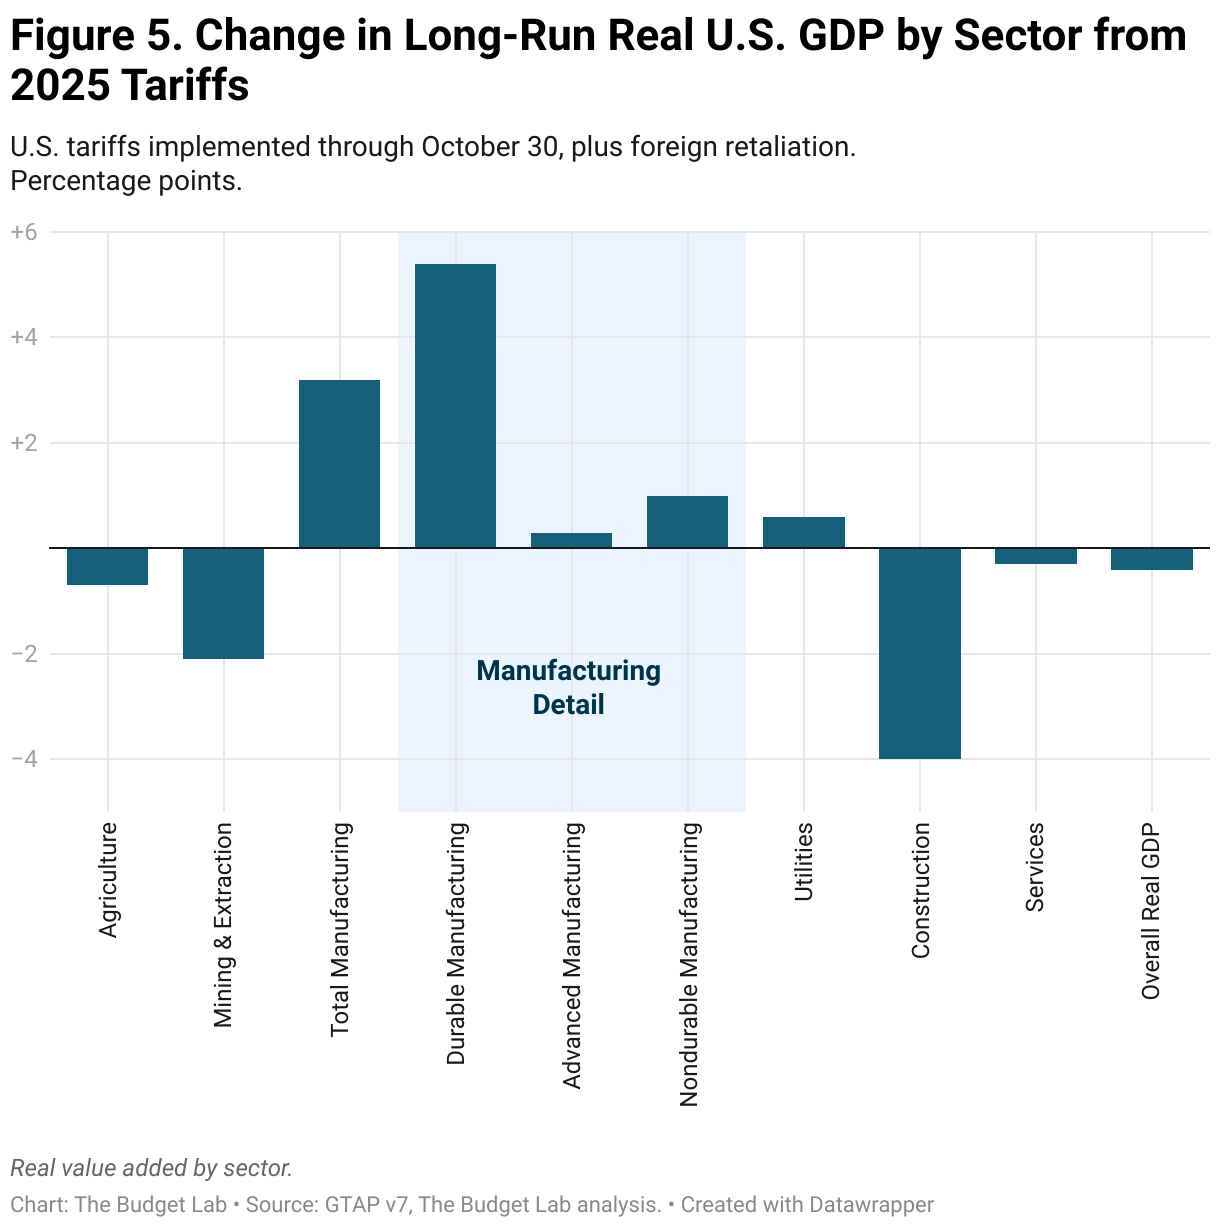
Long-Run Sectoral GDP & Employment Effects: In the long run, tariffs present a trade-off. US manufacturing output expands by 3.2%, but these gains are more than crowded out by other sectors: construction output contracts by 4.0% and agriculture declines by 0.7%. (These relative patterns are similar with or without IEEPA tariffs.)
-
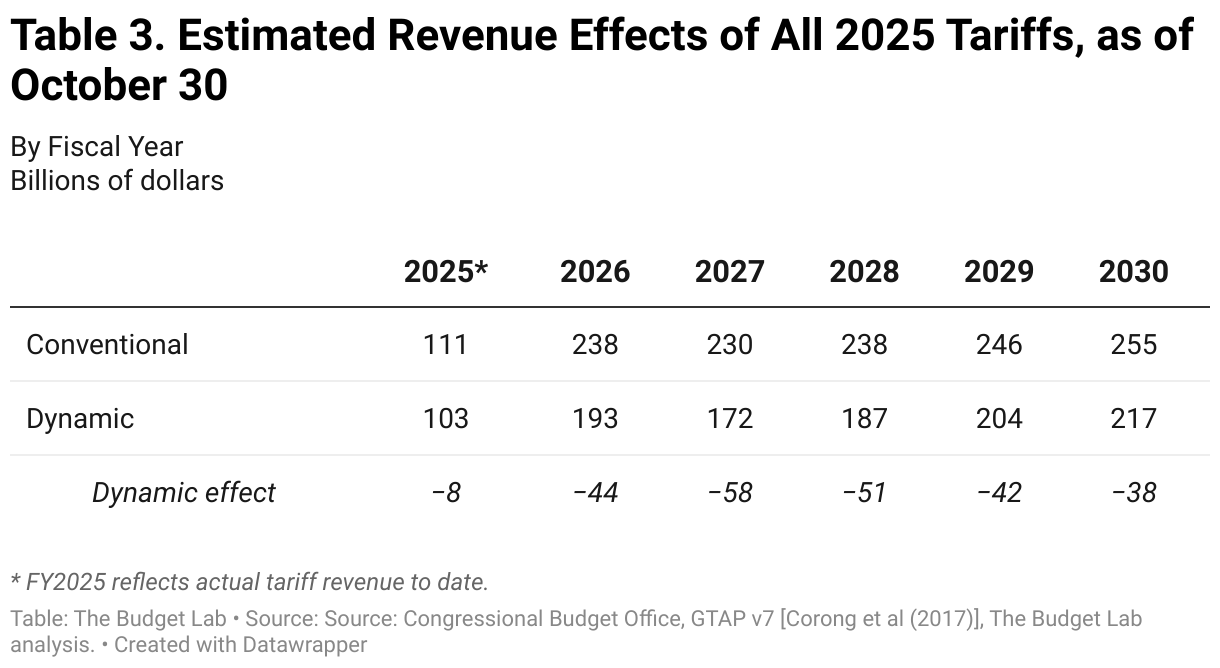
Fiscal Effects: All tariffs to date in 2025 raise about $2.6 trillion over 2026-35, though slower economic growth reduces revenues and brings the net dynamic revenue to $2.2 trillion. (Invalidating IEEPA would cut these revenue streams by more than half.)
Note: an earlier version of this report contained an error related to the overall effective tariff rate, which was misreported at 17.2. This number and related figures have been corrected. The correct overall effective tariff rate is 17.9.
Changes Since the Last Report
TBL has incorporated the following changes since the October 17 report:
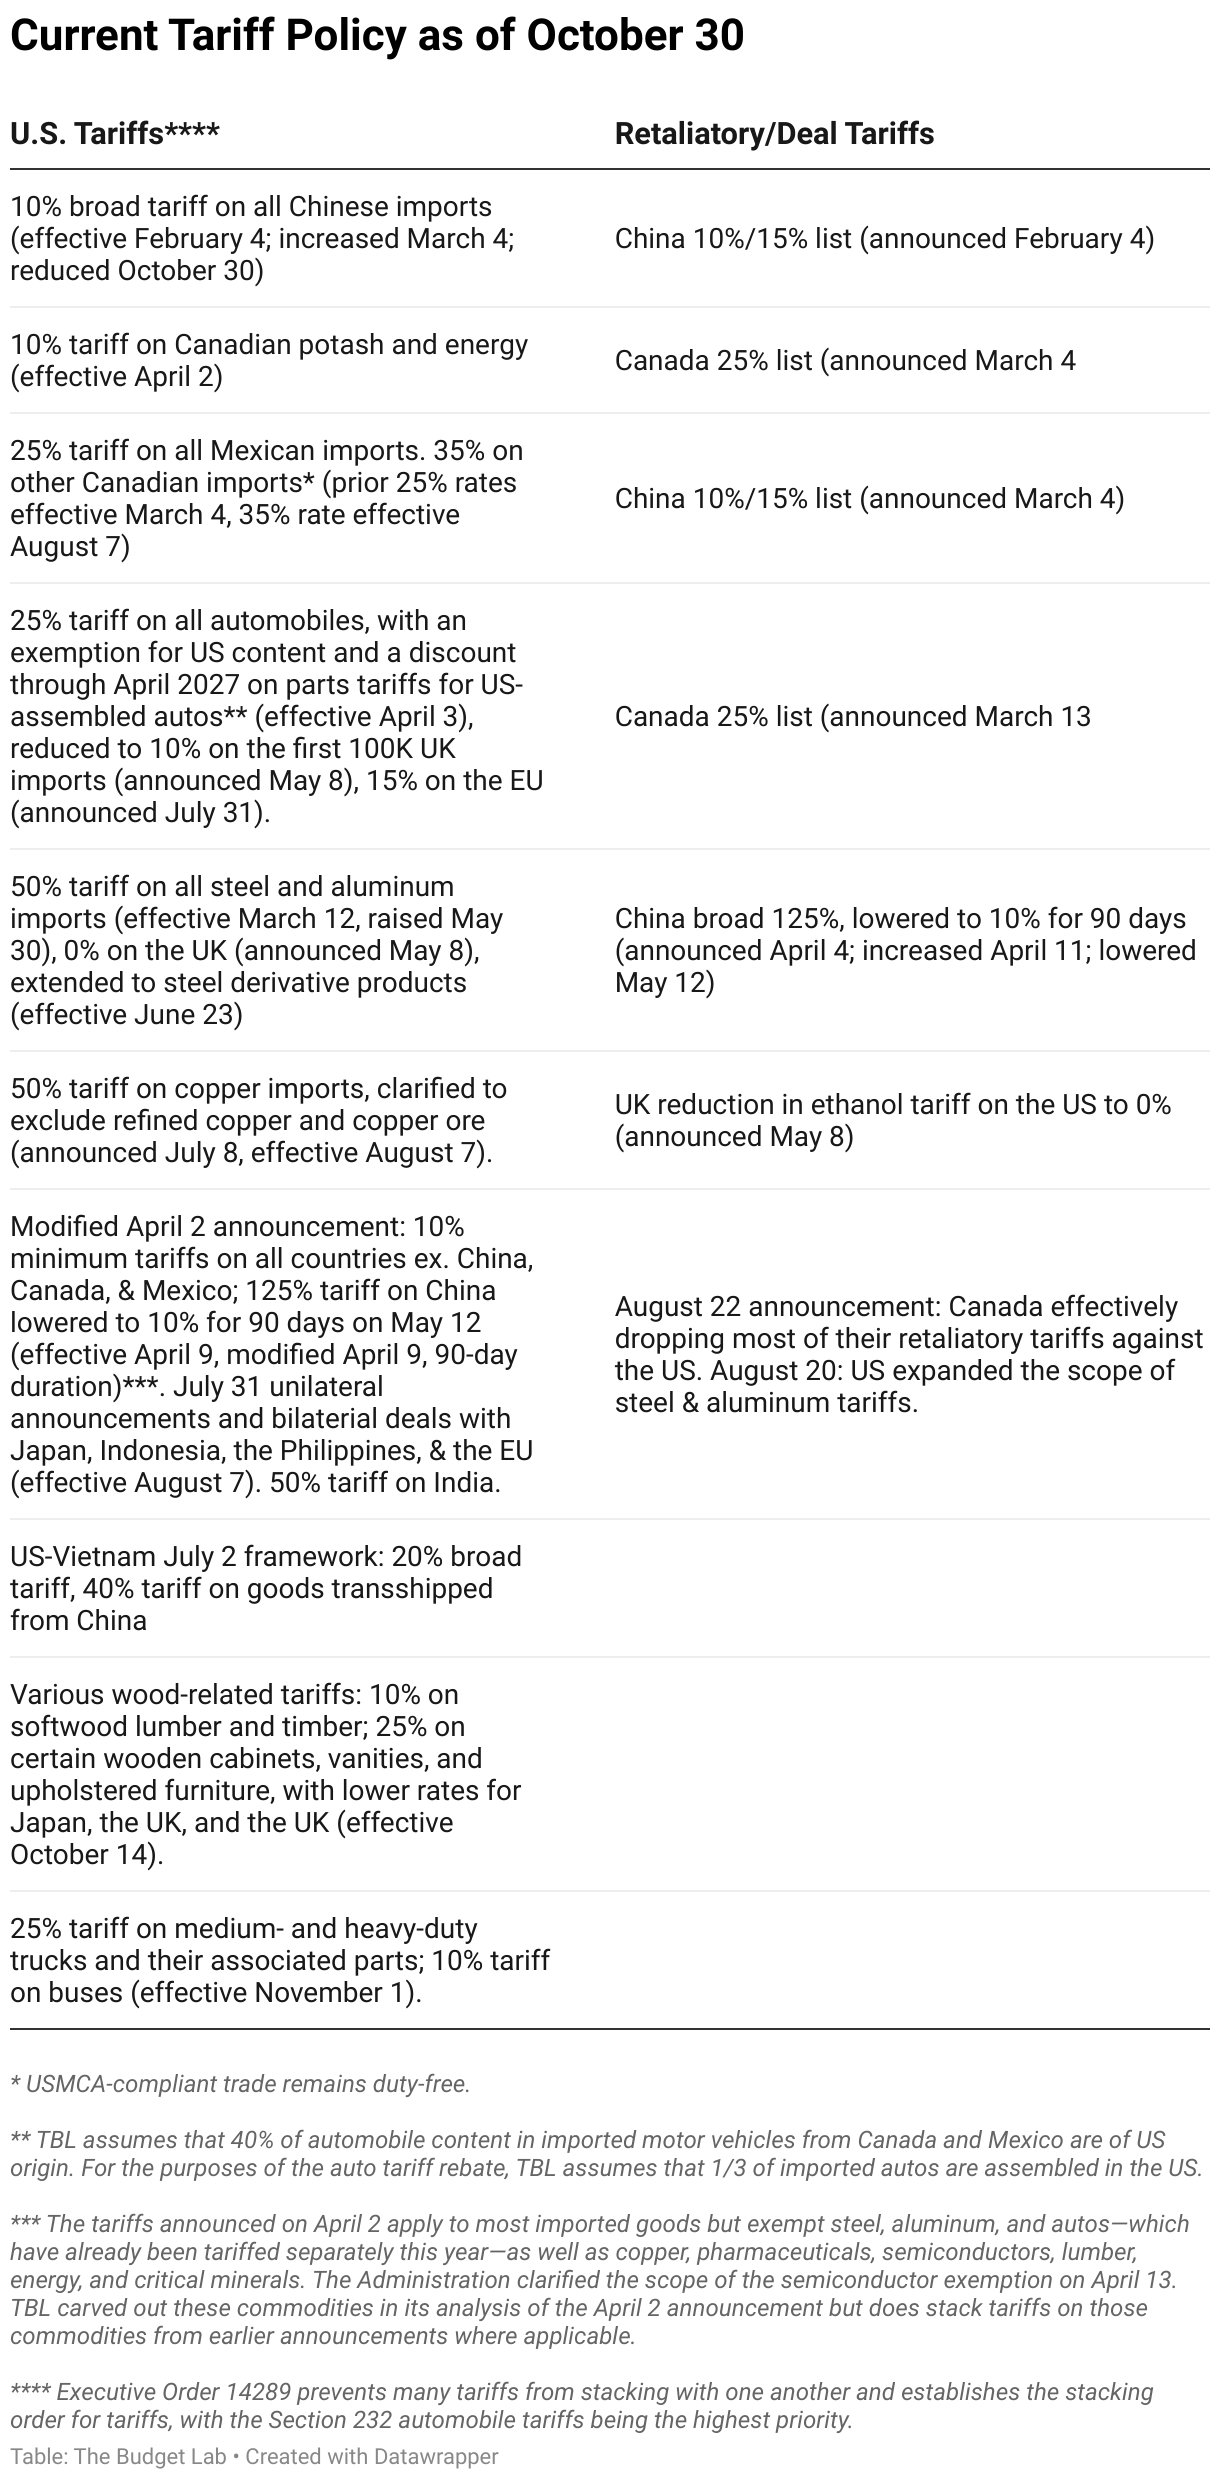
New Policy. Since the last update, there have been several developments in U.S. tariff policy:
- The administration released an official proclamation for Section 232 tariffs on medium- and heavy-duty vehicles and buses and their associated parts. This update incorporates the effects of these new tariffs.
- The U.S. and China announced a new trade agreement that would reduce the IEEPA “fentanyl” tariff rate on Chinese imports from 20% to 10%. This change in policy is reflected in this report.
- The U.S. and South Korea reportedly agreed to a new trade deal including an agreement that the U.S. would keep the IEEPA tariff rate on South Korean imports at 15% rather than increase it to 25%. Because the 25% had not actually been implemented, this deal does not reflect a policy change under TBL’s current-policy tariff baseline.
- The President threatened an additional 10% tariff on Canadian imports in a social media post. Consistent with TBL's "real-time current policy" baseline for tariff analysis, which only reflects policy that has been implemented (not merely threatened or scheduled for the future), the effects of these tariffs are not included in this report. Their inclusion, however, would not materially affect the results of this report.1 TBL will update the analysis if such tariffs are implemented.
Refinements to Effective Tax Rate Calculations. Since the last update, TBL updated its methodology for calculating effective tariff rates. The new approach implements a more detailed mapping between official HS codes and GTAP sectors. All else equal, this change leads to a 0.2 percentage point increase in TBL’s estimated overall effective tariff rate. The underlying code for these calculations can be found at this public repository.
Results
This report presents two scenarios for tariff policy:
- Baseline. In this scenario, tariff policies as of October 30 remain in effect in perpetuity (“Baseline”). This scenario is the focus of the report.
- IEEPA Invalidation. In this scenario, IEEPA tariffs are invalidated by the Supreme Court and refunded to importers. Tariffs under other legal authorities are unaffected, and the lost revenues from IEEPA tariffs are not replaced by new tariffs under other authorities. Detailed estimates for this scenario can be found in the data download file.
The table below summarizes TBL's estimated effects under both scenarios.
Average effective tariff rate
The distinction between pre-substitution metrics (before consumers and businesses shift purchases in response to the tariffs) and post-substitution (after they shift) is a crucial one. One metric where the difference is meaningful is the average effective tariff rate.
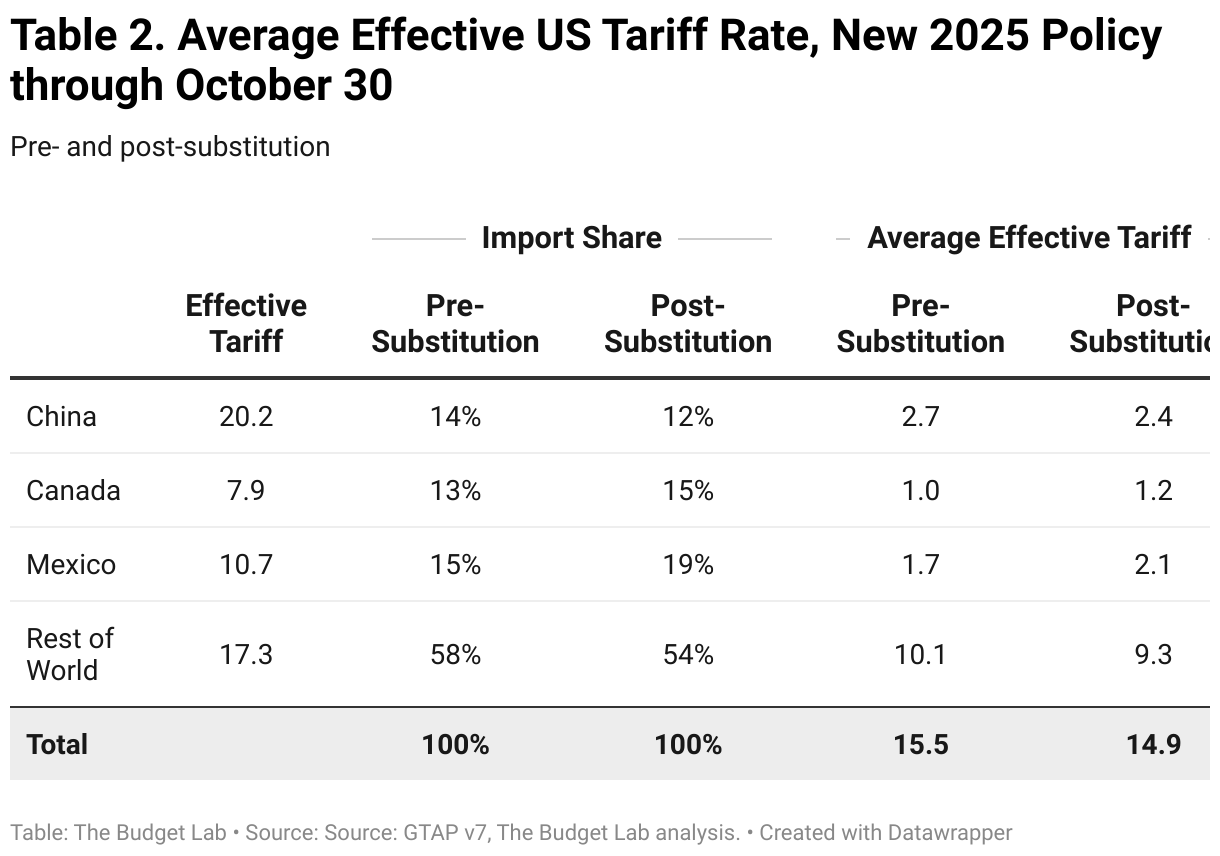
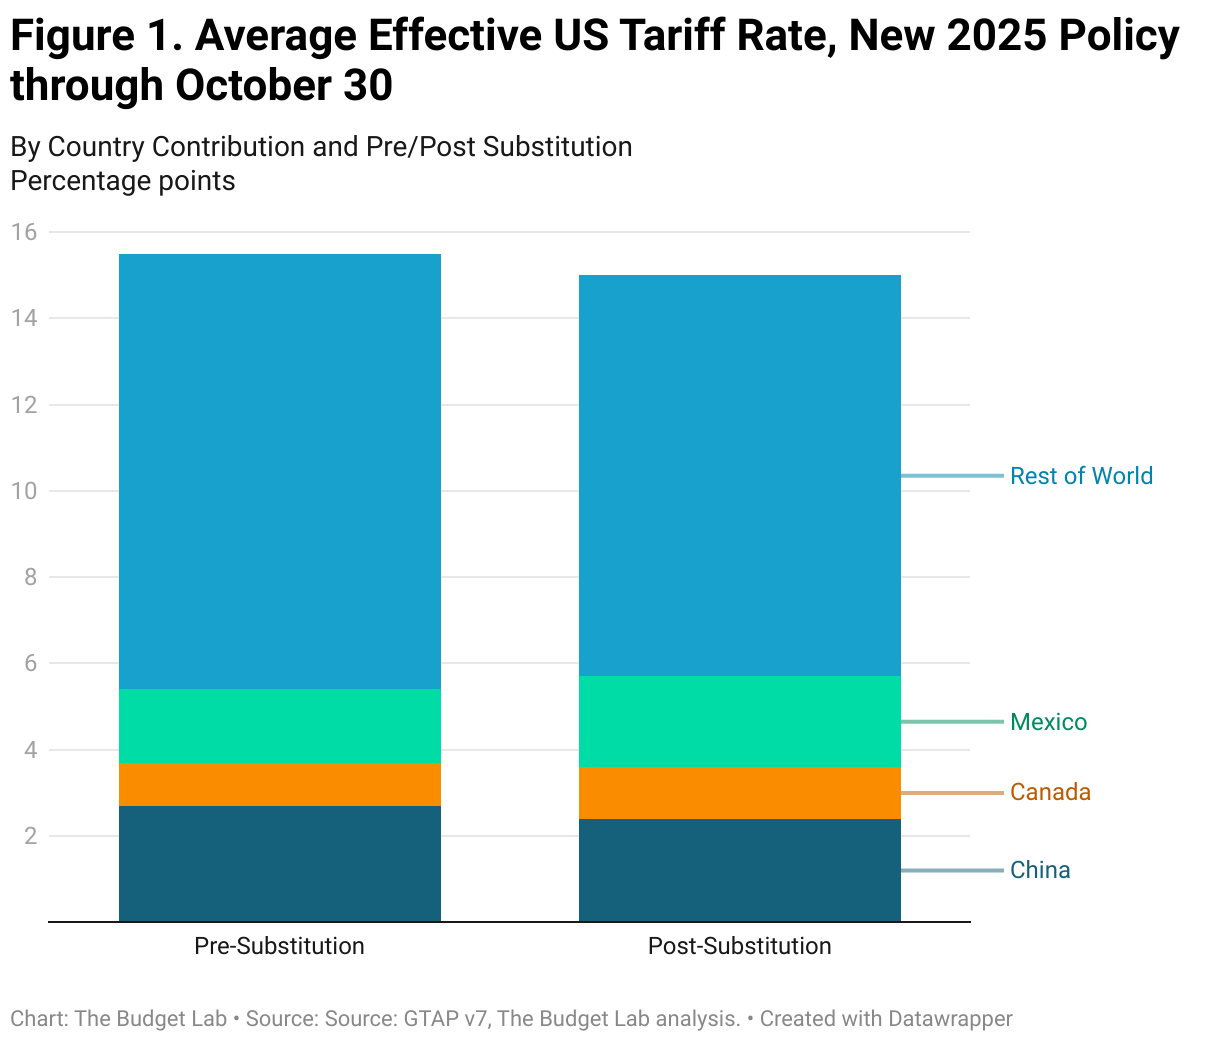
Measured pre-substitution—assuming there are no shifts in the import shares of different countries—the 2025 tariffs to date are the equivalent of a 15.5 percentage point increase in the US average effective tariff rate. That calculation assumes that, for example, the share of imports from China remains at 14%, where it was in 2024. This is the right way to think about the tariffs from the perspective of consumer welfare, since it reflects the full cost faced by consumers before they start making difficult spending choices. This increase would bring the overall US average effective tariff rate to 17.9%, the highest since 1934.2
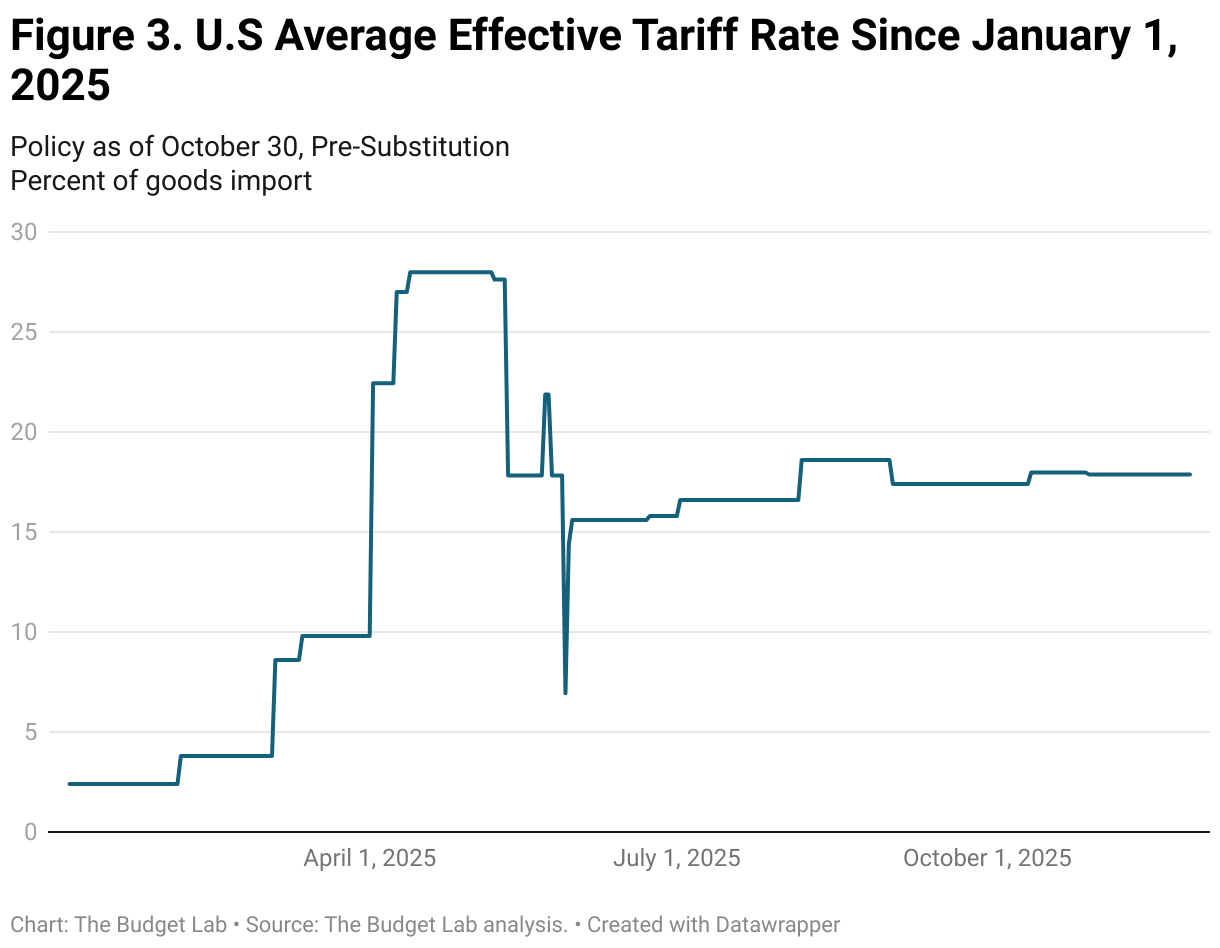
The effective tariff rate implied by policy has fluctuated substantially this year, starting at 2.4% in early January and peaking at about 28% in the wake of the April 9 and 13 announcements.
Post-substitution—after imports shift in response to the tariffs—the 2025 tariffs are a 14.9 percentage point increase in the US average effective tariff rate, which brings the overall US effective tariff rate to 17.4%, the highest since 1935. The timing of the transition from “pre” to “post” substitution is highly uncertain. Some shifts are likely to happen quickly—within days or weeks—while others may take longer.3
Average aggregate price impact
The 2025 tariffs imply an increase in consumer prices of 1.3% in the short run, assuming no policy reaction from the Federal Reserve and full passthrough of tariffs to consumers. As a result, TBL assumes the real income adjustment comes primarily through prices rather than nominal incomes. If the Federal Reserve reacted instead by letting nominal income growth temporarily slow, the adjustment would take the form of lower nominal incomes. This is a pre-substitution number that captures consumer welfare effects. It is the equivalent of a short-run income loss4 of about $1,800 per household on average in 2025 dollars. The post-substitution price increase settles at 1.2%, a $1,600 short-run loss per household.
US real GDP & labor market effects
All 2025 US tariffs plus foreign retaliation lower real GDP growth by about 0.5 pp in both 2025 and 2026. The unemployment rate ends 2025 0.3 percentage points higher and 2026 0.7 percentage points higher, and payroll employment is 490,000 lower by the end of 2025. The level of real GDP remains persistently 0.35% smaller in the long run, the equivalent of $105 billion 2024$ annually, while exports are 16% lower.
Long-run US sectoral output & employment effects
Tariffs shrink the overall size of the US economy in the long-run by 0.35%, but beneath aggregate GDP they also drive reallocation across US sectors. Long-run output in the manufacturing sector expands by 3.2%, within which nonadvanced durable manufacturing seeing the largest gains and advanced manufacturing seeing a slight decline. This expansion of the overall manufacturing sector, however, more than crowds out the rest of the economy: construction contracts by 4.0%, agriculture by 0.7%, and mining & extraction by 2.1%.
Global long-run real GDP effects
The UK and Mexico are the biggest winners from the 2025 tariffs to date, with each economy about 0.1% larger in the long run. Canada’s economy is 0.1% smaller in real terms. China’s economy is 0.2% smaller, a bit more than half as large as the hit to the US. The EU’s economy is about 0.05% larger in the long run.
Fiscal impact
The 2025 tariffs to date, were they to remain in place, would raise almost $2.6 trillion over 2026-35 conventionally-scored ($2.2 trillion over 2025-34).5,6 Given the negative output effects of the tariffs, these new revenues will be partially offset by reductions in tax revenue as a result of lower growth. Based on Congressional Budget Office rules-of-thumb, TBL estimates that these effects would total more than $400 billion over the decade.
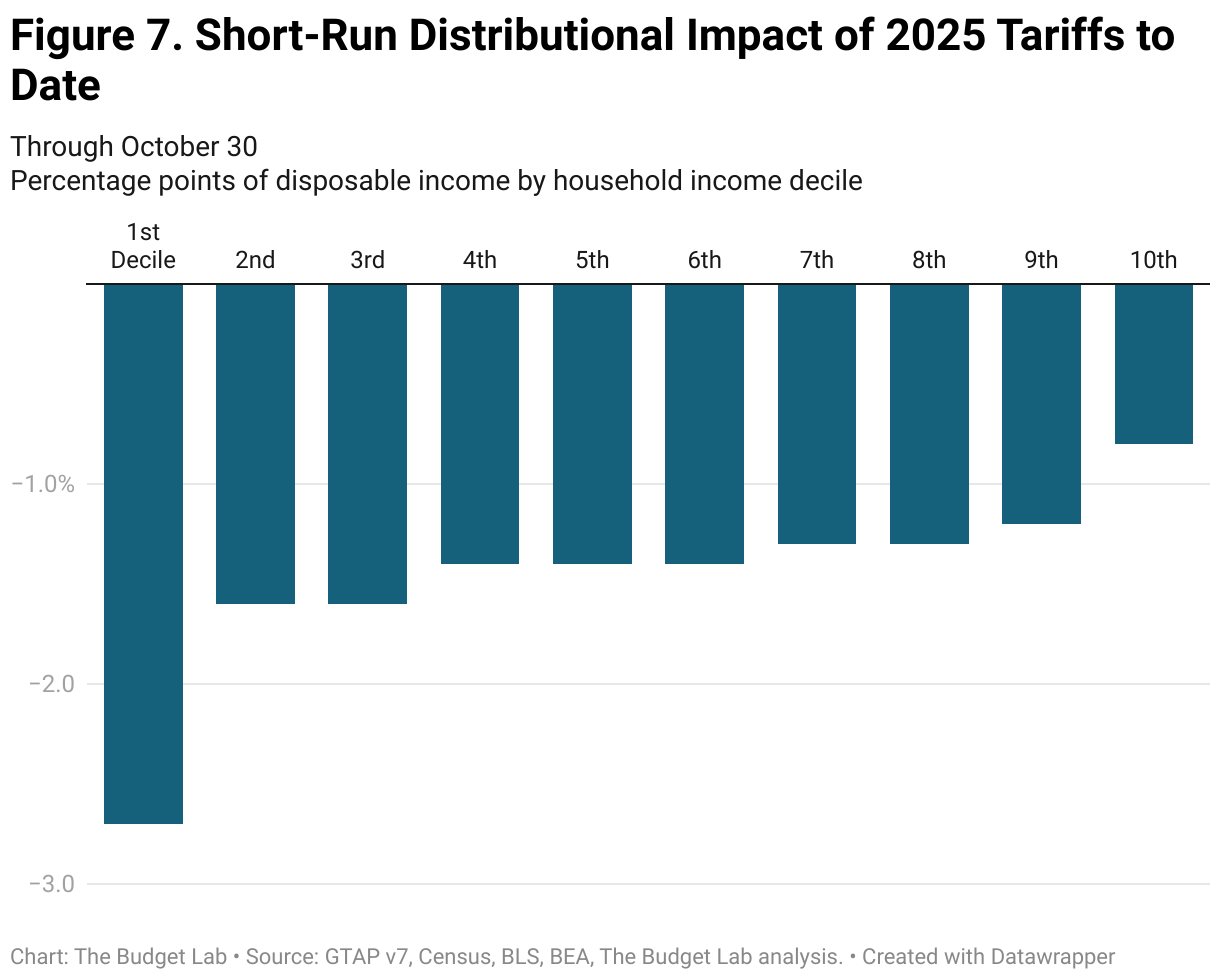
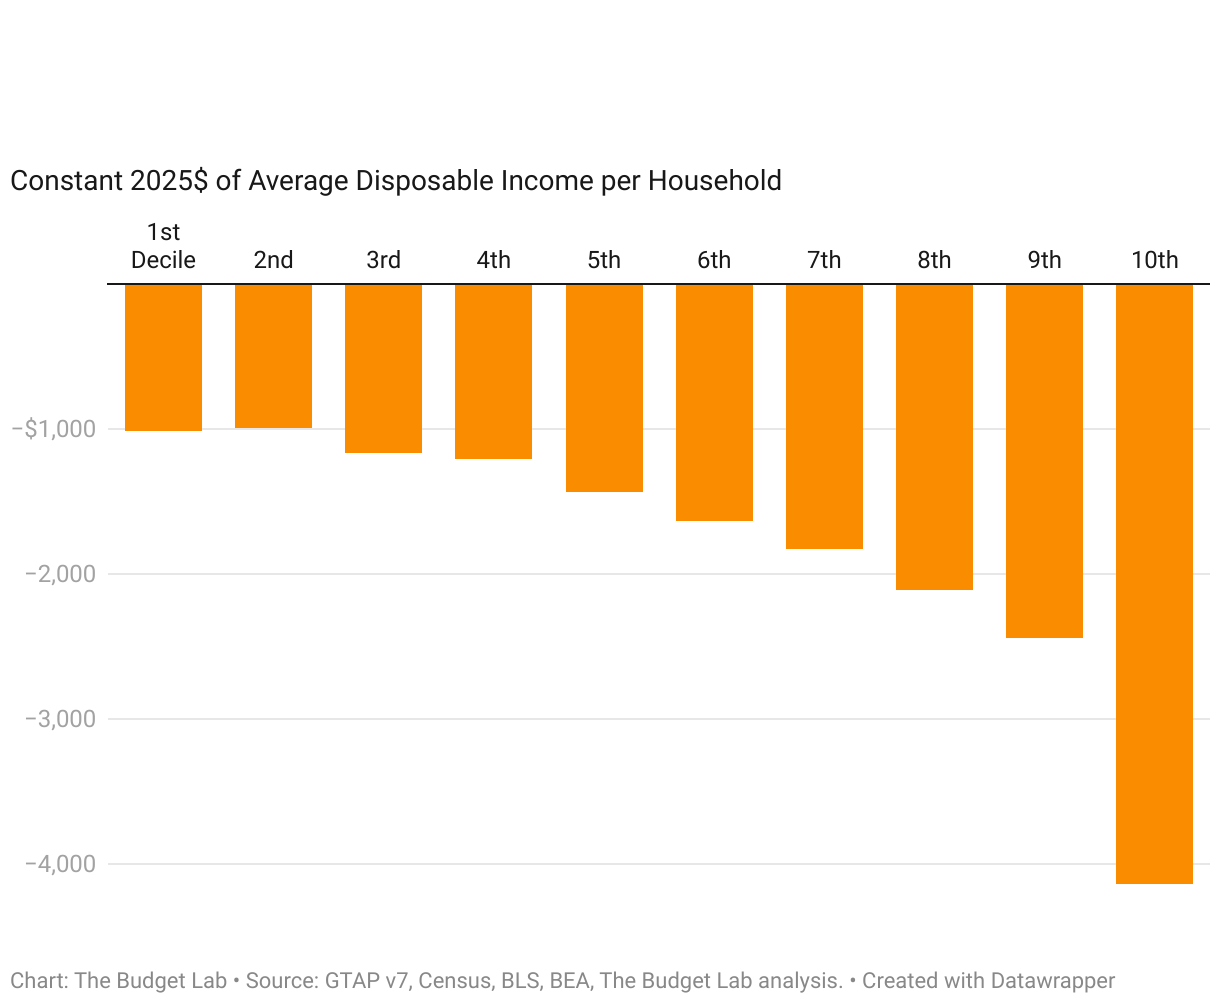
Distributional impact
One way to measure the distributional burden of tariffs is to look at the relationship between consumption, which gets more expensive under tariffs, and income for a given year. Under this view, tariffs are a regressive tax because lower-income households spend a larger fraction of their income than higher-income households do on average.
TBL finds that the short-run burden on the first decile is more than three times that of the top decile (-2.7% versus -0.8%). The average annual cost to households in the first and top decile rise to about $1,000 and $4,100 respectively in 2025$. The median cost is about $1,500 per household.
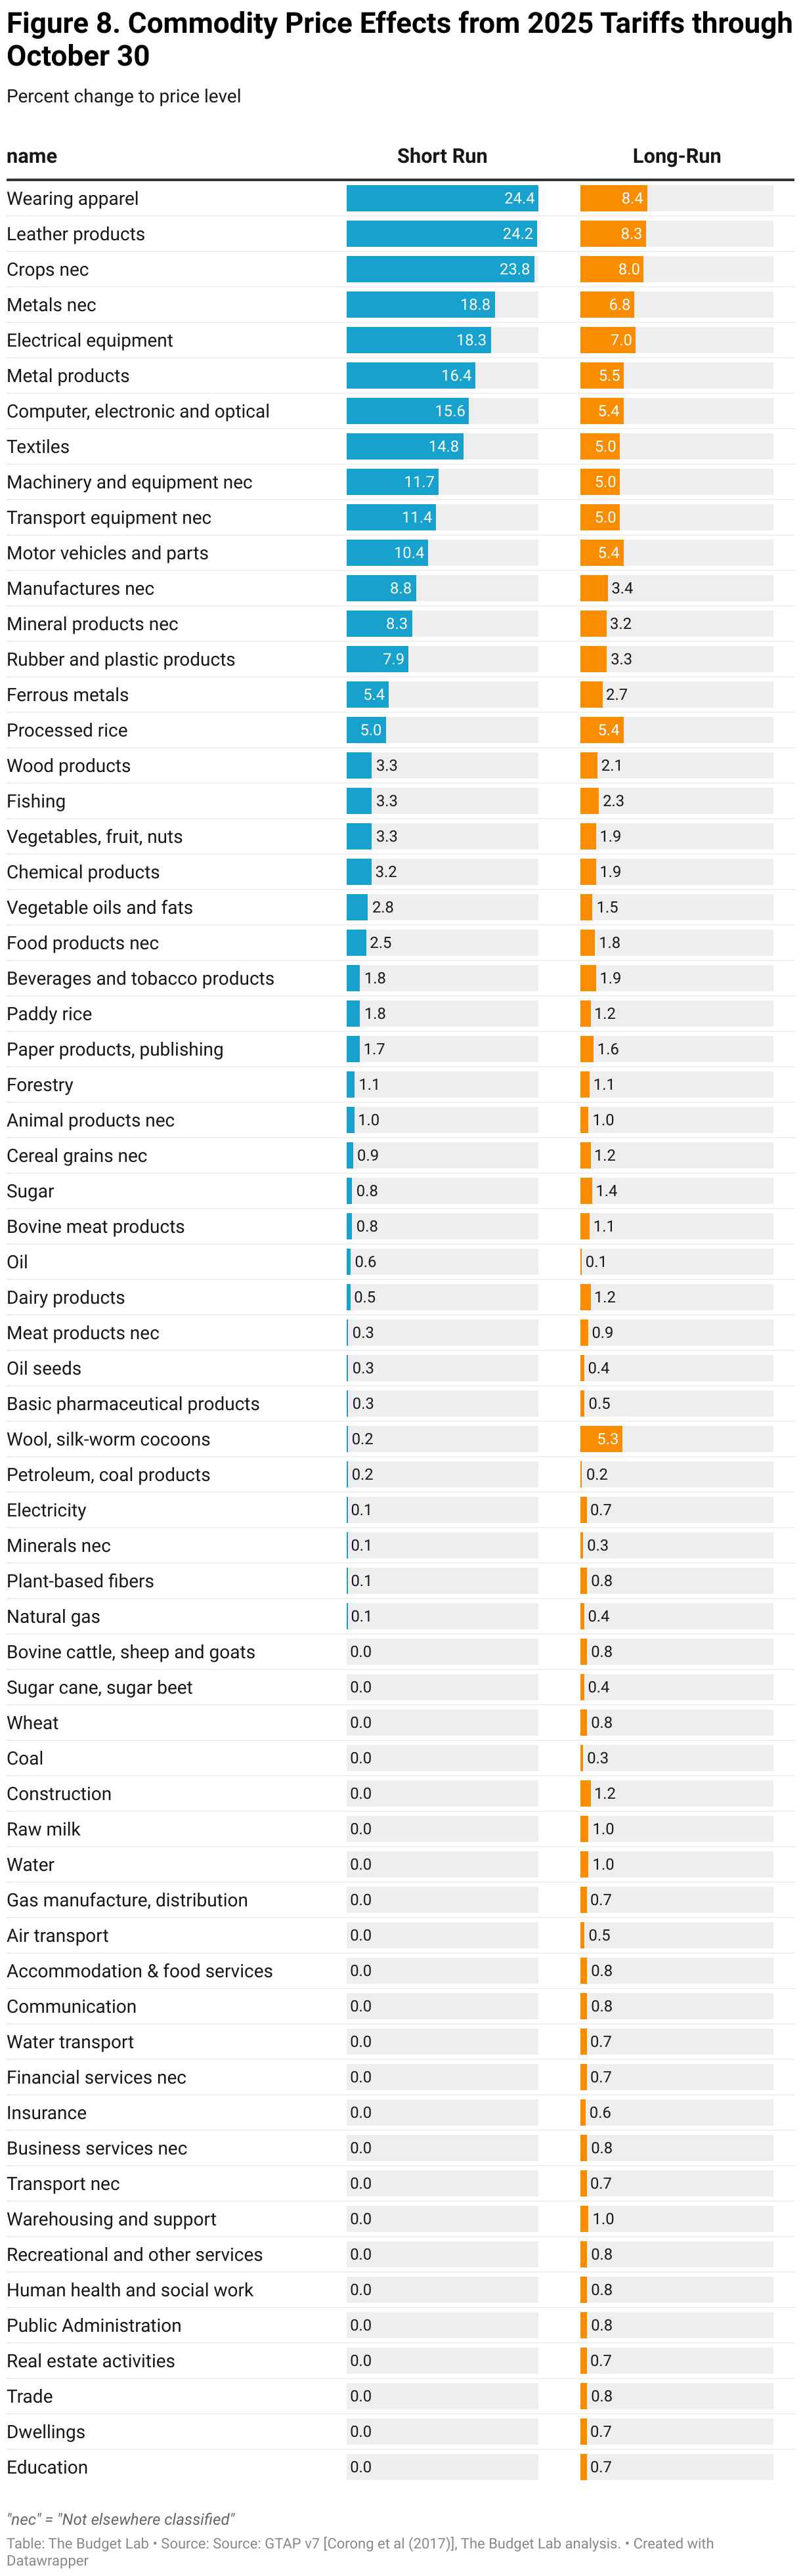
Commodity price effects
The charts below show how the 1.3% price level increase from the 2025 tariffs to date would look across individual commodities in the short-run (pre-substitution), as well as the 1.1% long-run price increase (post-substitution). Some high level takeaways:
- Consumers face particularly high increases in leather and clothing in the short run: prices increase 24% for leather products (shoes and hand bags) and general apparel, and 15% for textiles. After substitution and global supply shifts in the long run, prices remain 8%, 8%, and 5% higher, respectively.
- Metal imports are a central target of recent tariffs. Beyond raw materials which face direct price impacts, affected consumer products include electoral equipment and consumer electronics (16-18% short-run price effect, 5-6% long-run price effect).
- Food prices rise 1.9% in the short run and stay 1.6% higher in the long run.
- Motor vehicle prices rise 10% in the short run and 5% in the long run, the equivalent of an additional roughly $5,000 and $2,500 respectively to the price of an average 2024 new car.
Footnotes
- 1
A new 10% tariff on Canadian imports implemented under IEEPA in a fashion consistent with prior 2025 policy would have a small effect on the effective tariff rates due to the general exemption for USMCA-compliant trade. Under this scenario, we estimate that the (pre-substitution) overall effective tariff rate would rise by less than 0.1 percentage point and the effective tariff rate on Canadian imports would rise by about 0.6 percentage points.
- 2
TBL’s estimated pre-substitution tariff rate fell from 18.0% in the last update to 17.9%. This 0.1pp net difference can be approximately decomposed into these factors: -0.9 pp due to modeling changes, +0.1 pp due to the new medium- and heavy-truck tariffs, and –1.1 pp due to lower tariffs on Chinese imports.
- 3
TBL assumes throughout its tariff analysis that the transition to longer-run GTAP equilibria occurs after three years.
- 4
TBL defines “income” as CBO-concept post-tax-and-transfer income. “Short-run” refers to the effect over the next couple of years; TBL proxies for this definition by using CBO projections of the distribution of income in 2027, expressed in 2025 dollars.
- 5
TBL employs a “relaxed conventional” assumption for the retaliation scenario, whereby foreign income is permitted to fall but US income remains fixed.
- 6
The Congressional Budget Office has projected that tariff policy in place as of August 19 reduces primary (non-interest) deficits by $3.3 trillion over 2025-35. On a like-for-like policy basis, the differences between CBO’s and TBL’s estimates can be entirely explained by three factors: 1) CBO quotes the fiscal effects of tariffs on an 11-year basis (2025-35), while TBL quotes the effects on a 10-year basis (2026-35); 2) CBO does not adjust its estimates for non-compliance, while TBL reduces its first stage revenue estimates by 10% to account for additional non-compliance not captured in underlying trade elasticities; and, 3) CBO and TBL have different estimates of the average effective US tariff rate: in its August 22 report, CBO calculated that the average tariff rate was 18 percentage points higher due to new 2025 tariffs, while TBL, in its September 4 report, calculated the rate was 15 percentage points higher.