
State of U.S. Tariffs: Week of April 7, 2025
Key Takeaways
-
The Budget Lab estimated the effects all US tariffs and foreign retaliation implemented in 2025 through the week of April 7, 2025.
-
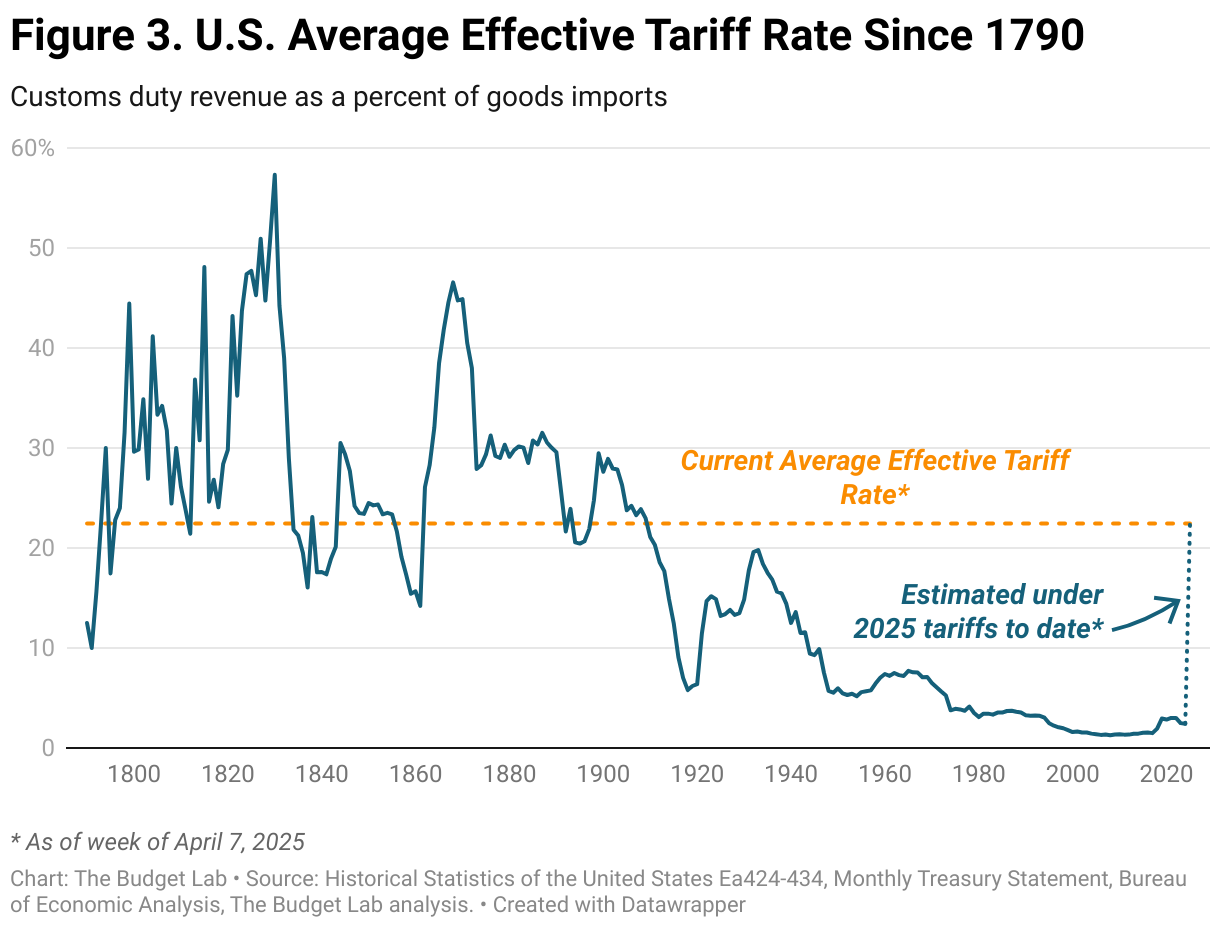
Current Tariff Rate: The average effective US tariff rate is now 22 ½%, the highest since 1909.
-
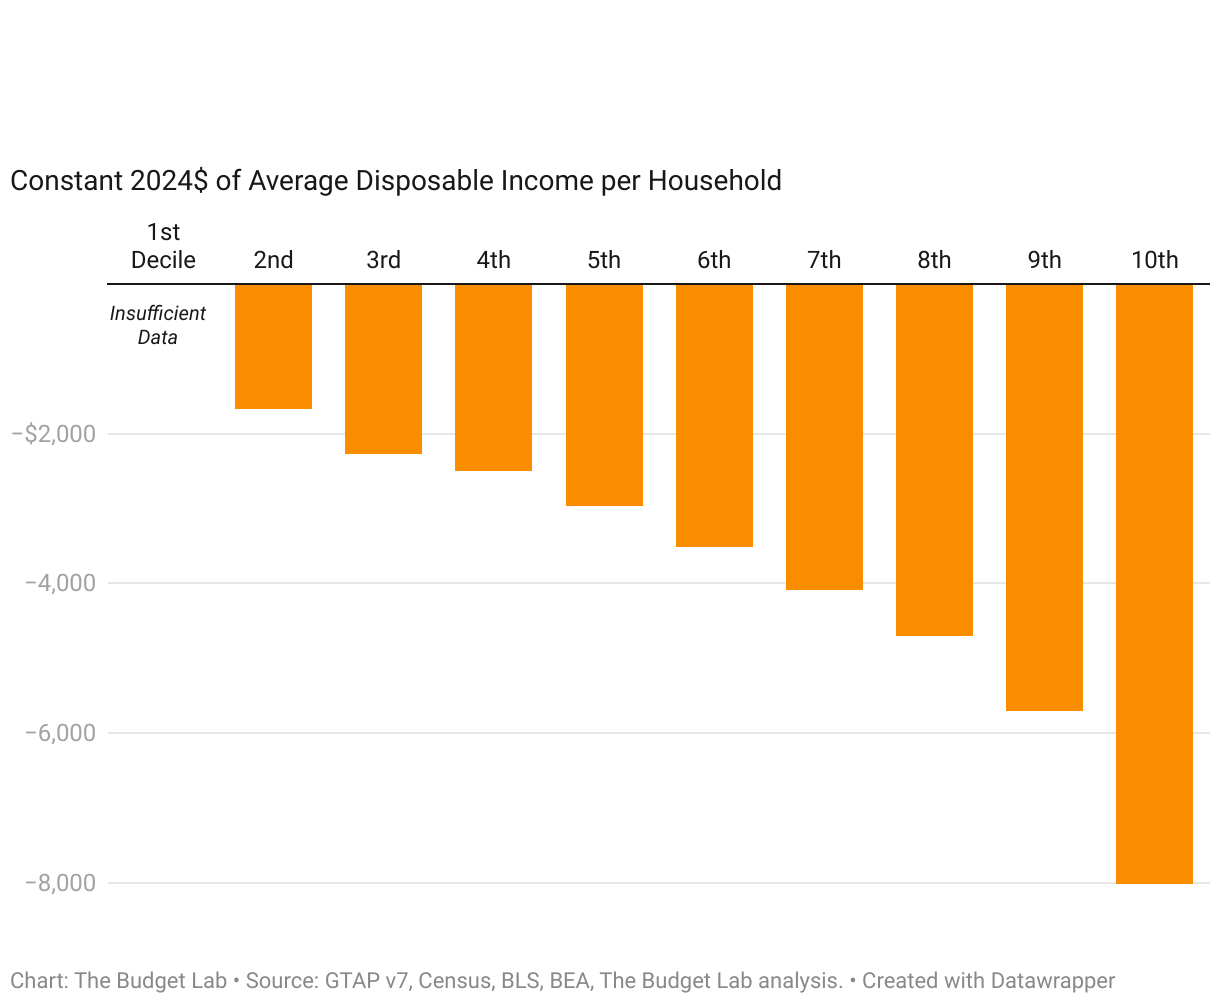
Overall Price Level & Distributional Effects: The price level from all 2025 tariffs rises by 2.3% in the short-run, the equivalent of an average per household consumer loss of $3,800 in 2024$. Annual losses for households at the bottom of the income distribution are $1,700.
-
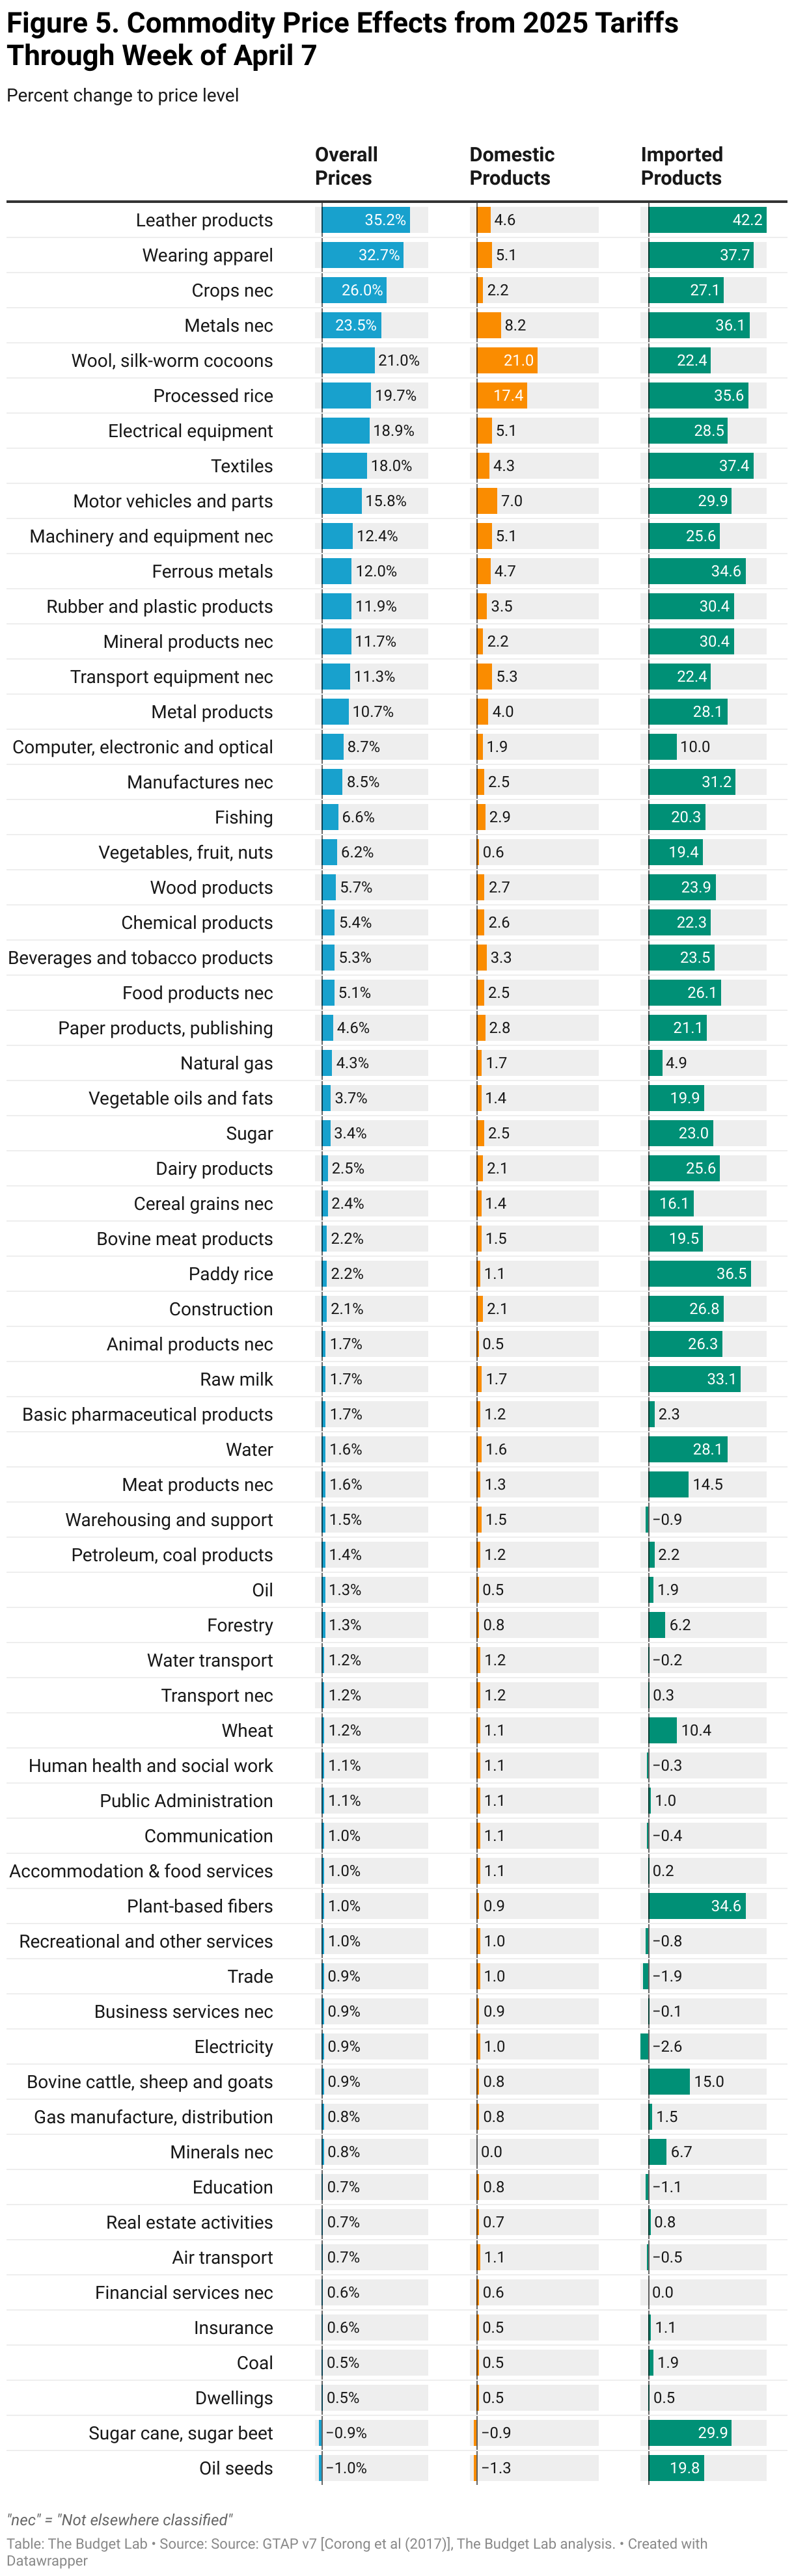
Commodity Prices: The 2025 tariffs disproportionately affect clothing and textiles, with apparel prices rising 33%. Food prices rise 4.5%, roughly triple recent grocery inflation.
-
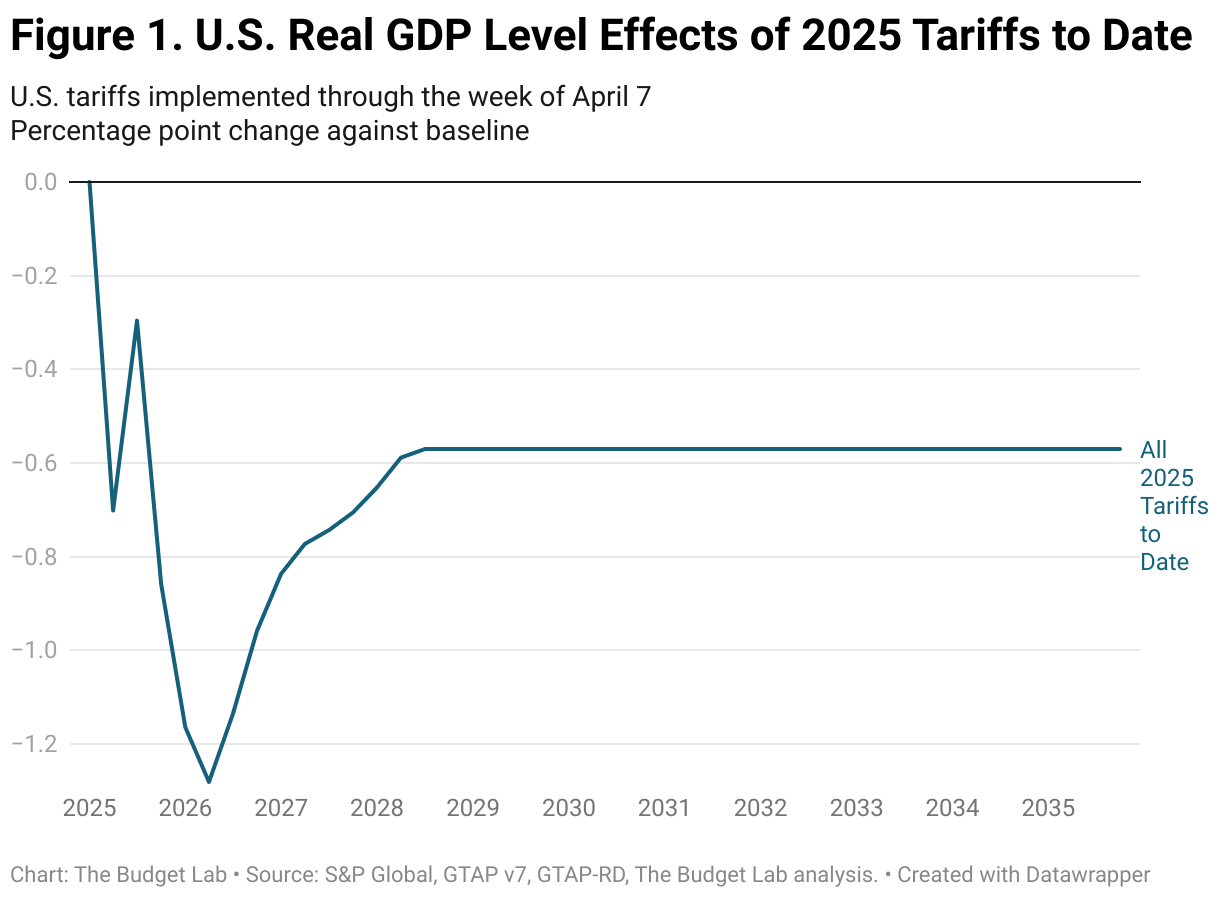
Real GDP Effects: US real GDP growth is -0.9pp lower from all 2025 tariffs. In the long-run, the US economy is persistently -0.6% smaller respectively, the equivalent of $180 billion annually in 2024$.
-
Labor Market Effects: The unemployment rate rises 0.5 percentage point by the end of 2025, and payroll employment is 600,000 lower.
-
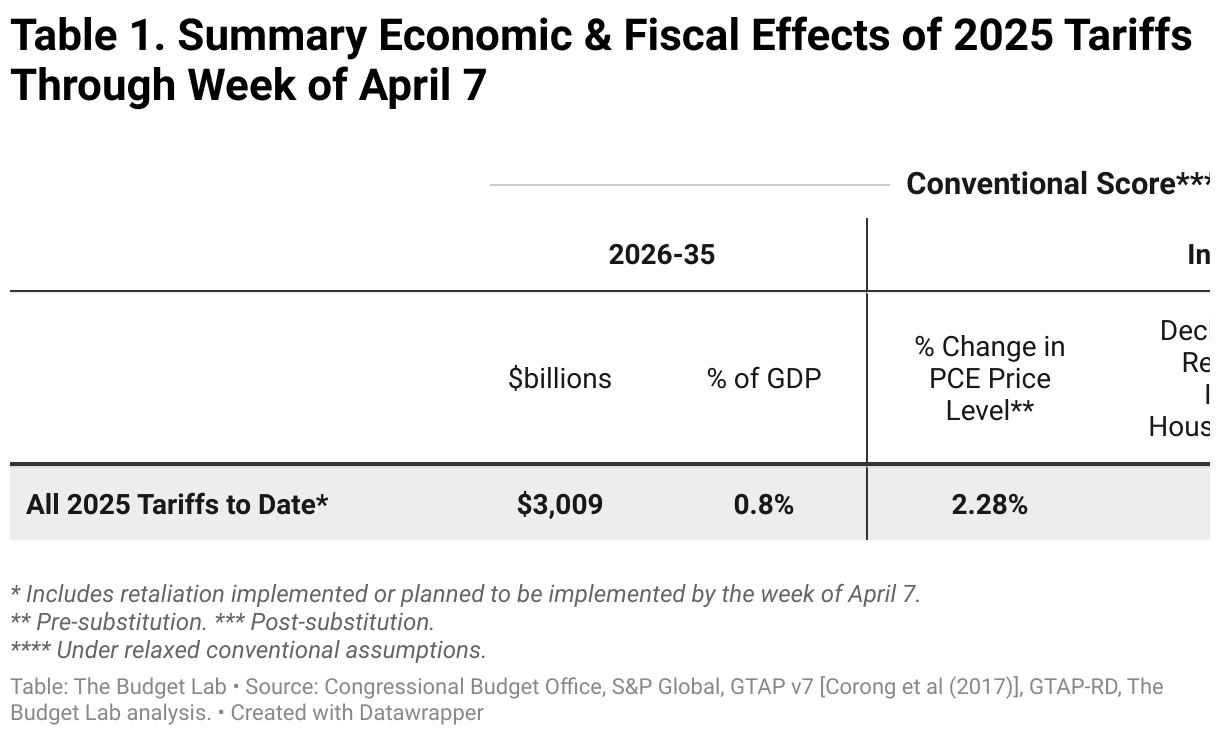
Fiscal Effects: All tariffs to date in 2025 raise $3.0 trillion over 2026-35, with $588 billion in negative dynamic revenue effects.
Changes Incorporated Since the Last Update
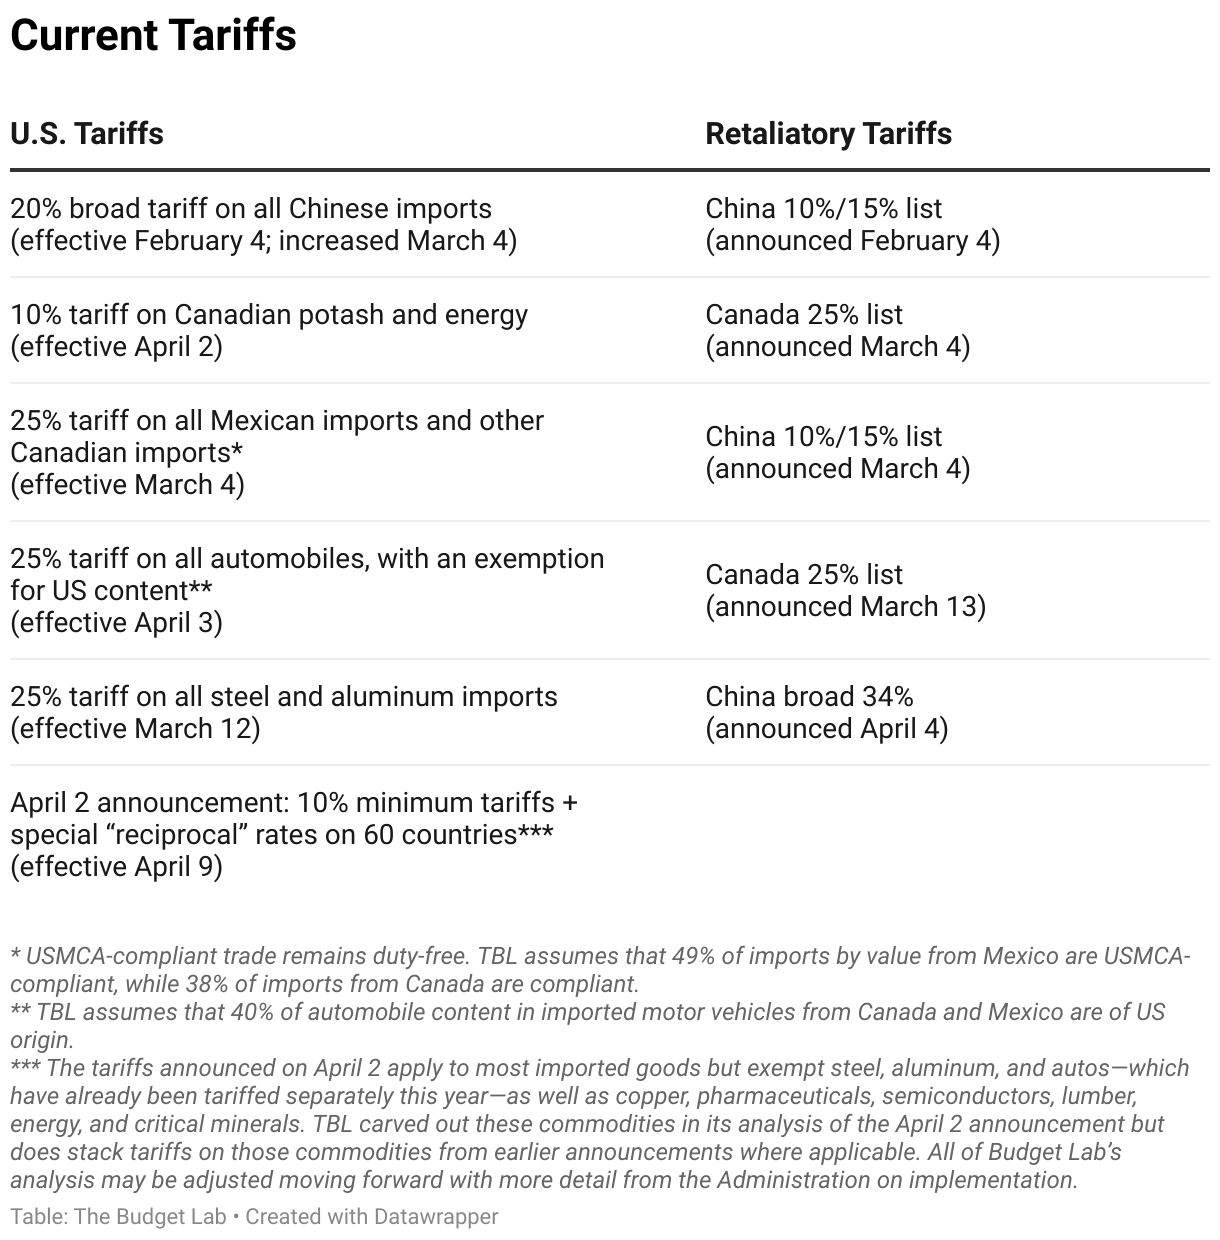
- Since the April 2 report, China has announced retaliatory tariffs of 34% on all US goods imports, effective April 10.
- TBL revised its methodology for pro-rating the effects of currency appreciation on overall prices in cases where foreign retaliation against US tariffs is not complete. This revision lowered the PCE effect by 0.03 percentage point relative to the April 2 report.1
- TBL now reports the unemployment rate and payroll employment effects for 2025 Q4.
Results
The table below summarizes the effects of both the April 2nd announcement in isolation and all the 2025 tariffs to date.
Average aggregate price impact
The tariffs through the week of April 7th imply an increase in the average effective tariff rate of 20 percentage points. That raises consumer prices by 2.3% in the short-run, assuming no policy reaction from the Federal Reserve, a loss of purchasing power of $3,800 per household on average in 2024 dollars.
US real GDP & labor market effects
All 2025 US tariffs plus foreign retaliation lower real GDP growth by -0.9pp over calendar year 2025 (Q4-Q4) and -0.1pp lower over calendar year 2026. The unemployment rate ends 2025 0.46 percentage point higher, and payroll employment is 612,000 lower that same quarter. The level of real GDP remains persistently -0.6% smaller in the long run, the equivalent of $170 billion 2024$ annually, while exports are -18.7% lower.
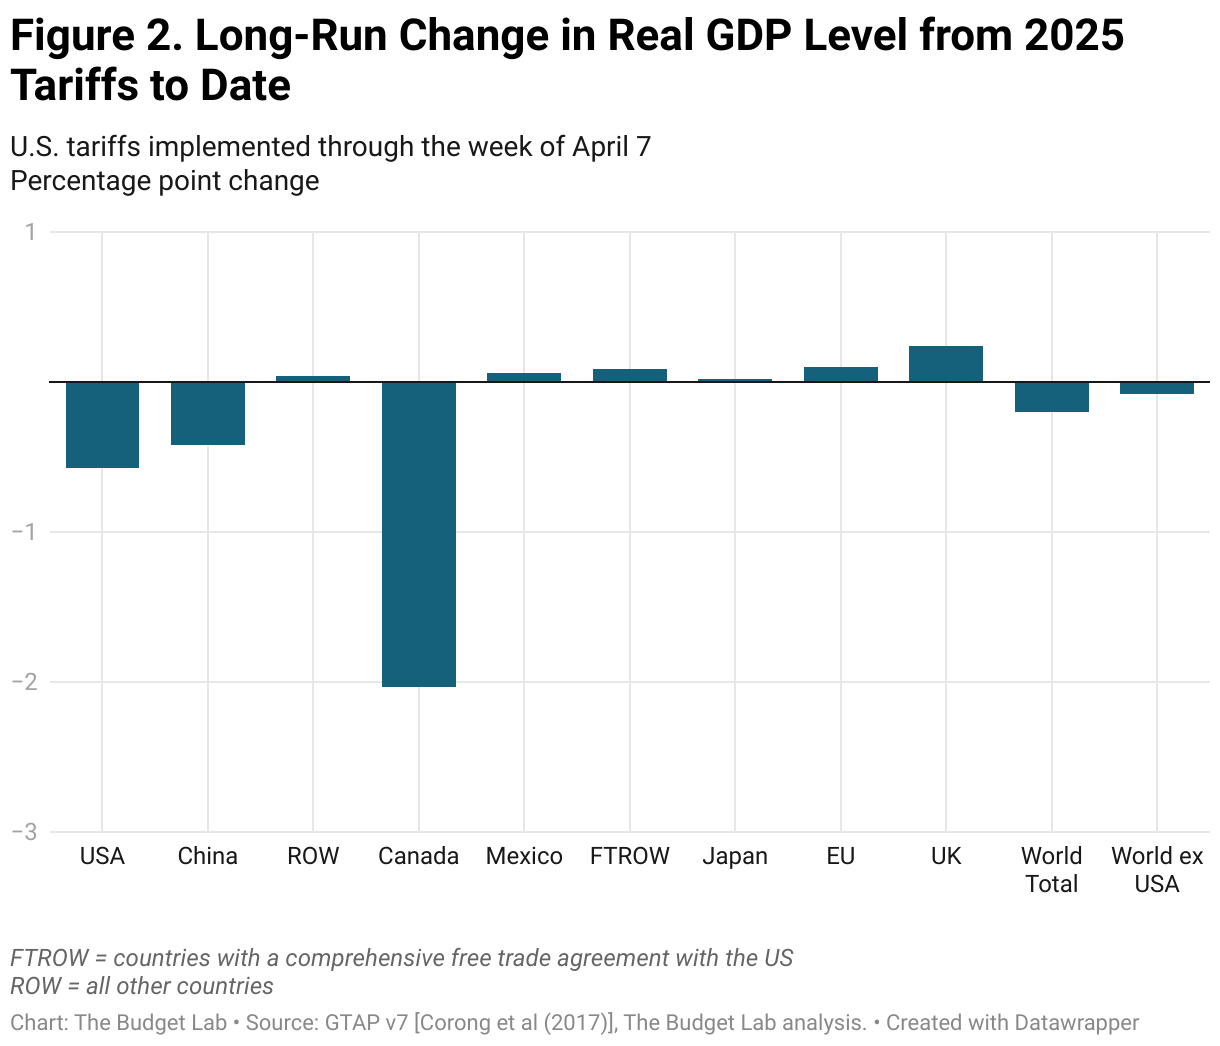
Global long-run real GDP effects
Canada has borne the brunt of the damage from US tariffs so far, with its long-run economy -2.0% smaller in real terms (reflecting both US tariffs and Canadian retaliation to date). China’s economy is -0.4% smaller, about three-quarters of the impact to the US. The Mexican and EU economies are 0.1 percentage point larger in the long-run, while the UK’s is 0.2% bigger.
Fiscal impact & historical context
The 2025 tariffs to date, were they to remain in place, would raise $3.0 trillion over 2026-35 conventionally-scored.2 Given the negative output effects of the tariffs, there would be additional dynamic reductions in tax revenue as a result. Based on Congressional Budget Office rules-of-thumb, TBL estimates that these effects would total -$588 billion over the decade.
As mentioned earlier, the 2025 tariffs to date are equivalent to an 20 percentage point increase in the average effective tariff rate. The US average effective tariff rate is now at 22 ½%, the highest since 1909.
Short-run distributional impact
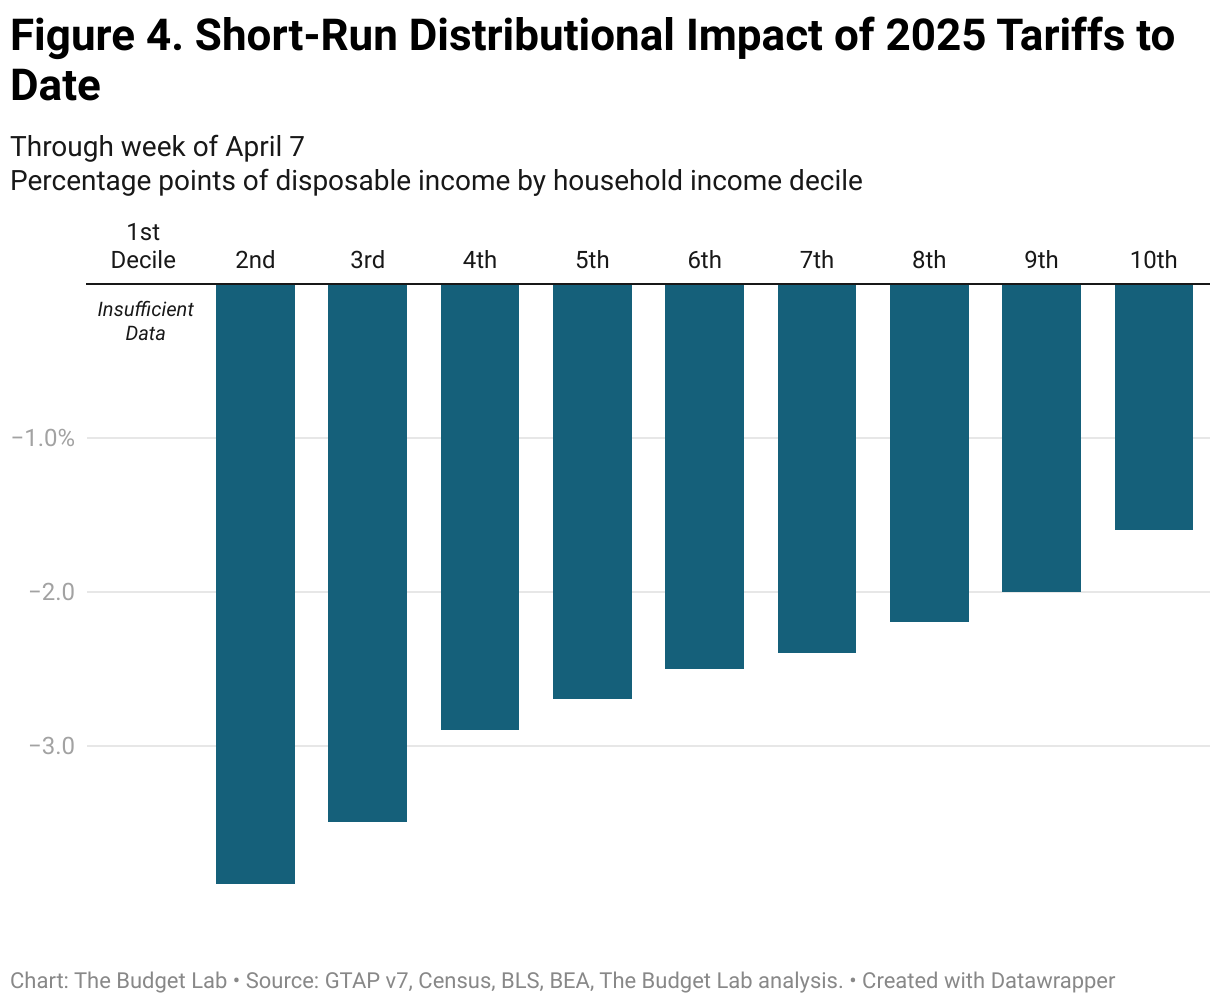
Tariffs are a regressive tax, especially in the short-run. This means that tariffs burden households at the bottom of the income ladder more than those at the top as a share of income. The regressivity is about the same when looking at all 2025 tariffs: the burden on the 2nd decile is 2.5x that of the top decile (-3.9% versus -1.6%). The average annual cost to households in the 2nd, 5th, and top decile rise to $1,700; $3,000; and $8,000 respectively.
Tariffs are more distributionally-ambiguous in the longer-run. Tariffs reduce both labor income and above-normal returns to capital, or rents. We assume that owners of capital hold rents rather than consume them in the short-run, but do consume them over their lifecycle in the long-run. The implication is that the tariff burden is more regressive in the short-run and more evenly-distributed across households in the long-run
Commodity price effects
The charts below show how the 2.3% price level increases from the 2025 tariffs to date would look across individual commodities in the long-run. Some high level takeaways:
- The 2025 tariffs have disproportionately affected clothing and textiles. Apparel prices rise 33%. Non-clothing textile prices rise 18%.
- Food prices are also disproportionately affected, rising 4.5%, roughly 3x last year’s worth of grocery inflation in CPI. Fresh produce alone rises 6.2%.
- Motor vehicle prices rise 15.8% under all tariff action to date, the equivalent of an additional $7,600 to the price of an average 2024 new car.
Footnotes
- In the April 2 report, TBL made the stylized assumption that incomplete foreign retaliation meant its typical dollar appreciation parameter (appreciation offsets 30% of the tariff cost) would be cut in half. Under the new methodology, TBL simulates the economy both with actual retaliation and with no retaliation at all, then pro-rates the 30% assumption based on the ratio of the currency change in the retaliation-to-non-retaliation scenarios. For this report, that ratio happened to be 55%, close to our prior assumption, hence the limited change to the price effects.
- TBL employs a “relaxed conventional” assumption for the retaliation scenario, whereby foreign income is permitted to fall but US income remains fixed.