
Where We Stand: The Fiscal, Economic, and Distributional Effects of All U.S. Tariffs Enacted in 2025 Through April 2
Key Takeaways
-
The Budget Lab modeled the effect of both the April 2nd tariff announcement in isolation and all US tariffs implemented in 2025.
-
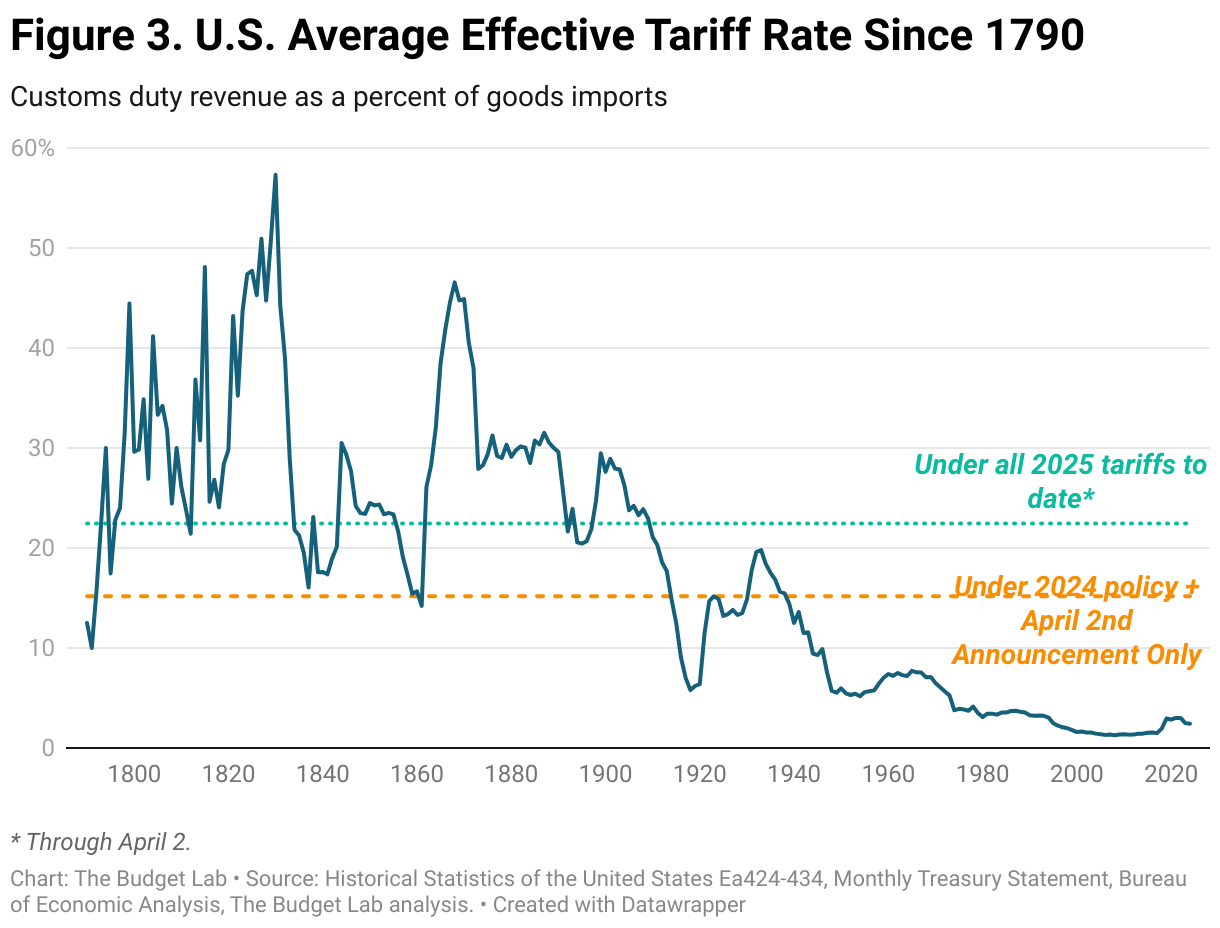
The April 2nd action is the equivalent of a rise in the effective US tariff rate of 11 ½ percentage points. The average effective US tariff rate after incorporating all 2025 tariffs is now 22 ½%, the highest since 1909.
-
The price level from all 2025 tariffs rises by 2.3% in the short-run, the equivalent of an average per household consumer loss of $3,800 in 2024$. Annual losses for households at the bottom of the income distribution are $1,700.
-
The price level from the April 2nd announcement alone rises by 1.3% in the short run, the equivalent of an average per household consumer loss of $2,100 in 2024$. Annual losses for households at the bottom of the income distribution are $980 under the April 2nd policy alone.
-
Both the April 2nd tariffs alone and all 2025 tariffs together disproportionately affect clothing and textiles, with apparel prices rising 17% under all tariffs.
-
US real GDP growth is -0.5pp lower in 2025 from the April 2nd announcement and -0.9pp lower from all 2025 tariffs. In the long-run, the US economy is persistently -0.4 and -0.6% smaller respectively, the equivalent of $100 billion and $180 billion annually in 2024$.
-
The April 2nd announcement raises $1.4 trillion over 2026-35 conventionally-scored, and $366 billion less if dynamic revenue effects are taken into account. All tariffs to date in 2025 raise $3.1 trillion, including the effect of retaliation to date, with $582 billion in negative dynamic revenue effects.
Introduction
On April 2, the White House announced its long-awaited comprehensive tariff policy, comprising a 10% minimum tariff on countries outside Canada and Mexico, with special higher rates for roughly 60 countries (see Appendix for full list).1 This analysis presents the fiscal and economic effects of both 1) the April 2nd policy, without considering the other tariffs that have gone into effect so far this year or international retaliation; and, 2) all US tariffs that have gone into effect in 2025, including the April 2nd policy, as well as incorporating the effects of all international retaliation implemented as of publication.2 Specifically, The Budget Lab assumed the following policies in effect:
- 20% broad tariff on all Chinese imports (effective February 4; increased March 4);
- 10% tariff on Canadian potash and energy (effective April 2);
- 25% tariff on all Mexican imports and other Canadian imports3 (effective March 4);
- 25% tariff on all automobiles, with an exemption for US content4 (effective April 3);
- 25% tariff on all steel and aluminum imports (effective March 12); and,
- The April 2nd announcement, as previously described.
TBL treated each of these policies as independent from one another and stacked them together. Its methodology largely follows prior tariff analysis. Note that certain commodities and products were carved out from the April 2nd announcement – the Budget Lab does not apply the rates from the April 2nd announcement to those commodities but does stack tariffs on those commodities from earlier announcements where applicable. All of Budget Lab’s analysis may be adjusted moving forward with more detail from the Administration on implementation.
Results
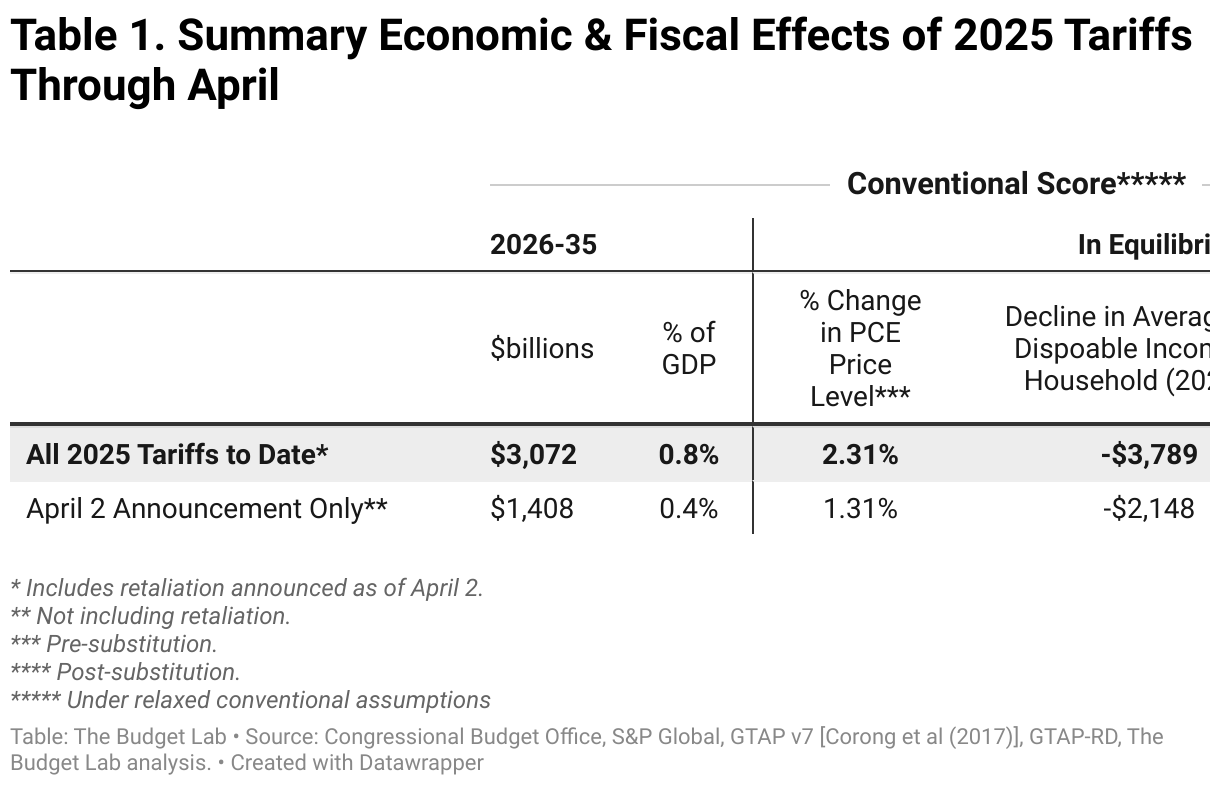
The table below summarizes the effects of both the April 2nd announcement in isolation and all the 2025 tariffs to date.
Average aggregate price impact
April 2 Only: The April 2nd tariffs alone constitute an increase in the average effective tariff rate of 11 ½ percentage points. That implies a rise in consumer prices of roughly 1.3% in the short-run, assuming no policy reaction from the Federal Reserve.5 This is equivalent to a loss of purchasing power of $2,100 per household on average in 2024 dollars.
All 2025 Tariffs: The April 2nd tariffs in tandem with the China, Canada, Mexico, automobile, and steel & aluminum tariffs already in effect (and the announced retaliation from other countries) imply an increase in the average effective tariff rate of just under 20 percentage points.6 That raises consumer prices by 2.3% all told in the short-run, assuming no policy reaction from the Federal Reserve, a loss of purchasing power of $3,800 per household on average in 2024 dollars.
U.S. real GDP effects
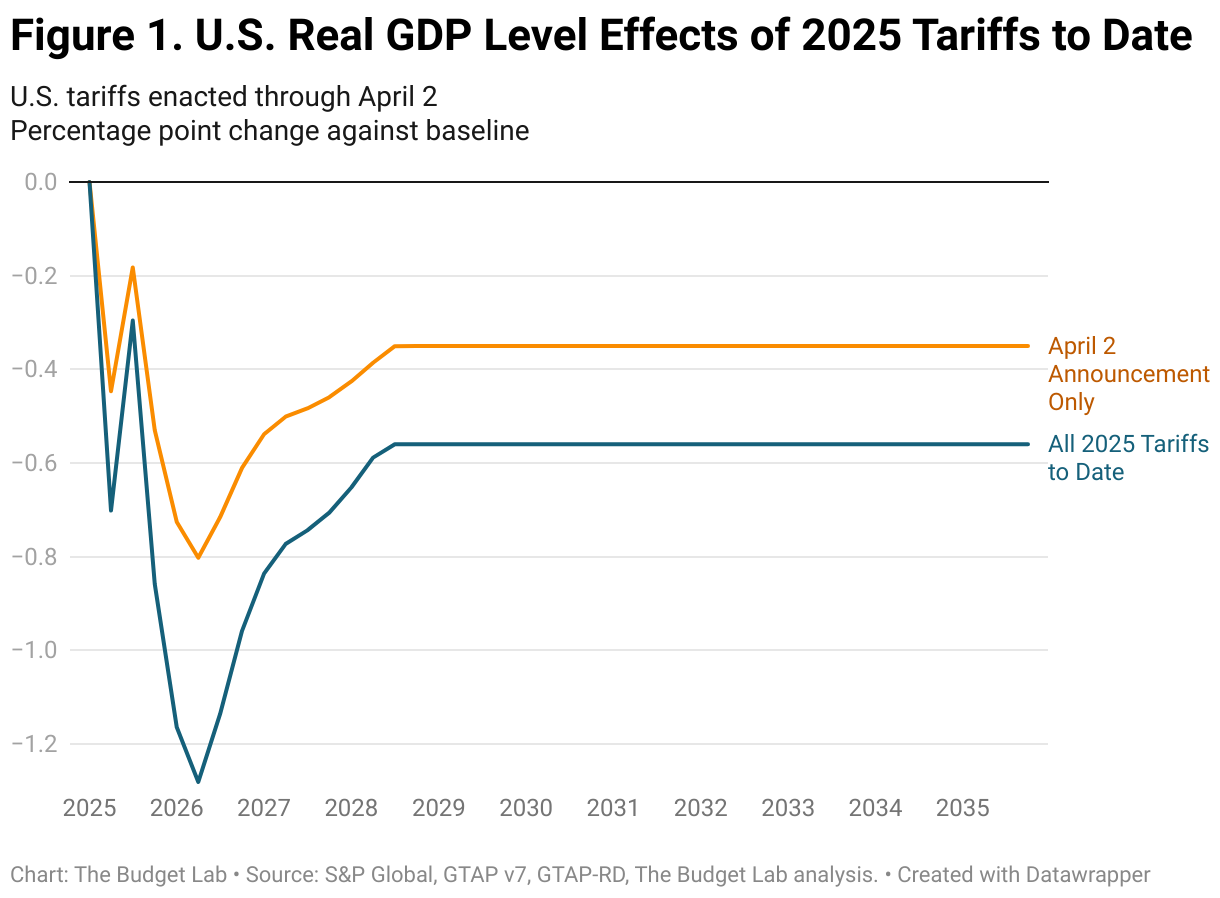
April 2 Only: The April 2nd tariffs alone reduce the size of the US economy in both the short- and the long-run. US real GDP growth is -0.5pp lower in calendar year 2025 and -0.1pp lower in calendar year 2026. After 2026, the level of GDP begins to recover modestly as production and supply chains reoptimize. But in the long-run, US output is still -0.4% lower from the April 2 announcement. That’s the equivalent of the US economy being permanently smaller by $100 billion annually in 2024 dollars. Real exports specifically are lower in the long-run by -10% under the April 2nd policy.
All 2025 tariffs: Accounting for all the 2025 US tariffs and retaliation implemented to date, real GDP growth is -0.9pp lower in calendar year 2025 and -0.1pp lower in calendar year 2026, while the level of real GDP is persistently -0.6% smaller in the long run, the equivalent of $160 billion 2024$ annually, while exports are -18.1% lower.
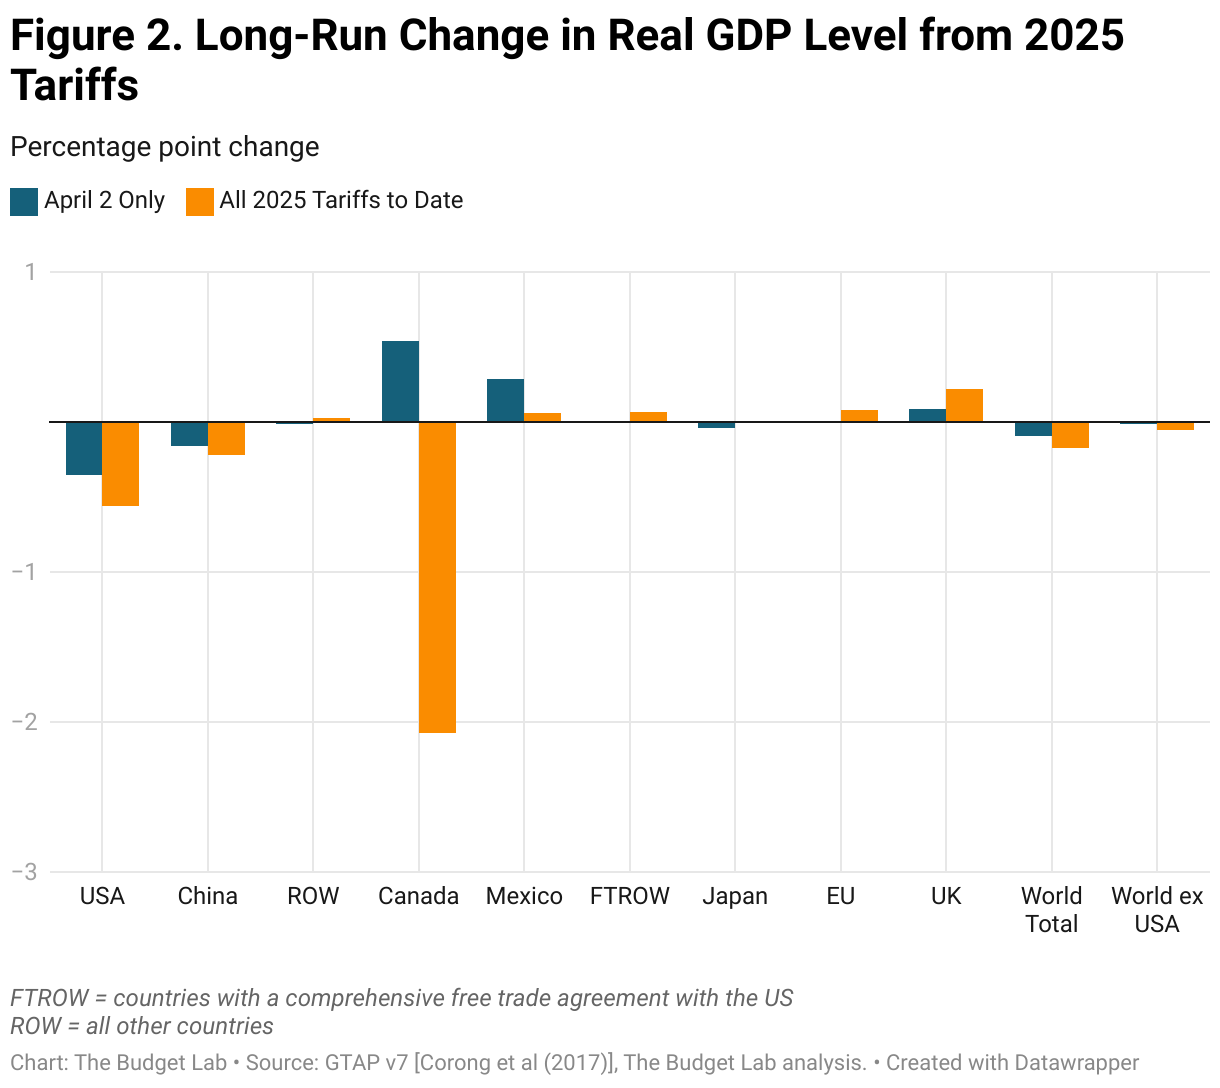
Global long-run real GDP effects
April 2 Only: In isolation, the April 2nd announcement only modestly affects the world economy on net outside the US (see the chart below). That’s mainly because Canada and Mexico were absent from the April 2 announcement, so when analyzed by itself, both countries gain materially from the policy in the long-run. China’s economy contracts slightly by 0.2% in the long run, while the UK sees a small 0.1% advantage.
All 2025 tariffs: A more accurate read of the global impact of US trade policy is to look holistically at all tariffs enacted so far. There, the story is obviously quite different from the April 2nd announcement in isolation. Canada has borne the brunt of the damage so far, with its long-run economy 2.1% smaller in real terms (reflecting both US tariffs and Canadian retaliation to date), but Mexico’s economy is if anything slightly larger in the long-run. China’s economy is 0.2% smaller while the UK’s is 0.2% bigger and the EU is 0.1% larger.
Fiscal impact & historical context
The April 2 tariffs alone were they to remain in place would raise $1.4 trillion over 2026-35 conventionally-scored.7 Given the negative output effects of the tariffs, there would be additional dynamic reductions in tax revenue as a result. Based on Congressional Budget Office rules-of-thumb, TBL estimates that these effects would total -$366 billion over the decade. All 2025 tariffs to date, incorporating the revenue effects of retaliation to date as well, would raise $3.1 trillion over 10 years conventionally-scored if they stayed in effect, with additional dynamic revenue effects of -$582 billion.
As mentioned earlier, the April 2nd announcement is equivalent to an 11 ½ percentage point increase in the average effective tariff rate. On its own, ignoring the other 2025 tariffs, that would be enough to raise the overall effective tariff rate to its highest since 1938. When including all tariffs implemented this year so far, the US average effective tariff rate is now at 22 ½%, the highest since 1909.
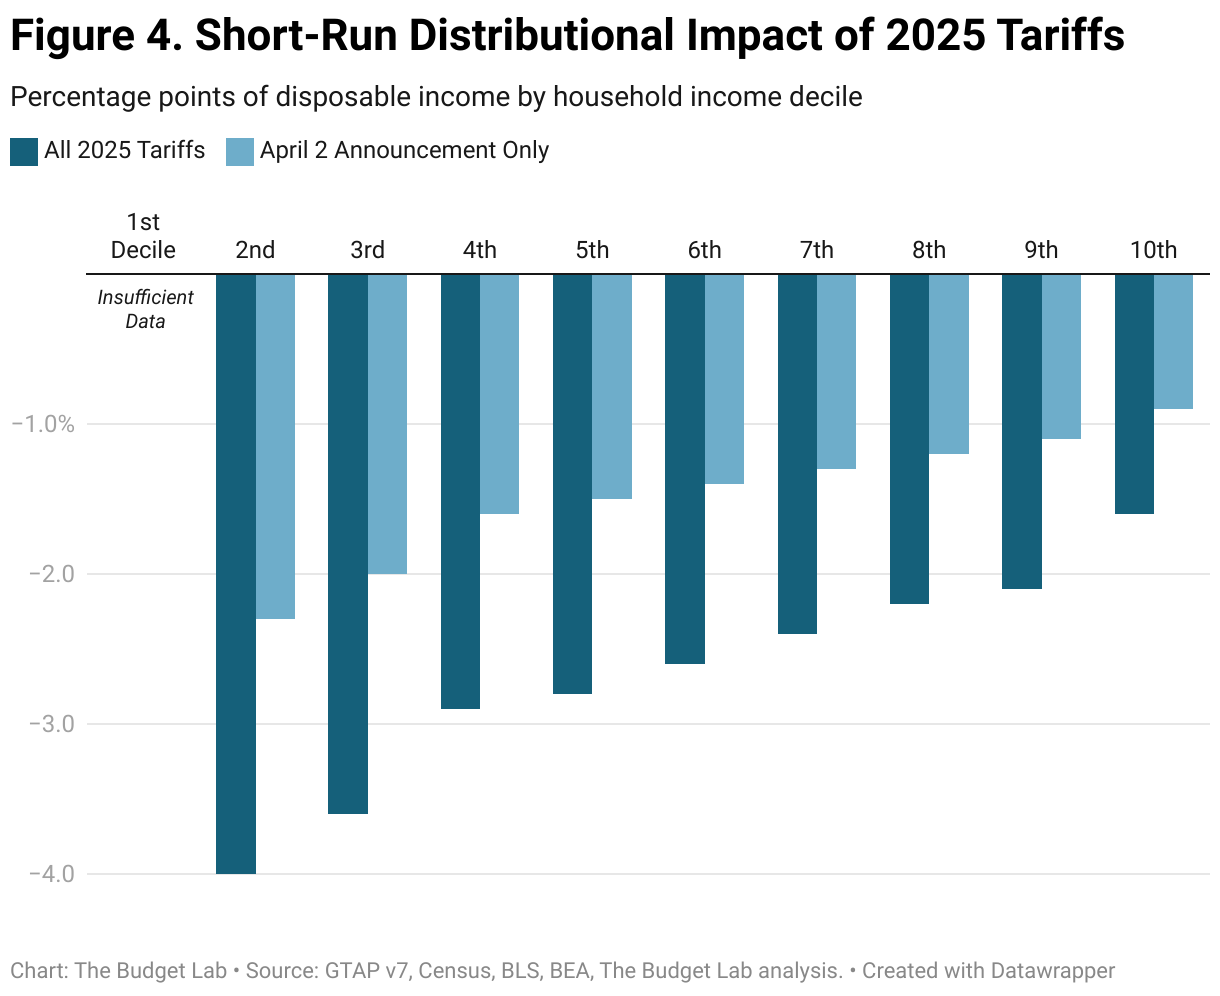
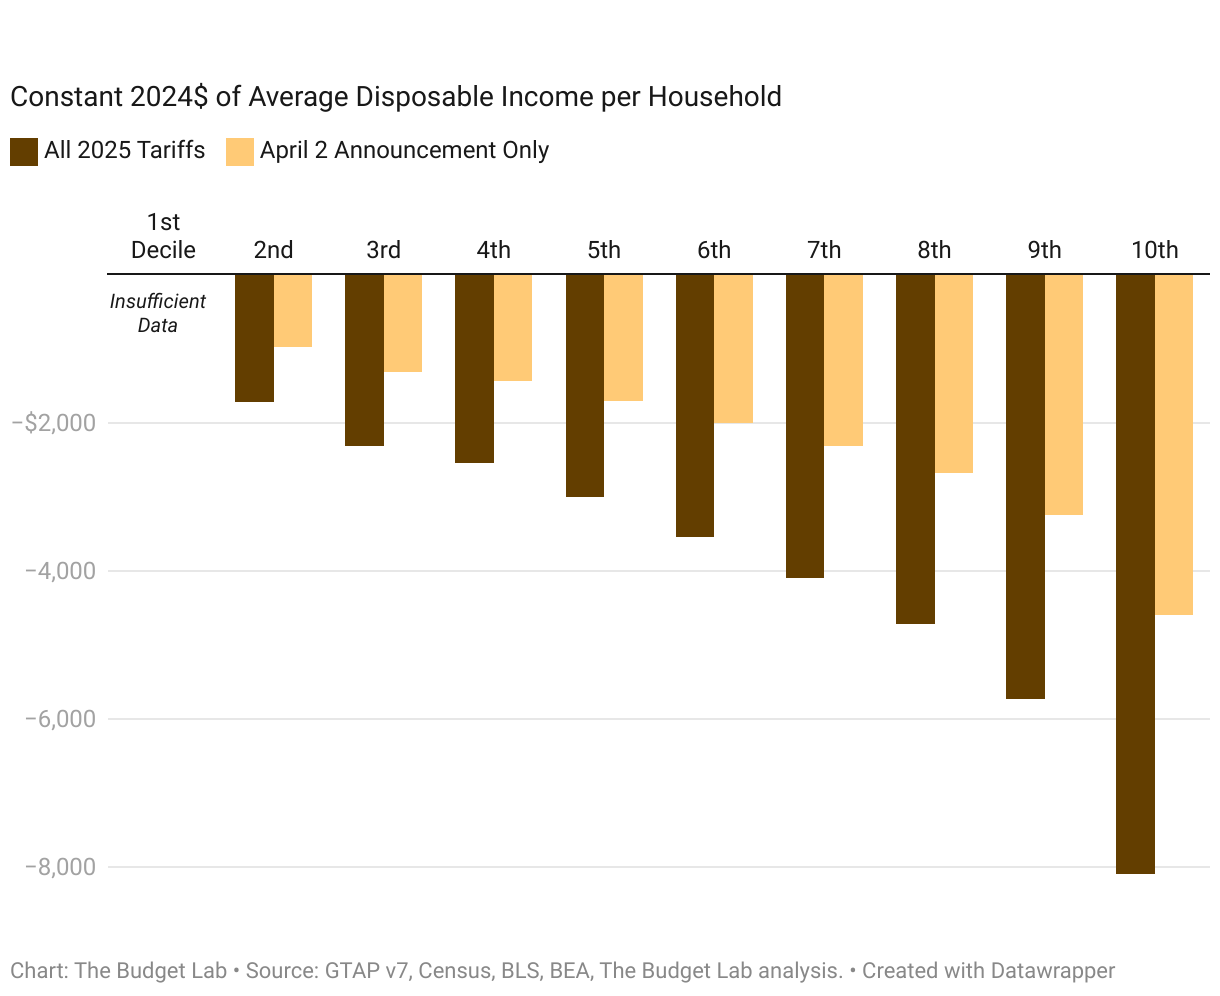
Short-run distributional impact
Tariffs are a regressive tax, especially in the short-run. This means that tariffs burden households at the bottom of the income ladder more than those at the top as a share of income.
April 2nd Tariffs. The percent change in disposable income resulting from the April 2nd tariffs on their own is 2.6x as much for households in the second decile by income as it is for households in the top decile: -2.3% versus -0.9%. Because income rises across the distribution more steeply than the tariff burden falls, the tariff burden in dollar terms is higher at higher incomes (bottom panel). For a household in the second lowest income decile, the April 2nd tariff policy leads to annual consumer loss of $980 per household on average in 2024$. For households in the middle, the burden rises to $1,700 per household on average, and for those in the top tenth, it averages $4,600 per household.
All 2025 tariffs. The regressivity is about the same when looking at all 2025 tariffs: the burden on the 2nd decile is 2.5x that of the top decile (-4.0% versus -1.6%). The average annual cost to households in the 2nd, 5th, and top decile rise to $1,700; $3,000; and $8,100 respectively.
Tariffs are more distributionally-ambiguous in the longer-run. Tariffs reduce both labor income and above-normal returns to capital, or rents. We assume that owners of capital hold rents rather than consume them in the short-run, but do consume them over their lifecycle in the long-run. The implication is that the tariff burden is more regressive in the short-run and more evenly-distributed across households in the long-run
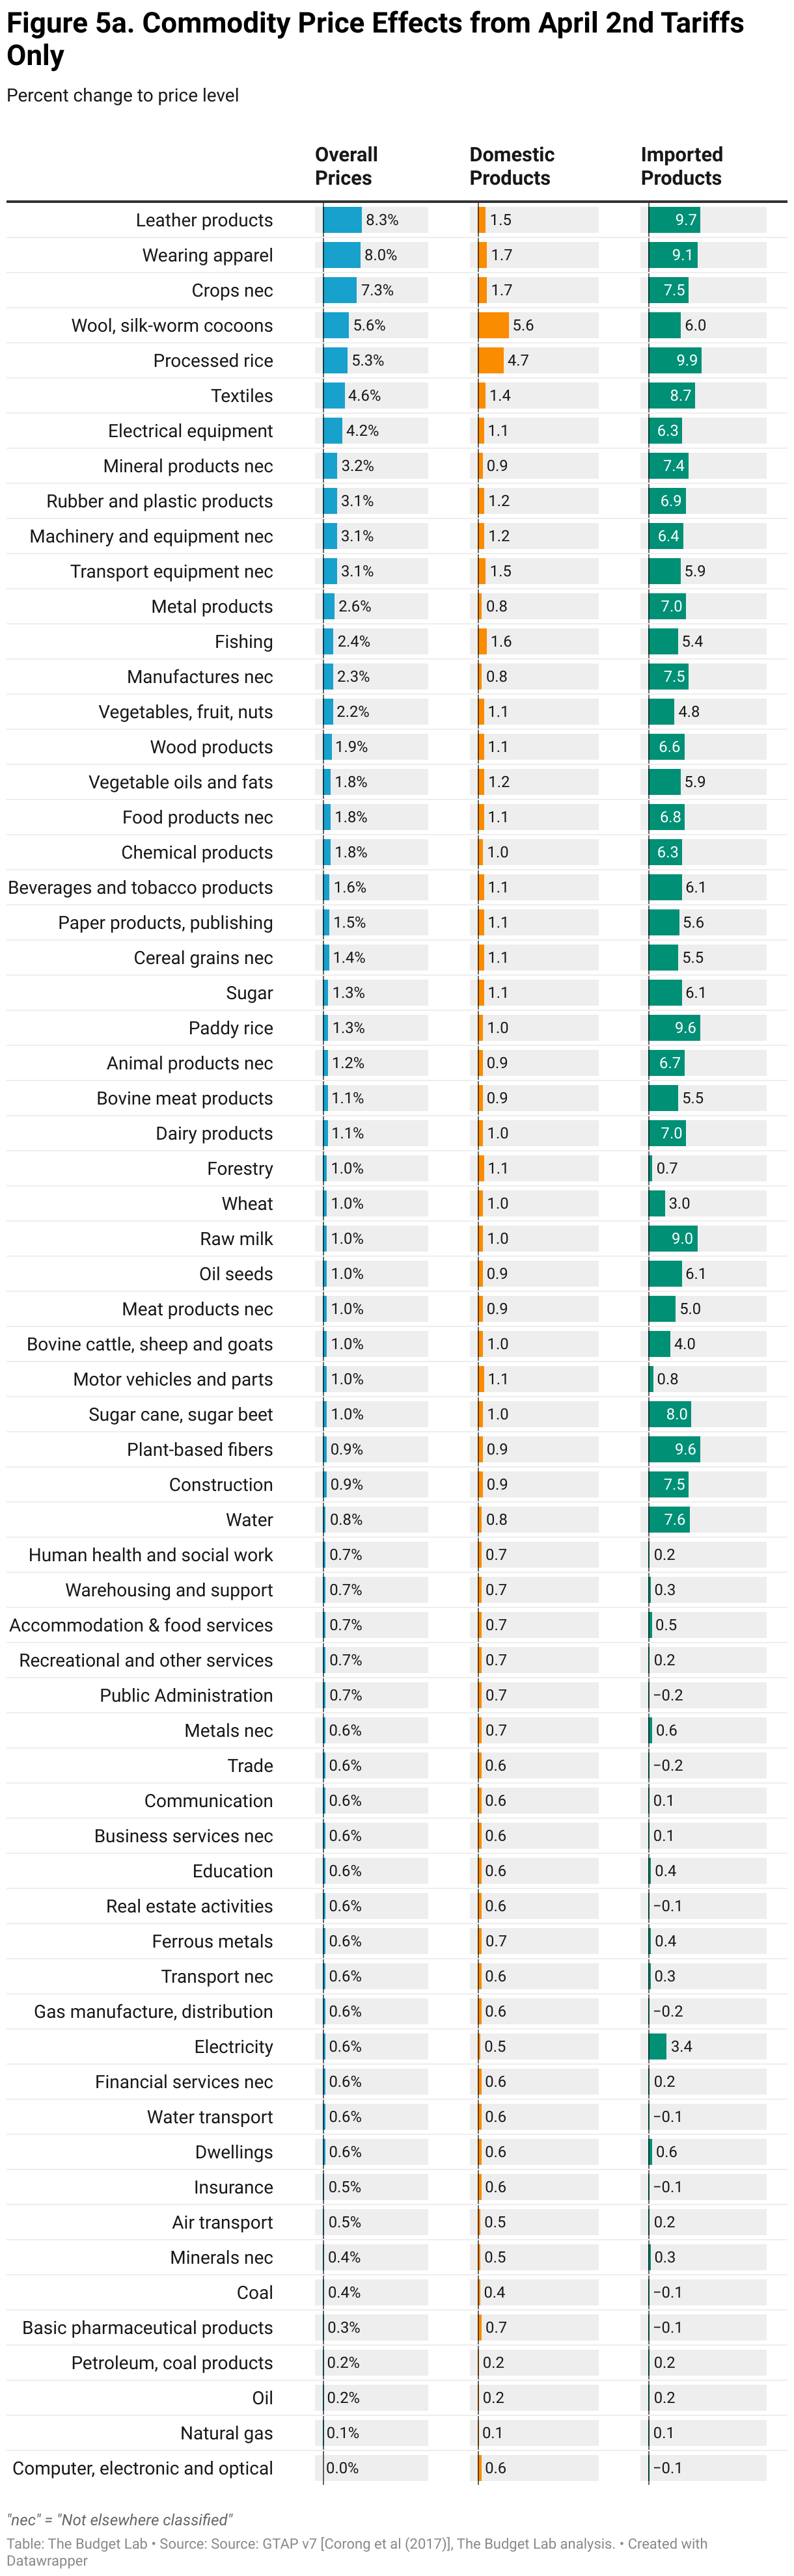
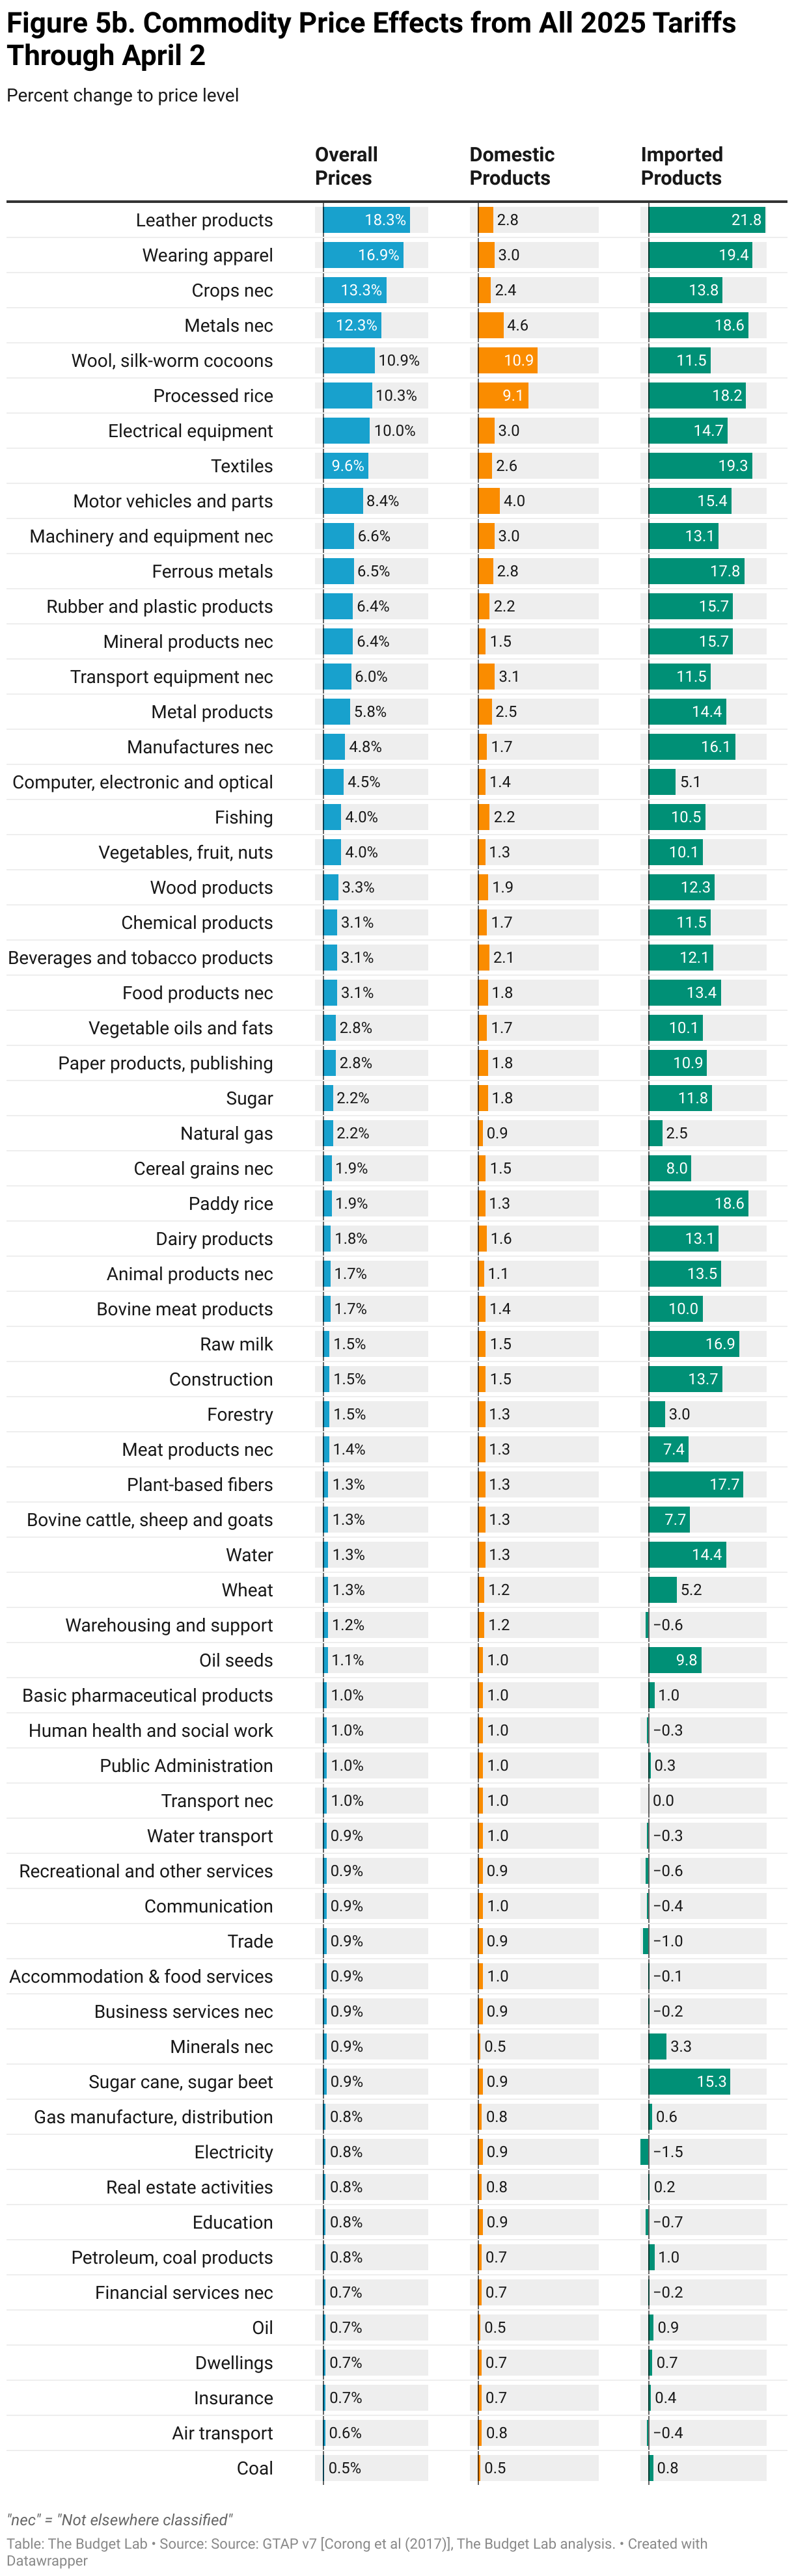
Commodity price effects
The charts below show how the 1.3% and 2.3% price level increases from the April 2 tariffs alone and all 2025 tariffs to date, respectively, would look across individual commodities. Some high level takeaways:
- Both the April 2nd tariffs themselves and all 2025 actions to date have disproportionately affected clothing and textiles. Apparel prices rise 8% from the April 2nd action alone and 17% from all US tariffs.
- Food prices are also disproportionately affected, rising 1.6% from the April 2nd policy (roughly equivalent to the last year’s worth of grocery inflation in CPI) and 2.8% from all 2025 tariff actions. Fresh produce rises 2.2% and 4.0%, respectively.
- Motor vehicle prices are largely untouched by the April 2nd announcement but rise by 8.4% under all tariff action to date, the equivalent of an additional $4,000 to the price of an average 2024 new car.8
Footnotes
- The tariffs announced on April 2 apply to most imported goods but exempt steel, aluminum, and autos—which have already been tariffed separately this year—as well as copper, pharmaceuticals, semiconductors, lumber, energy, and critical minerals. TBL carved out these commodities in its analysis of the April 2 announcement.
- TBL incorporated Canada’s retaliation announcements of March 4 and March 13 as well as China’s February 4 and March 4 announcements, since all four are in effect as of publication. The European Union’s March 12 announcement is currently delayed as of publication and so is not incorporated in TBL’s analysis.
- Unlike prior analyses, based on the information in the April 2nd EO, TBL now assumes that the USMCA exemption continues indefinitely, under the assumption that 49% of imports by value from Mexico are exempt under USMCA, and 38% of imports from Canada are exempt. This lowers some impacts from previous analyses.
- TBL assumed that 40% of automobile content in imported motor vehicles from Canada and Mexico are of US origin.
- TBL assumed no retaliation for the purposes of the April 2 announcement, and that therefore dollar appreciation offsets roughly a third of the consumer burden of the tariffs, our conventional non-retaliation assumption. For all 2025 tariffs, TBL assumed that global retaliation to date will mitigate dollar appreciation by half.
- Note that crucially this incorporates assumptions about USMCA-exempt trade with Canada and Mexico as well as exempt US-origin content in foreign autos.
- TBL employs a “relaxed conventional” assumption for the retaliation scenario, whereby foreign income is permitted to fall but US income remains fixed.
- This effect is lower than TBL’s previous analysis of the 25% automobile tariffs primarily because TBL now assumes, based on the wording of the April 2nd EO, that the USMCA exemption on trade with Canada and Mexico will remain in effect indefinitely.