No Tax on Tips, Overtime Would Worsen Tax Rate Dispersion
Key Takeaways
-
No tax on tips and overtime would exacerbate horizontal inequities in the tax code: two people earning the same amount in wages could face different tax rates.
-
For some groups of tax filers that are the same family size and earn the same amount of money, variation in tax rates would more than double.
-
Today, wage income is generally taxed in the same manner for everyone. No tax on tips and overtime would open the door to treating wages differently based on who is earning it (e.g., tipped workers) and how it is earned (e.g., more than 40 hours in a week).
Note: the code used to produce the calculations in this report can be found here.
Tax breaks for specific types of income have been a recurring policy topic during the 2024 presidential election cycle. In June, former President Trump proposed a new tax exemption for tips—a policy which Vice President Harris later similarly proposed in a more limited form. President Trump has also proposed ending taxes on overtime pay and Social Security benefits. The Budget Lab has analyzed the budgetary and distributional effects of these ideas in a series of reports.
One common feature of these proposals is that they would create a situation where taxpayers with the same income pay different tax rates. Tax policy which favors one form of income over others tends to worsen horizontal equity—the notion that similarly situated filers should face similar tax burdens. A recent Budget Lab report presents an overview of this topic and develops a framework for measuring horizontal equity for different tax proposals.
In this post, we look at how two 2024 campaign proposals—no tax on tips or overtime pay—would increase variation in tax rates among similarly situated filers.
No Tax on Tips and Overtime – Exacerbating Horizontal Inequity
It is perhaps intuitive that “no tax on tips” and “no tax on overtime” would worsen horizontal inequity: two people earning the same amount of income but one primarily earning their wages through tips or a good chunk in overtime pay would face different tax burdens under these policies. But it’s worth briefly refreshing on why taxpayers today face different tax rates to begin with—and how these proposals would be a departure from the status quo.
Most tax rate variation is due to differences in income and family size. Under a progressive income tax system, higher-income families pay a greater fraction of their income in taxes. And the tax code generally adjusts for the fact that that larger families have lower incomes on a per-person basis. But even controlling for income and family size, tax rates still vary due to tax breaks for certain kinds of spending (e.g. mortgage interest or childcare) and preferential treatment of certain kinds of income (e.g. capital gains and business income).
Importantly, tax preferences for tips and overtime would open the door to a new type of horizontal inequity that isn’t based on family size, composition of spending, or substantive economic differences in income type. Under these proposals, wage earnings would be taxed differently based on who (e.g., tipped workers) or how (e.g., extend hours over 40) wages are earned. That’s in contrast to the current system, where wage income today faces the same tax rate regardless of occupation or hours worked.
Quantifying the Effect on Tax Rate Dispersion
Below, we estimate the magnitude of the impact of these policies on horizontal inequity and identify which earners across the income distribution would experience greater divergence in tax burdens compared to similarly situated filers. While there’s no single way to measure the impact of a policy change on horizontal equity, the basic idea is to first identify the component of variation in average tax rates today that cannot be explained by income or family size, and then see how that variation would change under a tax code with the proposed policy change in place.
In this analysis, we measure horizontal equity by running our tax model, grouping simulated tax units by income and family type, and then calculating within-group measures of tax rate dispersion. We use a straightforward measure of dispersion: the interquartile range (the 75th percentile tax rate minus the 25th percentile tax rate within each group).1
To make this idea concrete, Table 1 shows three examples of the interquartile range of tax rates within groups in 2025. Most low-income parents have no taxable income to begin with, so new tax deductions don’t affect the dispersion of tax rates. But for groups who face positive tax rates and have a relatively high proportion of tax units with tips or overtime pay, the effect of a new deduction for these kinds of earnings is to widen the range of tax rates. For example, among unmarried parents at the 50th percentile (about $59,000/year) the variation in tax rates paid by this group would more than double as a result of these policies. Similarly, among married parents with one child at the 90th percentile (about $200,000/year), the variation in tax rates paid would increase by 80%.
Table 1. Illustrative Examples of Within-Group Tax Rate Dispersion, 2025
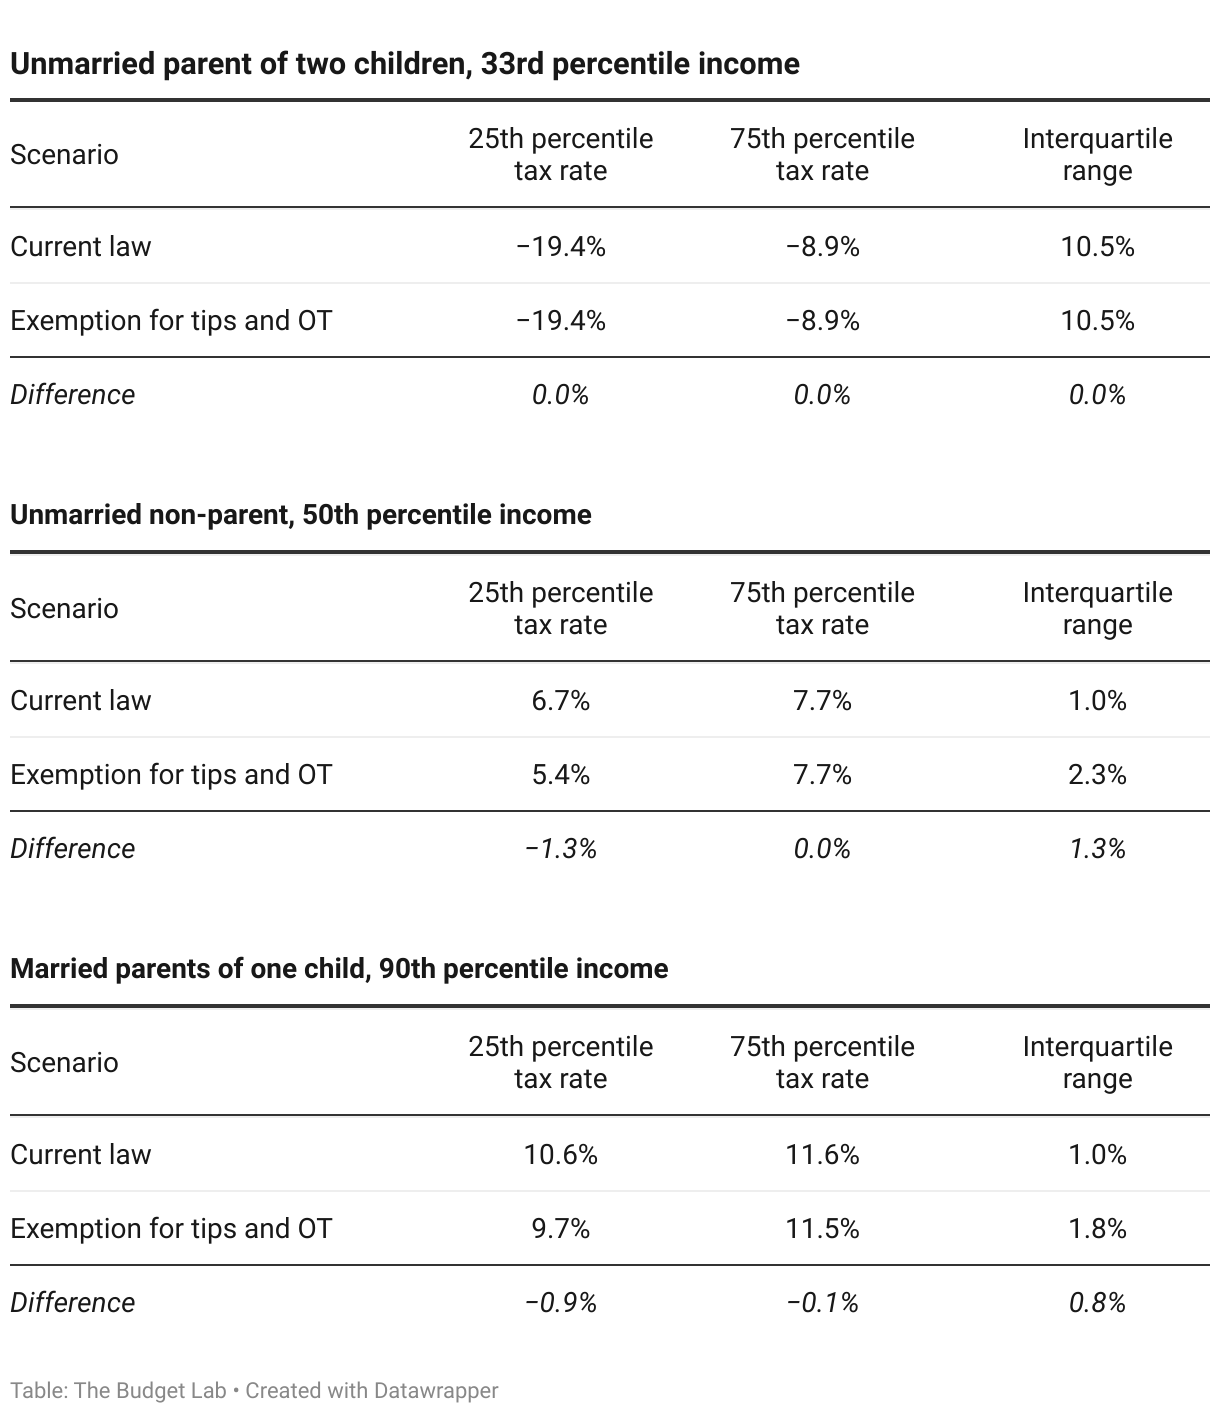
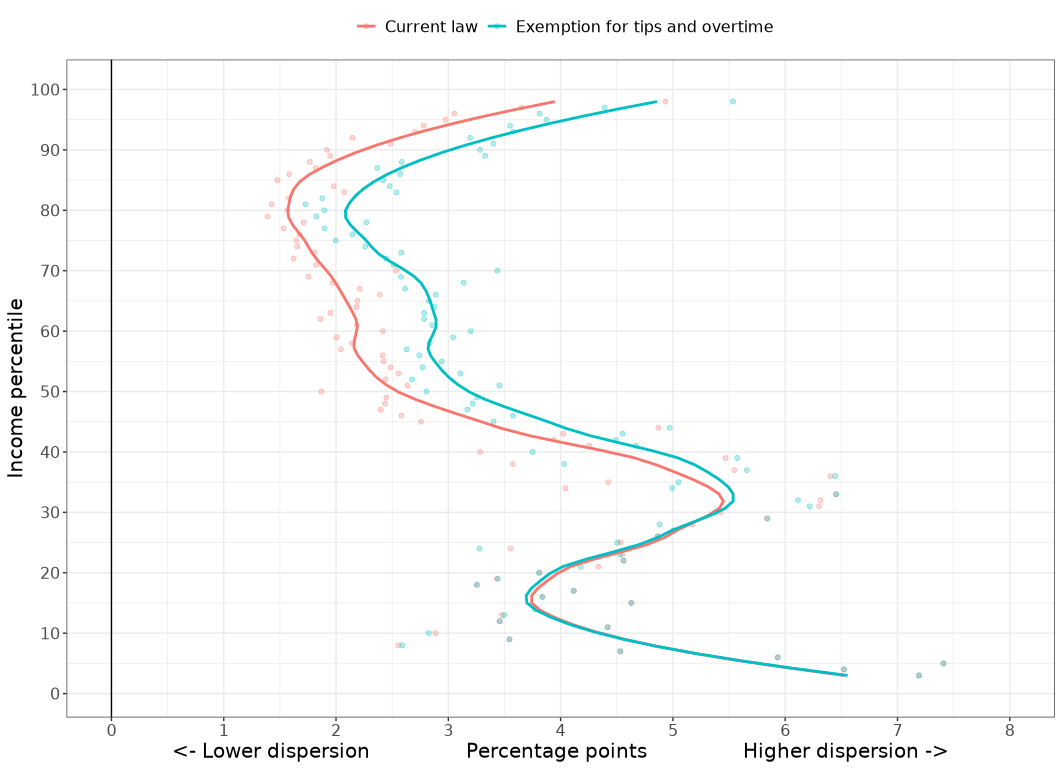
Figure 1 shows the effects depicted in Table 1 but across the entire income distribution. Dispersion is currently highest among low incomes (where tax rates can be steeply negative due to refundable credits) and at high incomes (where taxpayers are more likely to benefit from preferential tax rates on business and investment income). Exempting tips and overtime pay from tax would worsen tax rate dispersion most for middle- and upper-middle income groups, but not much at the low end due to low taxable incomes. For example, the current-law interquartile range of tax rates for the 60th percentile of income is just over 2 percentage points. But with tax exemptions for tips and overtime, the interquartile range would rise to about 3 percentage points.
Figure 1. Average Within-Group Interquartile Range, 2025
Conclusion
Why should we care about horizontal equity? A horizontal inequitable code is one with many tax preferences for specific activities or forms of income—and as a result, it may be associated with loopholes, inefficient tax avoidance, and notions of unfairness. To be sure, variation in tax rates may reflect genuine policy preferences among the public; the tax code is often a convenient vehicle for delivering subsidies in areas like health insurance, homeownership, and clean energy. But policymakers should weigh the benefits of any activity-specific tax breaks against these potential costs.
Exempting tips and overtime from tax would exacerbate horizontal inequity in the tax code and introduce a new form of inequity: treating the same type of income (wages) differently based on who earns it or how it is earned. This treatment would represent a notable break from current law, since most wage income is fully taxable regardless of source. As the analysis above shows, the impact of this shift is not insignificant. For some similarly situated filers, it would double the current level of inequities in the code.
Footnotes
- Here, groups are defined by combinations of income percentile (1-100), marital status (married/unmarried), and number of dependents (0-3). Average tax rate is defined as net income tax liability (inclusive of refundable credits) divided by expanded income (AGI plus: above-the-line deductions, nontaxable interest, nontaxable pension and OASI income, and employer-side payroll taxes).