
The Effect of Tariffs on Poverty
Key Takeaways
-
Because tariffs directly reduce the purchasing power of low-income households (either by decreasing nominal incomes or by increasing prices), they also affect poverty.
-
We estimate that the Trump administration’s new 2025 tariffs will increase the number of Americans living in poverty by between 650,000 and 875,000 (between 0.2 and 0.3 percent of the U.S. population), depending on the poverty measure used.
Tariffs, like all indirect taxes, reduce the purchasing power of households’ incomes by increasing prices in the economy or by decreasing nominal incomes.1 This loss of purchasing power—a reduction in what economists call “real” incomes—represents the direct economic burden of tariffs. Because patterns of spending differ across households, this burden is felt unevenly. The Budget Lab has previously estimated and discussed how the Trump administration’s tariffs will affect households differently across the income distribution.
Another way to measure these distributional impacts is to look at poverty rates. Tariff increases affect poverty in a straightforward way: because poverty is measured by comparing household incomes to an inflation-indexed threshold, and because tariff-driven price hikes will increase that threshold but leave most forms of income unchanged, more families will fall below the poverty threshold.
To estimate the size of this effect, we begin with The Budget Lab’s estimates of how tariffs impact different prices in the economy.2 Then, we calculate how those price changes flow through to poverty thresholds and incomes. Finally, after updating these values in the official survey data to reflect the effects of tariffs, we recalculate poverty rates. See the Appendix for further details and replication code.
There are two major measures of poverty in the US produced by the Census Bureau. The first is the Official Poverty Measure (OPM), a long-running measure of poverty that compares cash income to an inflation-indexed threshold. The other is the Supplemental Poverty Measure (SPM), a more comprehensive measure which takes into account more information on household resources and the cost of living.3 We produce estimates for both the OPM and the SPM.
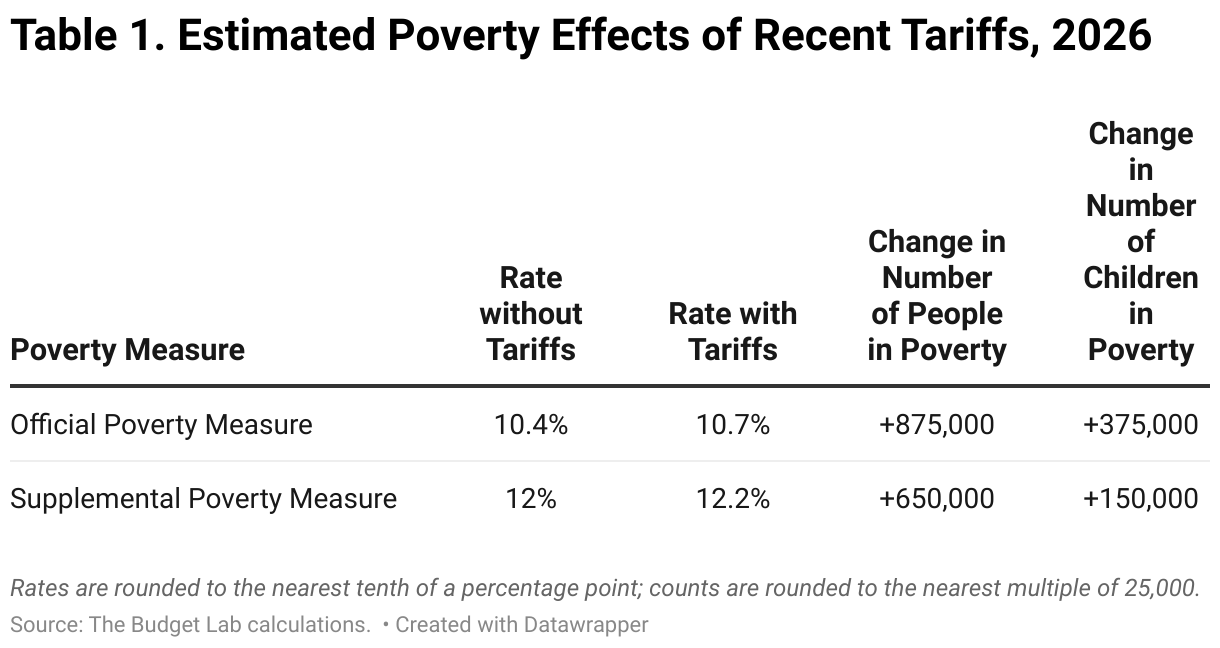
Table 1 shows the results of our exercise. We estimate that the Trump administration’s tariffs in place as of September 3rd will lead to about 875,000 more people, about 375,000 of whom are children, living in poverty according to the OPM. This number reflects an increase in the OPM from 10.4 to 10.7 percent. The picture is similar for the SPM, where the rate would rise from 12.0 to 12.2 percent—an increase of about 650,000 people, including 150,000 children.
Appendix
Replication code for this analysis can be found here.
Projecting the ASEC Microdata
We begin with the latest person-level Current Population Survey Annual Social and Economic Supplement (CPS ASEC) microdata, which contains poverty status information for 2023, via IPUMS CPS. The first step is to “age” the data forward to 2026 using demographic and macroeconomic projections from the Congressional Budget Office (CBO):
- For each age-by-marital status combination, we calculate the ratio of population in 2026 to 2023. We apply these ratios to record weights based on age and marital status.
- We multiply Social Security income by a factor that reflects implied per-recipient growth in OASDI benefits from 2023 to 2026.
- We grow other sources of net income, including SPM-concept taxes, at the projected rate of per-capita GDP growth from 2023 to 2026.4
- We grow OPM and SPM thresholds with CPI-U inflation. For the latter case, this represents an assumption that, absent tariffs, the food, clothing, shelter, utilities, telephone, and internet (FCSUti) price index used for the SPM would have grown at the rate of overall inflation.
This gives us a baseline projection of the population for 2026. Because we project that the economy will grow faster than inflation, we project that poverty will fall slightly over the next few years in the absence of any policy changes relative to current law.
Estimating the Effect of Tariffs on OPM and SPM Thresholds
While The Budget Lab regularly produces estimates of how tariffs affect the personal consumption expenditures (PCE) price index, we have not to this point estimated impacts on other price indexes with different consumption baskets. Therefore, the next step is to determine how tariffs affect CPI-U (to update the OPM thresholds) and the FCSUti price index (for SPM thresholds).
The Budget Lab’s tariff estimates are based on the output of the GTAP model, which produces price shock estimates for 65 sectors. To produce an estimate for CPI-U, we map these sectors to their closest CPI-U category according to judgment and, where possible, information about the relationship between GTAP sector, the Central Product Classification system, and the Classification of Individual Consumption by Purpose system. Then, we weight GTAP’s sectoral price impacts by December 2024 CPI-U importance weights provided by the Bureau of Labor Statistics (BLS) and apply this delta to arrive at our counterfactual poverty threshold. We do the same exercise for FCSUti using BLS’s 2024 weights. See the “/resources/tariff_inputs” folder in the replication code for our assumed category mappings.
The resulting average tariff-induced price index increases are 1.7 percent for PCE price index, 2.1 percent for CPI-U, and 1.9 percent for the FCSUti index. This estimated CPI-U/PCE spread is consistent with historical averages, and the FCSUti impact being lower than the CPI-U estimate is consistent with the relative price impacts of tariffs across categories of goods.
Accounting for Indexation of Taxes and Transfers
The final step in our analysis is to adjust the elements of net income that are indexed to inflation. For the OPM, the categories we adjust are Social Security Old Age, Survivors, and Disability Insurance (OASDI), Supplemental Security Income (SSI), and veterans’ benefits. We make the simplifying assumption that these cost-of-living adjustments (COLAs) track CPI-U under the tariff price shock. For the SPM, in addition to the categories described above, we also adjust Supplemental Nutrition Assistance (SNAP) benefits (by the estimated impact on food prices) and net federal income tax liability. The latter is more complicated, given that the size of the inflation adjustment to tax liability interacts with economic and demographic attributes. To impute values for the tariff price shock-driven tax change in our projected ASEC data, we first simulate the effects of a 1 percentage point increase in the price level resulting from an indirect tax increase using our tax microsimulation model. Then, based on the microdata output from that model, we run a random forest model where tax change is a function of 2026 net income tax liability, marital status, and number of children. Finally, we fit the model's prediction for each SPM unit in our ASEC microdata and scale the results to reflect the larger 2.13 percent change from these tariffs.
Footnotes
- To be precise, tariffs in and of themselves do not increase the price level but rather create a wedge between consumer prices and factor prices. Whether this wedge is resolved in the form of higher prices (passed “forward”) or lower nominal incomes (passed “backward”) depends on monetary policy set by the Federal Reserve, though it is important to note that these scenarios are economically identical to a first approximation. In this analysis, we assume that the Federal Reserve chooses the pass-forward option, and thus as shorthand we refer to tariffs as increasing prices. Refer to our report on value added taxes for further discussion of this topic.
- For this exercise, we assume that the current tariff policy stays in effect in perpetuity.
- More information on the OPM and SPM can be found here.
- Note that this simplifying assumption means that any tax changes in the July reconciliation bill above and beyond extending the 2017 TCJA tax cuts are not included in our 2026 baseline SPM estimate. Any bias this assumption introduces in our results is likely immaterial for two reasons. First, these new provisions provide tax relief to those with positive tax liabilities only—a subset of families with incomes generally well above the poverty line. Second, because those changes are missing from both the baseline and tariff scenarios, this assumption does not affect the estimated change in poverty induced by the policy.