
Distributional Effects of Selected Provisions of the House and Senate Reconciliation Bills
Key Takeaways
-
Changes to taxes and Medicaid and SNAP spending proposed by the Senate budget reconciliation bill would result in a decline of 2.9 percent (about $700) in income for the bottom quintile, but an increase of 1.9 percent (about $30,000) for the top 1 percent.
-
The Senate version of the bill is broadly similar in its regressivity to the version passed by the House of Representatives, with deeper cuts to Medicaid partly offset by shallower cuts to SNAP.
-
Compared to the House version, the version of the bill under consideration by the Senate would lead to larger declines in income for those at the bottom of the income distribution ($700 in the Senate version, a 2.9-percent decrease, versus $600 in the House version, a 2.5-percent decrease, for those in the bottom 20 percent).
-
The Senate version of the bill would lead to smaller average increases in income for those in the top 20 percent of the distribution compared to the House version ($5,700 in the Senate version versus $6,500 in the House version).
-
Policymakers have said that they will partly pay for the spending in this legislative package through tariffs. As prior Budget Lab analysis has shown, the overall impact of the combination of tariffs and changes in taxes and spending would be even more regressive than shown in this analysis.
This report analyzes the distributional effects of selected tax and spending provisions of two versions of the budget reconciliation bill currently under consideration by Congress:
- The One Big Beautiful Bill Act (OBBBA) passed by the House of Representatives on May 22; and
- The version of the bill posted on the Senate Budget Committee website on June 27, with adjustments based on reporting about changes to the bill since then (described below).
This analysis updates a previous report from The Budget Lab focusing on the distributional effects of the tax provisions in each version of the reconciliation bill. In addition to the tax changes included in that report, this analysis includes the changes in each version of the bill to Medicaid and the Supplemental Nutrition Assistance Program (SNAP, commonly known as food stamps).
(This analysis does not consider the combined effects of these tax and spending changes with recent changes to tariffs, as in a previous Budget Lab report; such an analysis from The Budget Lab is forthcoming.)
The results of this exercise are shown in the tables and figures below, which display average annual changes in after-tax-and-transfer income over the 2026-2034 period (in 2025 dollars). The overall effect of these policy changes would be regressive, shifting after-tax-and-transfer resources away from tax units (members of a household filing a tax return together) at the bottom of the distribution towards those at the top.
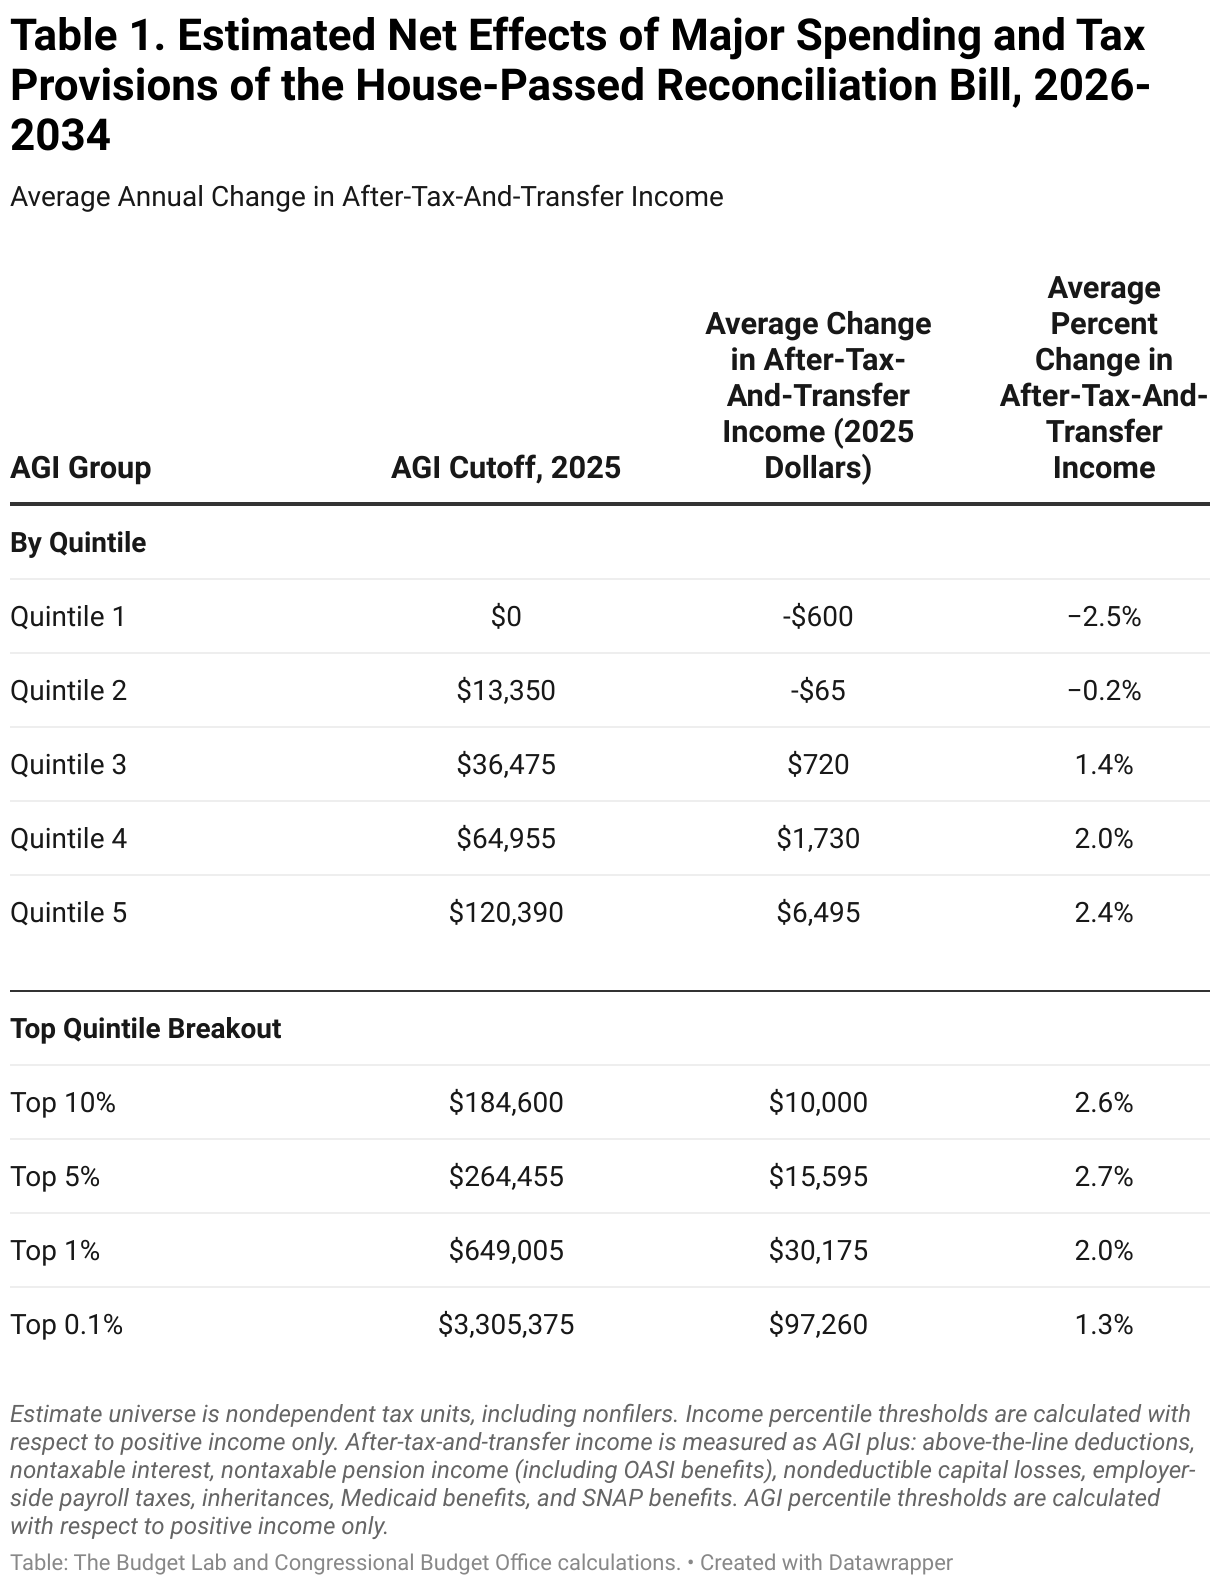
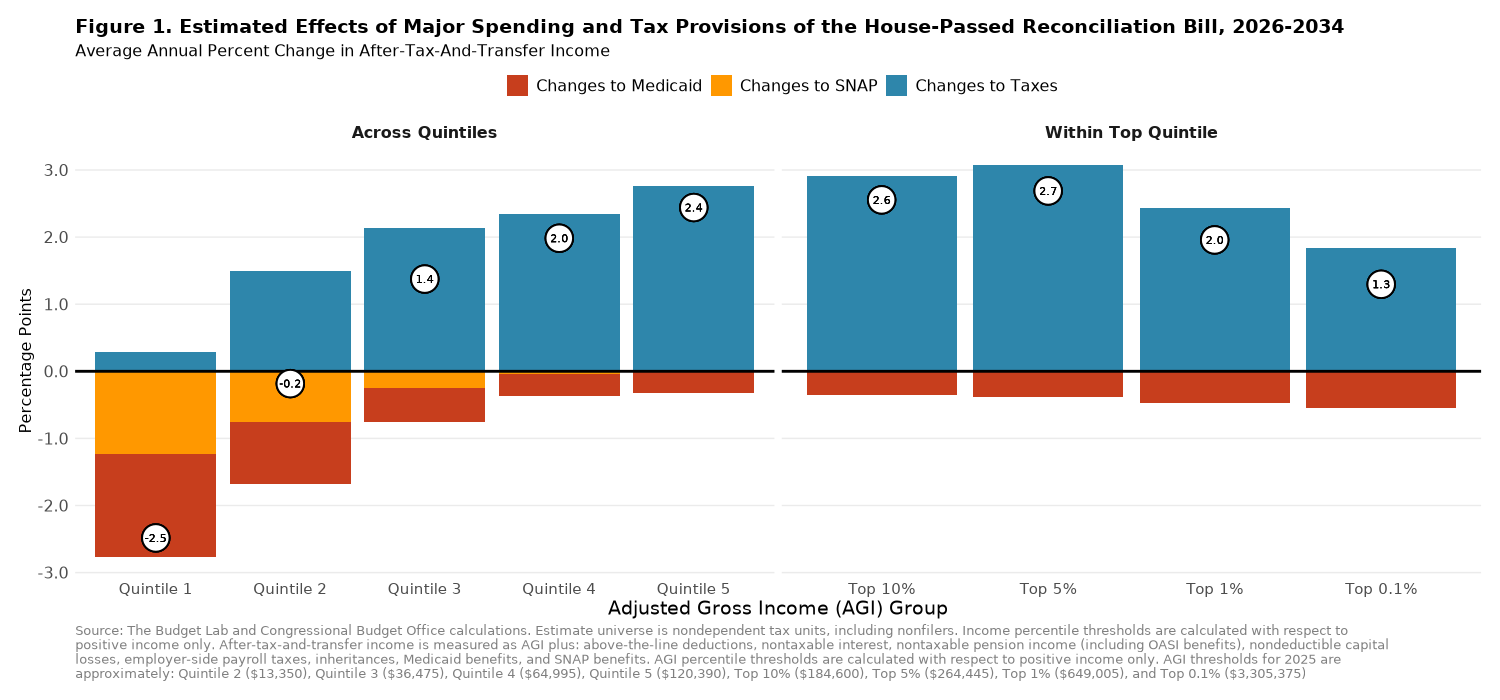

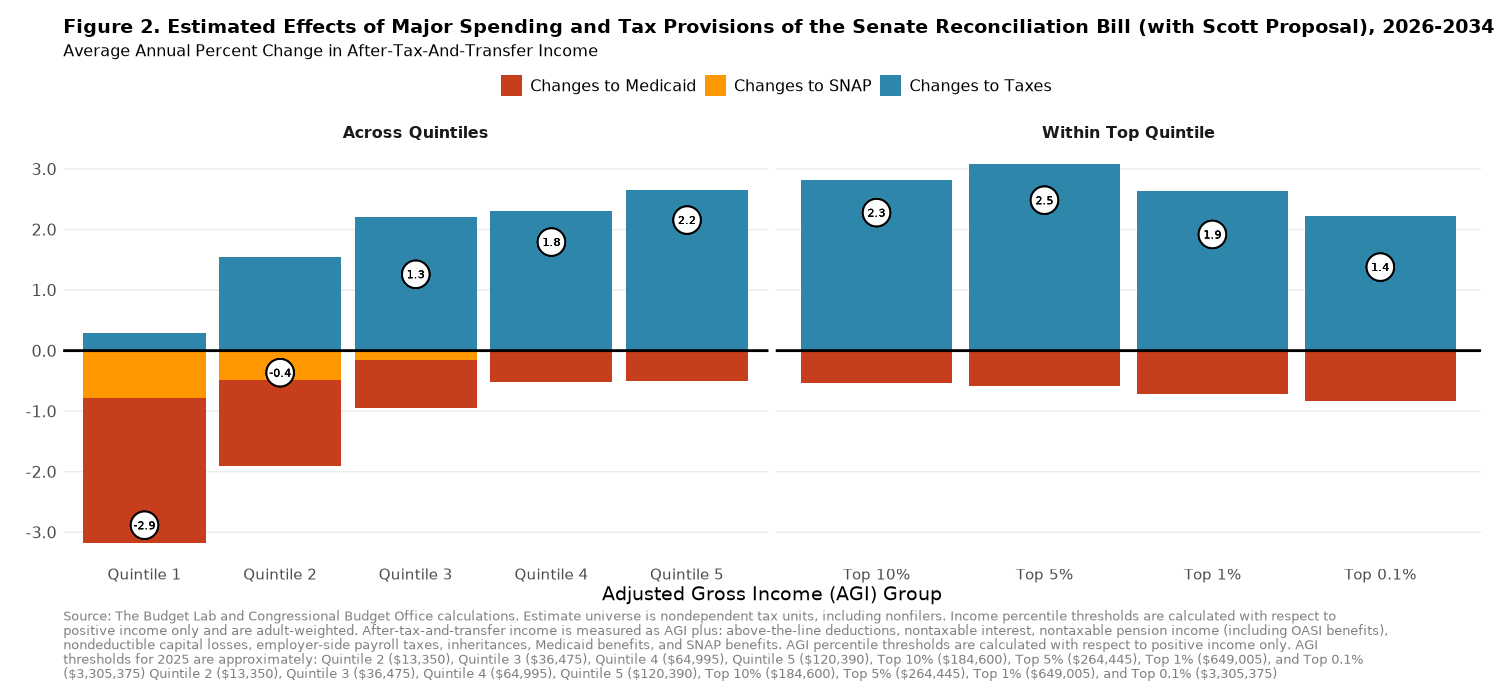
Tax units in the bottom 20 percent of the distribution would see an average reduction in incomes of 2.9 percent (about $700) in the Senate version of the bill, while those in the top 20 percent would see an increase of 2.2 percent (about $5,700). (In the House version of the bill, these groups would see a decrease of 2.5 percent, or about $600, and an increase of 2.4 percent, or about $6,500, respectively.) The two versions of the bill are broadly similar in their regressivity. While the Senate version of the bill would lead to larger losses at the bottom of the income distribution than the House version, it would also lead to slightly smaller average gains for those in the top quintile.
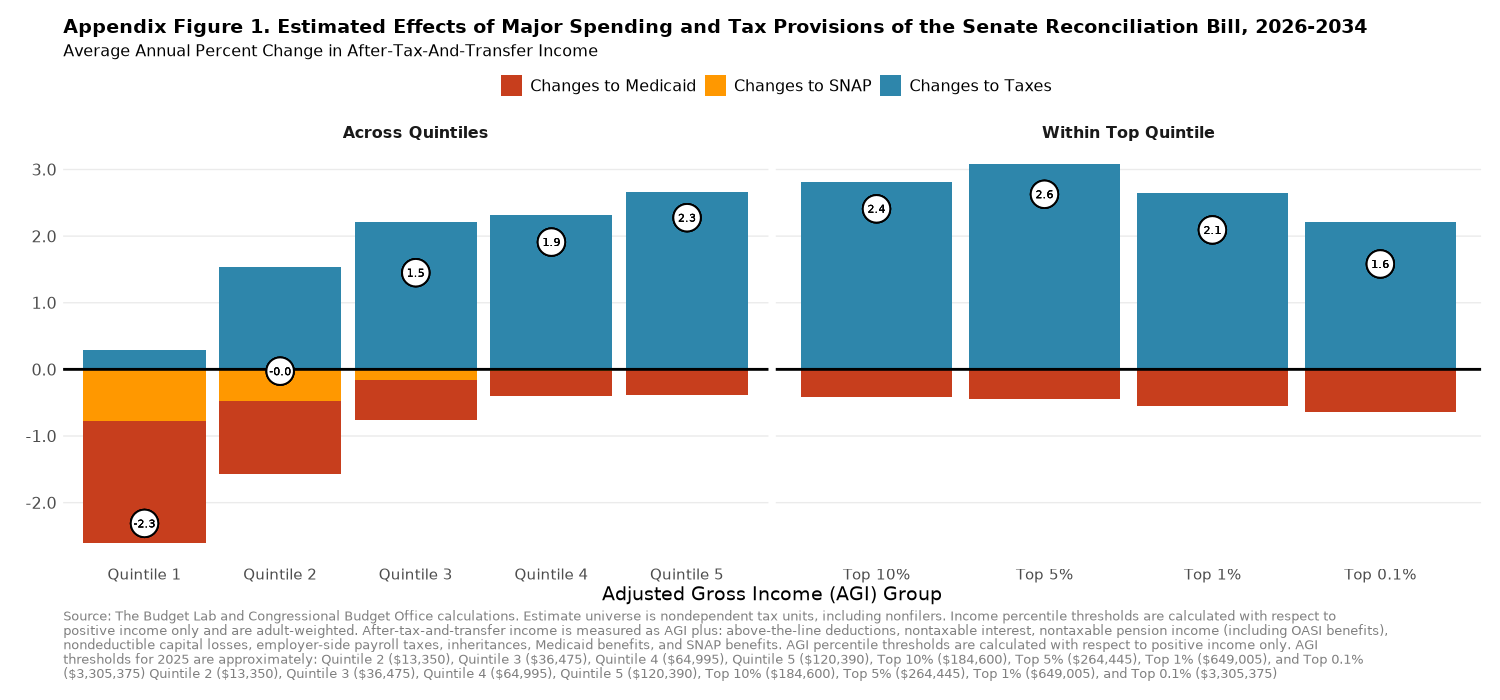
As noted above, our analysis of the Senate version of the bill includes adjustments based on reporting on changes made to the bill since June 27. In particular, we include a provision reducing the Federal matching rate for certain Medicaid enrollees in the ACA expansion population proposed by Senator Rick Scott of Florida that would reduce Federal spending on Medicaid by $313 billion over the 2025-2034 period. The Budget Lab plans to update its analysis of the Senate version of the bill as additional details about this provision (and others) emerge in the days ahead. (For reference, a version of the tables and figures including only provisions posted on June 27 and excluding the Scott amendment can be found in the Appendix below.)
Appendix
Distributional Effects of Selected Provisions of the Senate Reconciliation Bill, As Posted on the Senate Budget Committee Website on June 27

Detailed Methodology
Changes to Spending
For SNAP and Medicaid, we use self-reported program receipt in the 2024 Current Population Survey Annual Social and Economic Supplement (ASEC) as the basis for our estimates. While the value of SNAP benefits received is reported in the ASEC, Medicaid spending is not; as such, we impute Medicaid spending for each individual in the ASEC reporting Medicaid receipt using CBO’s baseline projections of average Federal spending on benefit payments per enrollee.
After individuals’ SNAP and Medicaid benefits are computed, we group individuals within each household into tax units using the Census Bureau’s imputed tax-unit ID and sort them by Adjusted Gross Income (AGI) as imputed by Census.
We adjust reported SNAP and Medicaid benefit receipt to account for the well-known phenomenon of underreporting of in-kind benefits by households in the ASEC. To do so, we scale up each income group’s aggregate benefits received so that total benefits match CBO’s baseline projections. (This is equivalent to assuming that individuals who receive benefits but do not report them in the ASEC have the same distribution of income as individuals who receive benefits and do report them.)
Compared to previous versions of analysis of changes to SNAP and to Medicaid, the analysis in this report reflects two recent changes to The Budget Lab’s distributional methodology, both of which match those of the Congressional Budget Office (CBO) in its recent analysis of the distributional impact of the House version of the bill:
- In line with multiple economic studies, we assume that a little over half (56 percent) of changes to Medicaid ultimately fall on providers, with the remainder falling on enrollees.
- We assume that states will replace, on net, approximately 1 percent of household resource losses due to cuts to Federal spending on Medicaid and SNAP over the 2026-2034 window.
The scripts used to compute the estimates in this analysis can be found here.
Changes to Taxes
The effects of tax changes are estimated using The Budget Lab’s standard distribution analysis methodology with the exception that the income metric for ranking tax units is AGI, not a broader measure of income, due to data constraints in the ASEC.
Our analysis includes the following provisions: ordinary tax rates, the standard deduction, itemized deductions (including PTET SALT policy), personal exemptions, the QBI deduction, the CTC, the CDCTC, the AMT, no tax on tips/overtime/car loan interest, the senior deduction, the estate tax, bonus depreciation, and R&D expensing.
The script used to generate the figures in this analysis can be found here. For more information on our tax model, please refer to these two documentation pages: