
Standalone Distributional Effects of Major Tax Provisions in the Reconciliation Bill: Comparing House and Senate Versions
Key Takeaways
-
The House and Senate reconciliation bills differ across key tax provisions which affect the legislation’s distributional impact. We provide a provision-by-provision distributional analysis to highlight these differences.
-
The largest deficit-increasing tax changes in both versions make the tax code more regressive. The single largest is the extension of the Tax Cuts and Jobs Act’s expiring individual tax provisions: after-tax incomes would rise by 0.7 percent for the bottom quintile and 2 percent for the top quintile.
-
The largest difference between versions is the cap on state and local tax deductions, which is increased in the House (regressively delivering largest tax cuts to those earning about $400,000) but untouched in the Senate. If the Senate decides to increase the cap, the bill will become more regressive.
-
Most new tax provisions in each version of the bill, such as no tax on overtime and tips, the deduction for seniors, and the Child Tax Credit expansion, exclude both low-income and high-income households from tax relief.
The code used to produce the calculations in this report can be found here.
Introduction
On Monday, the Senate Finance Committee released legislative text for its section of the budget reconciliation bill. The Finance Committee’s section covers proposals related to taxes and to health care, some of which differ from corresponding provisions in the House-passed version of the bill, the One Big Beautiful Bill Act (OBBBA).
Reporting indicates that the House and the Senate are engaged in ongoing negotiations over key tax provisions of the bill. Some of these contested provisions, like the limitation on deductions for state and local taxes (SALT), have the potential to meaningfully shift the distributional impacts of the bill. In this context, understanding the distributional impact of specific provisions is important.
This report adds to Budget Lab’s prior distributional analyses of budget reconciliation proposals by focusing specifically on tax changes only. (This analysis does not consider the bills’ changes to spending; a full distribution analysis from the Budget Lab is forthcoming.)
We ask: what is the standalone distributional impact of each major tax provision, and how do these effects differ across the House and Senate versions of the bill?
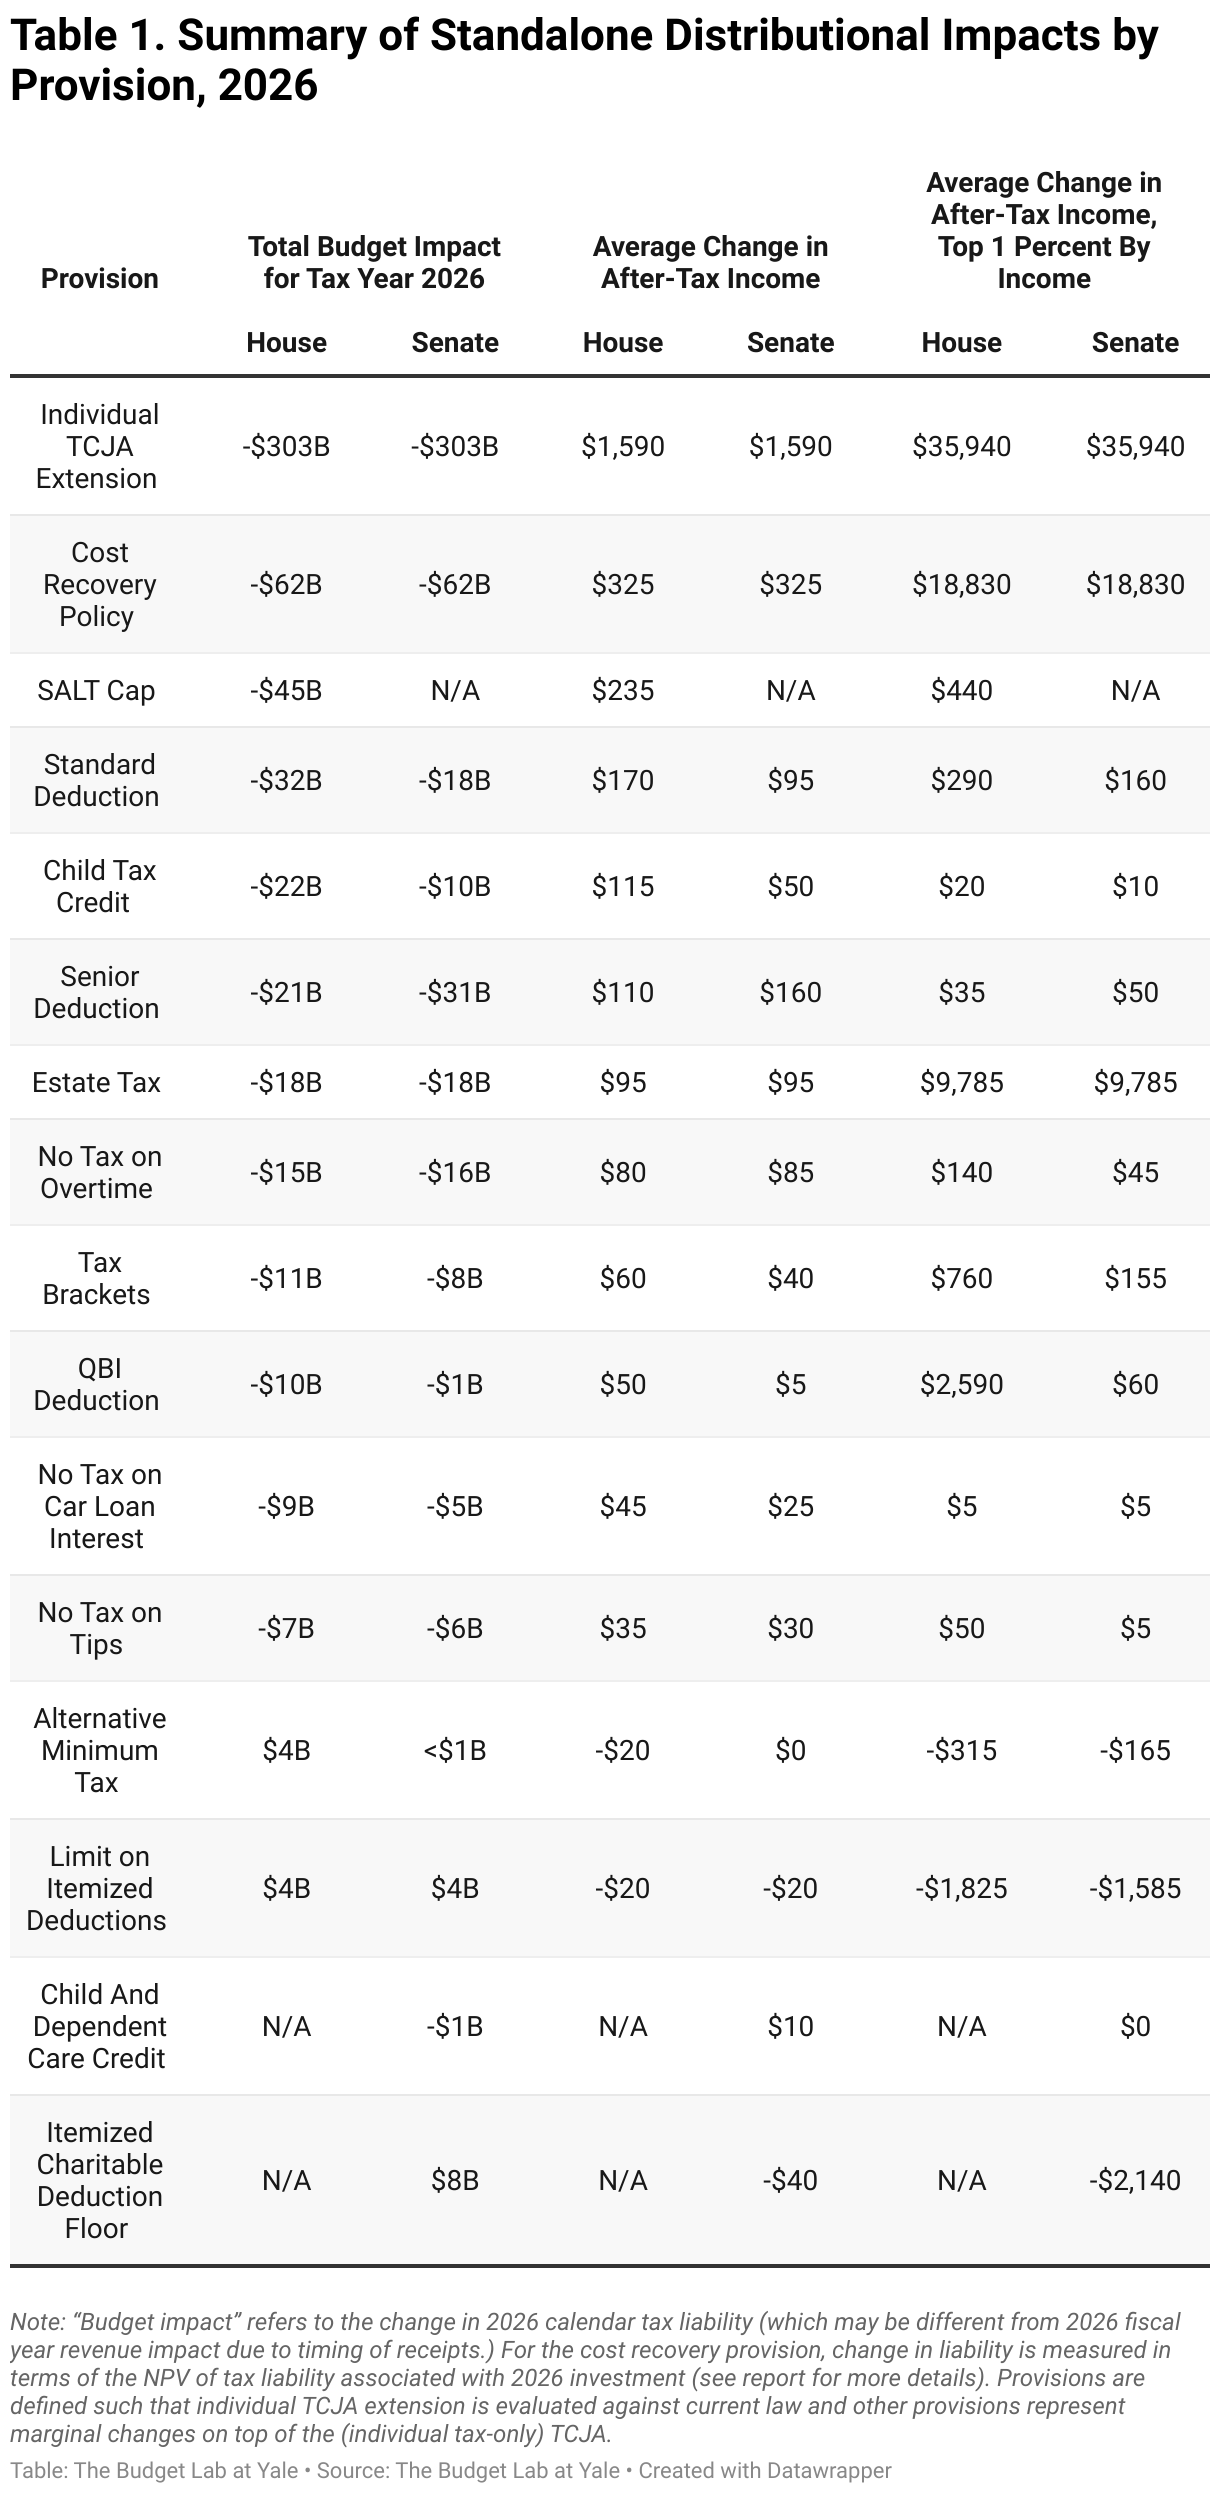
Table 1 summarizes our findings.
Estimated Distributional Impacts by Provision
This section analyzes each provision's distributional impact in 2026, the first full year of implementation.1 We first examine extending the Tax Cuts and Jobs Act's expiring individual income tax provisions. All subsequent provisions are measured against this TCJA extension baseline, with each analyzed independently (that is, without taking into account interactions with other provisions in these bills).2 This way, we can understand how these reconciliation bills provide additional tax changes above and beyond the TCJA’s effects.
The provisions considered in this report, listed from largest to smallest average impact in the House bill, are a subset of the full list of the bill’s tax provisions. Inclusion in our exercise is determined by budgetary impact and our ability to accurately measure the effect on households’ after-tax income. Refer to the Bipartisan Policy Center’s tax bill summaries (House, Senate) for a comprehensive list of changes and additional details for each provision.
To learn more about how we calculate the numbers below, refer to our distribution analysis documentation.
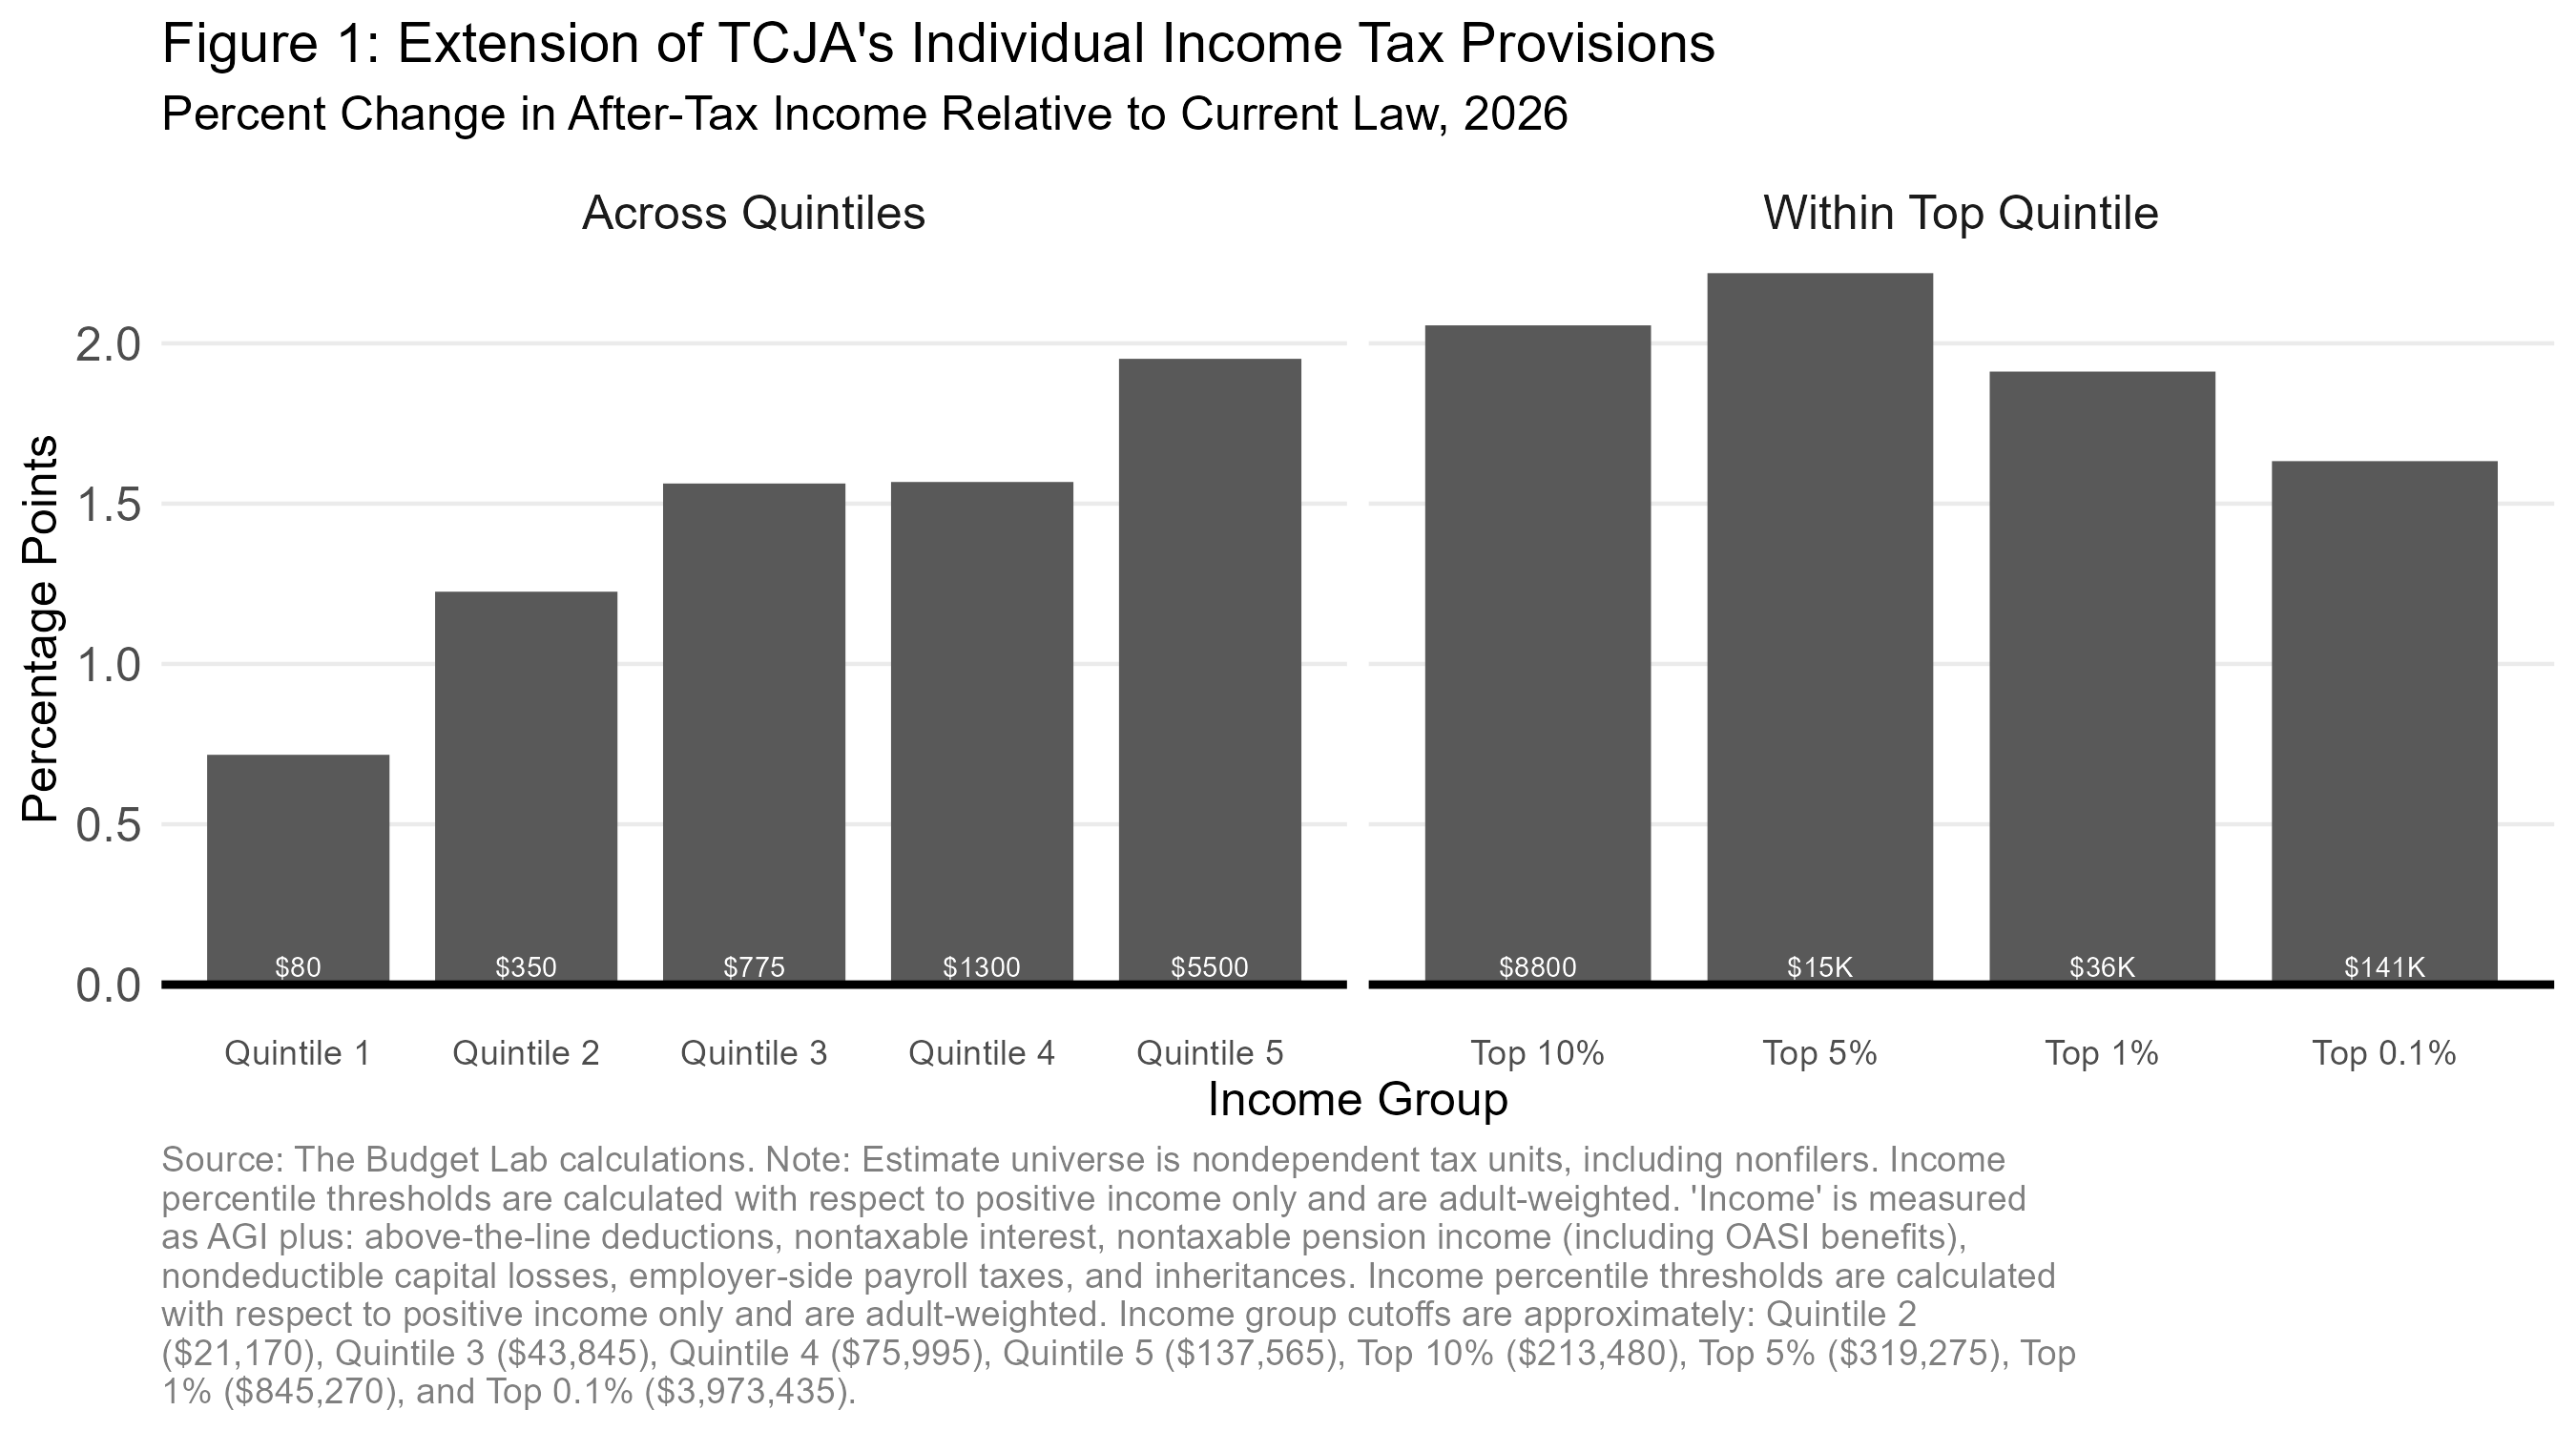
Extension of the TCJA’s Expiring Individual Income Tax Provisions
Average change in after-tax income relative to current law: $1,590
Both the House and Senate bills would generally extend the expiring individual income tax provisions of the Tax Cuts and Jobs Act (TCJA). These provisions include:
- lower rates;
- a higher standard deduction;
- the elimination of personal exemptions;
- a larger Child Tax Credit (CTC);
- limits on itemized deductions, including the $10,000 SALT deduction cap;
- the establishment of a 20% deduction for certain pass-through income; and
- a higher Alternative Minimum Tax (AMT) exemption.
Detailed information about these provisions, and analysis of their effects on the Federal budget and the distribution of income, can be found in this Budget Lab report.
The TCJA’s individual tax provisions are a mix of regressive and progressive provisions. Some provisions raise taxes and others lower taxes. On net, the effect would be to generate regressive tax cuts. As a share of income, average tax cuts rise across quintiles, though this pattern attenuates somewhat within the top quintile. (Note that this section does not account for corporate tax or estate tax changes, which are considered separately below.)
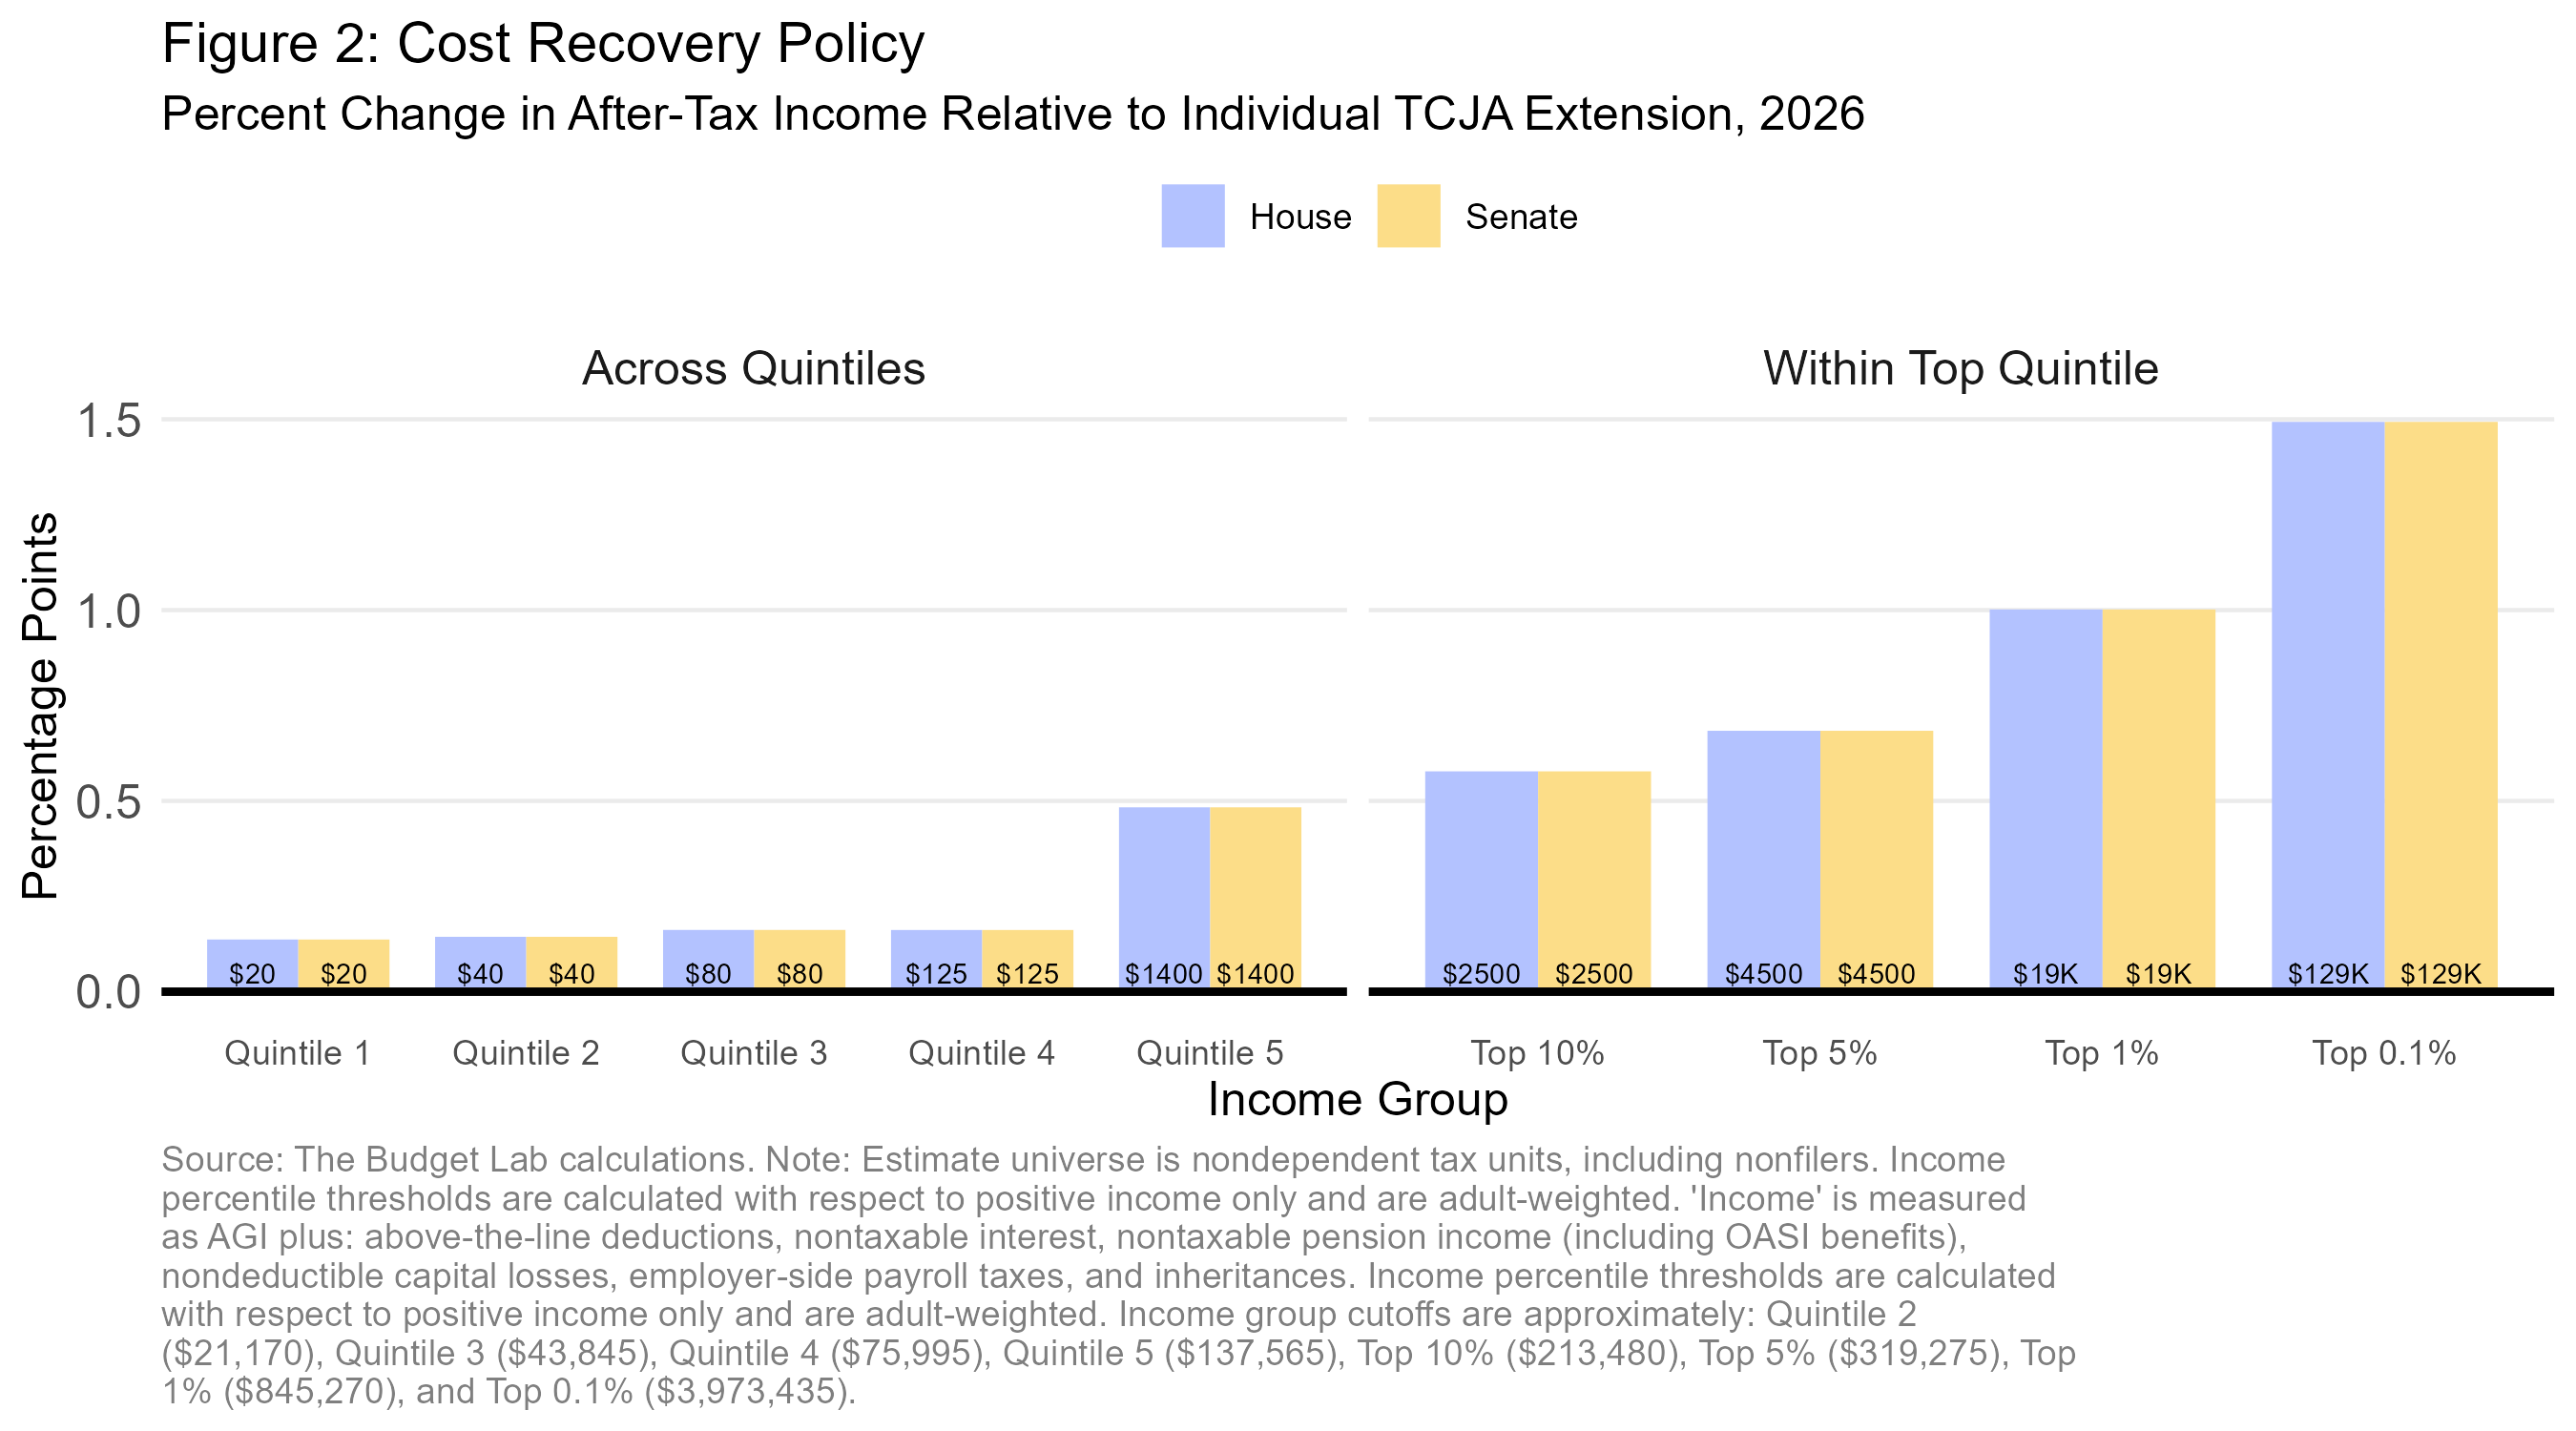
Cost Recovery Policy
Average change in after-tax income, House version: $325
Average change in after-tax income, Senate version: $325

A policy change that moves from depreciation or amortization to expensing reduces the tax burden on new business investments. The tax burden is lower because inflation and the time value of money do not erode the value of deductions for investment costs when they can be used immediately rather than in the future. Therefore, the change in aggregate tax burden can be measured as the change in the net present value of taxes on new investments undertaken in a given year.3 This aggregate reduction in business taxes accrues to households in the form of higher after-tax investment returns and, in the longer run, higher wages.4 Investment income makes up a much larger share of income for high-income households. Therefore, even if (as we assume) half of the aggregate tax relief accrues to workers rather than owners of capital, this policy change would be regressive.
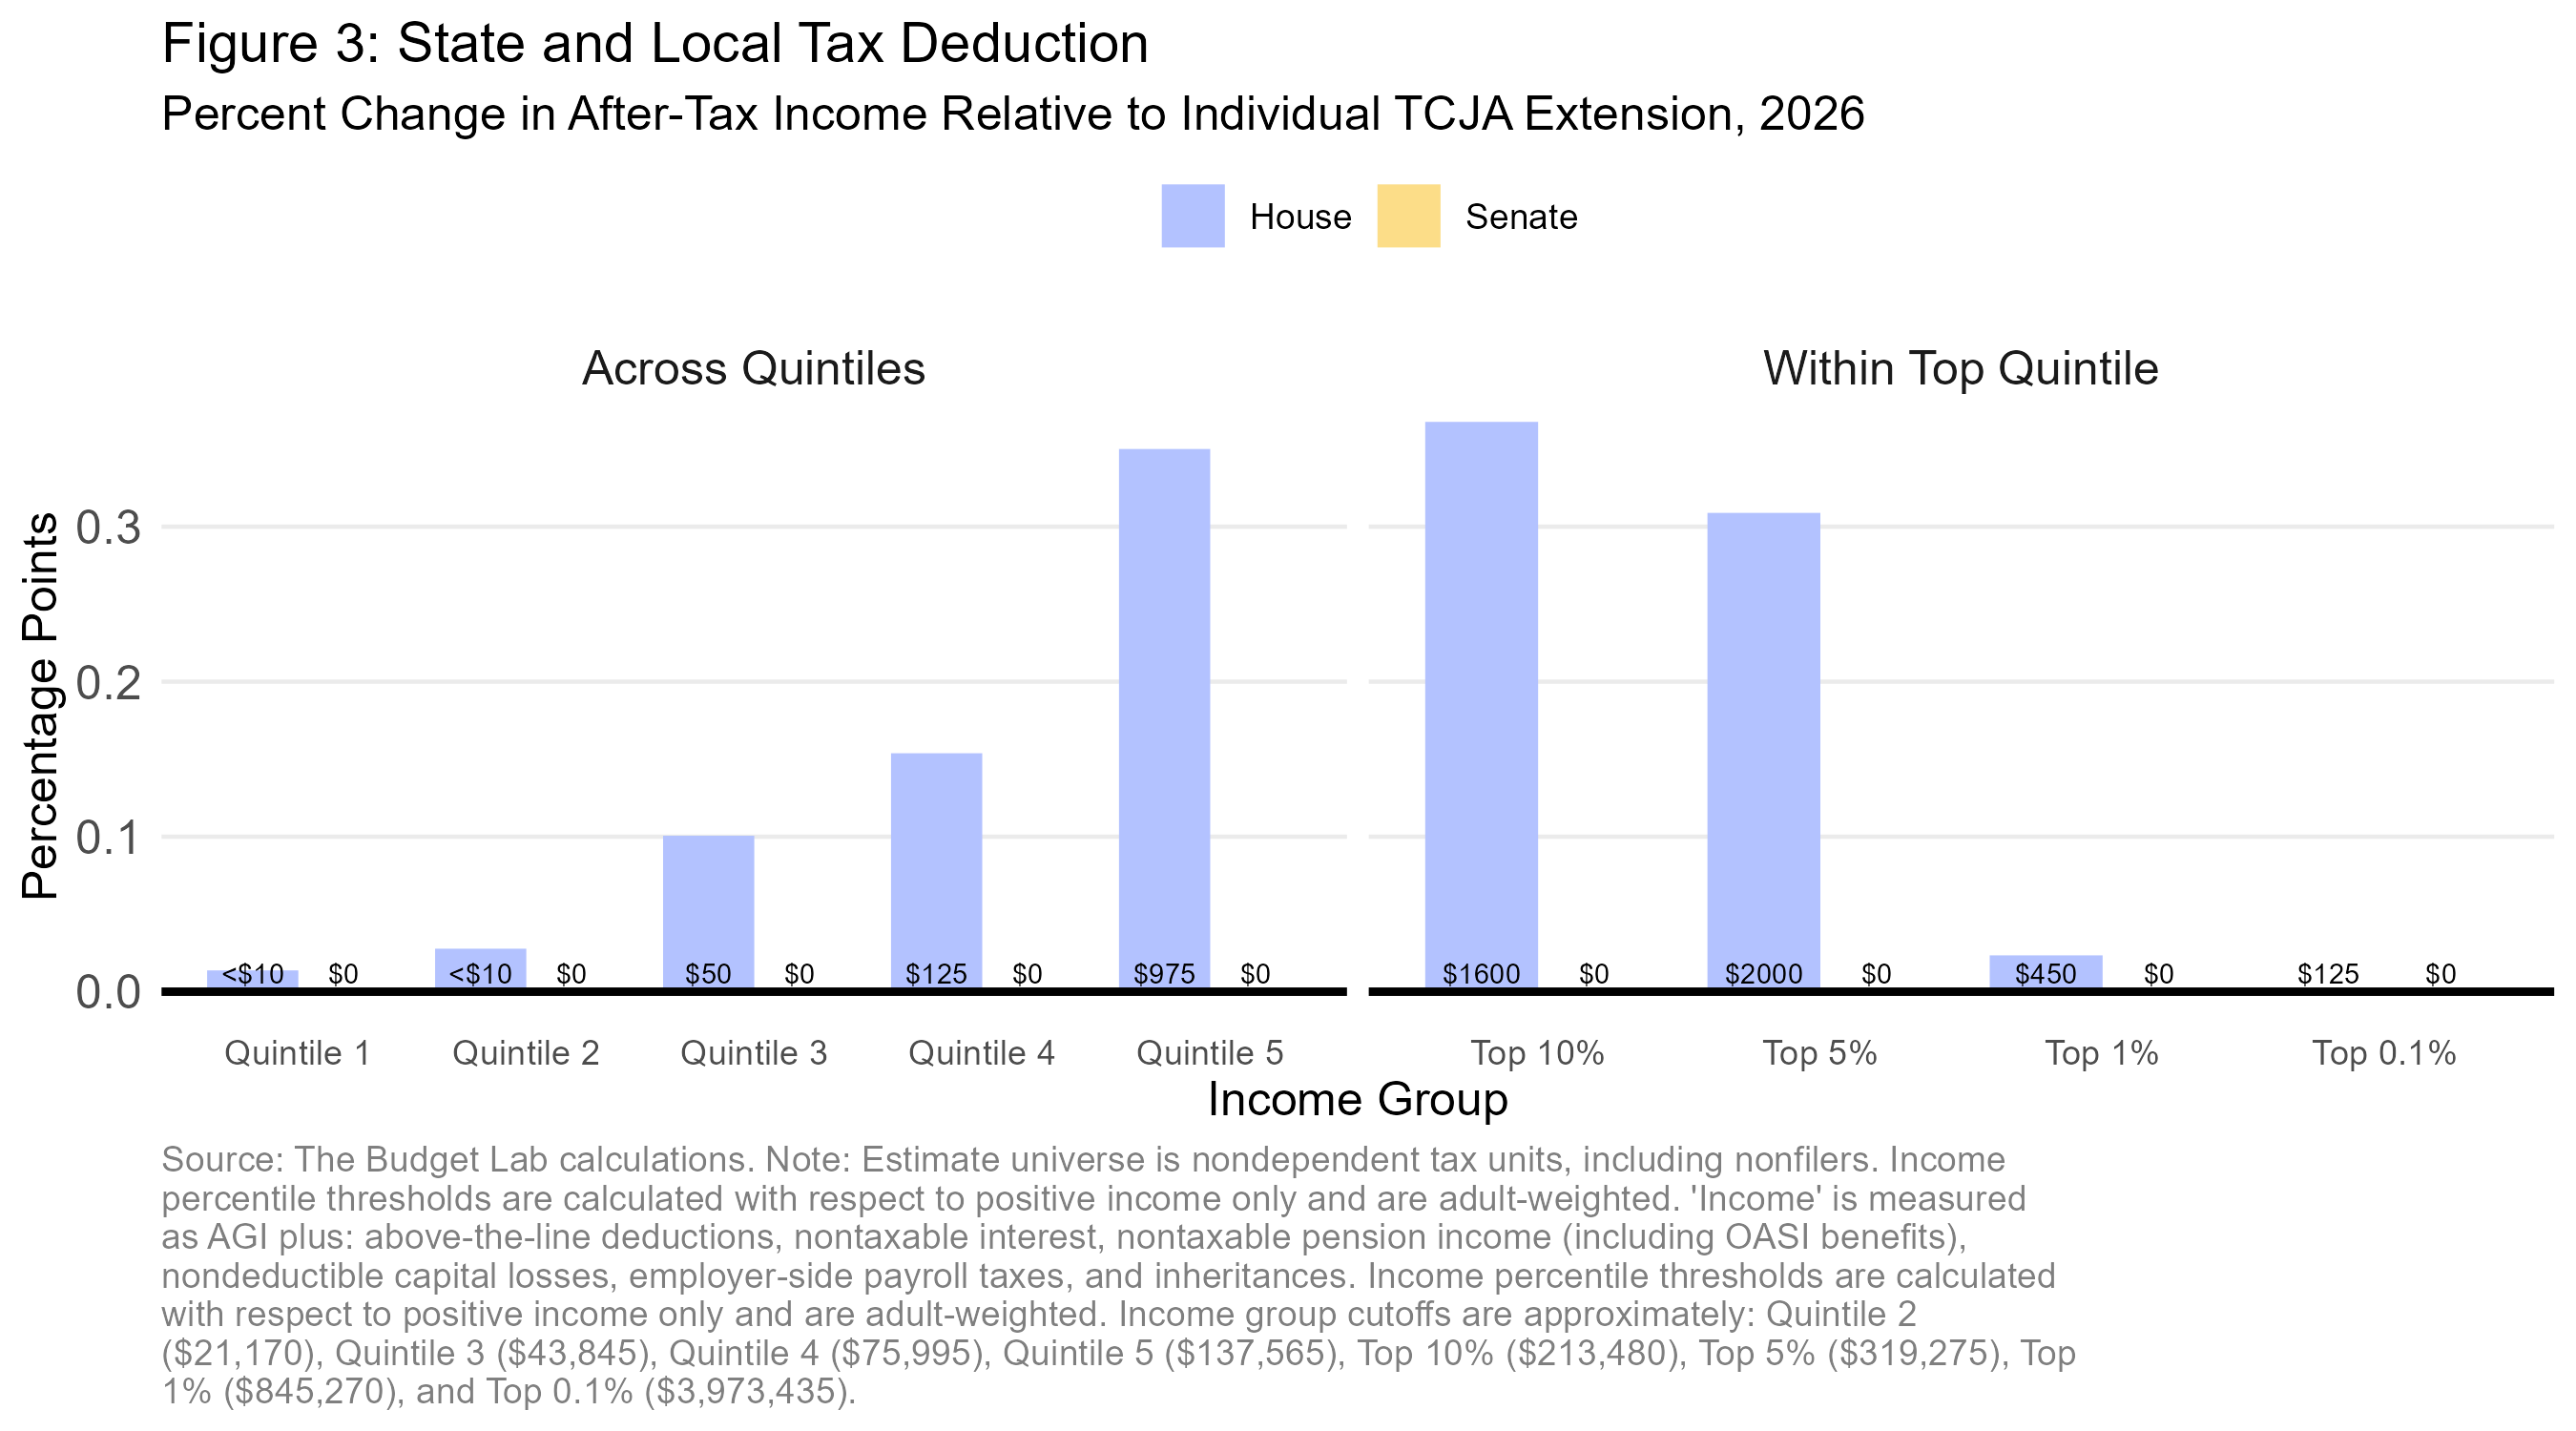
State and Local Tax Deduction
Average change in after-tax income, House version: $235
Average change in after-tax income, Senate version: N/A

The House’s SALT cap proposal would be generally regressive: relative to a straightforward TCJA extension, after-tax incomes would rise by more than 0.3 percent for the top quintile but almost 0 percent for the bottom quintile. However, the phase-down back to $10,000 limits benefits for households at the very top. Therefore, benefits are largest for those in the 90th-99th percentile range.
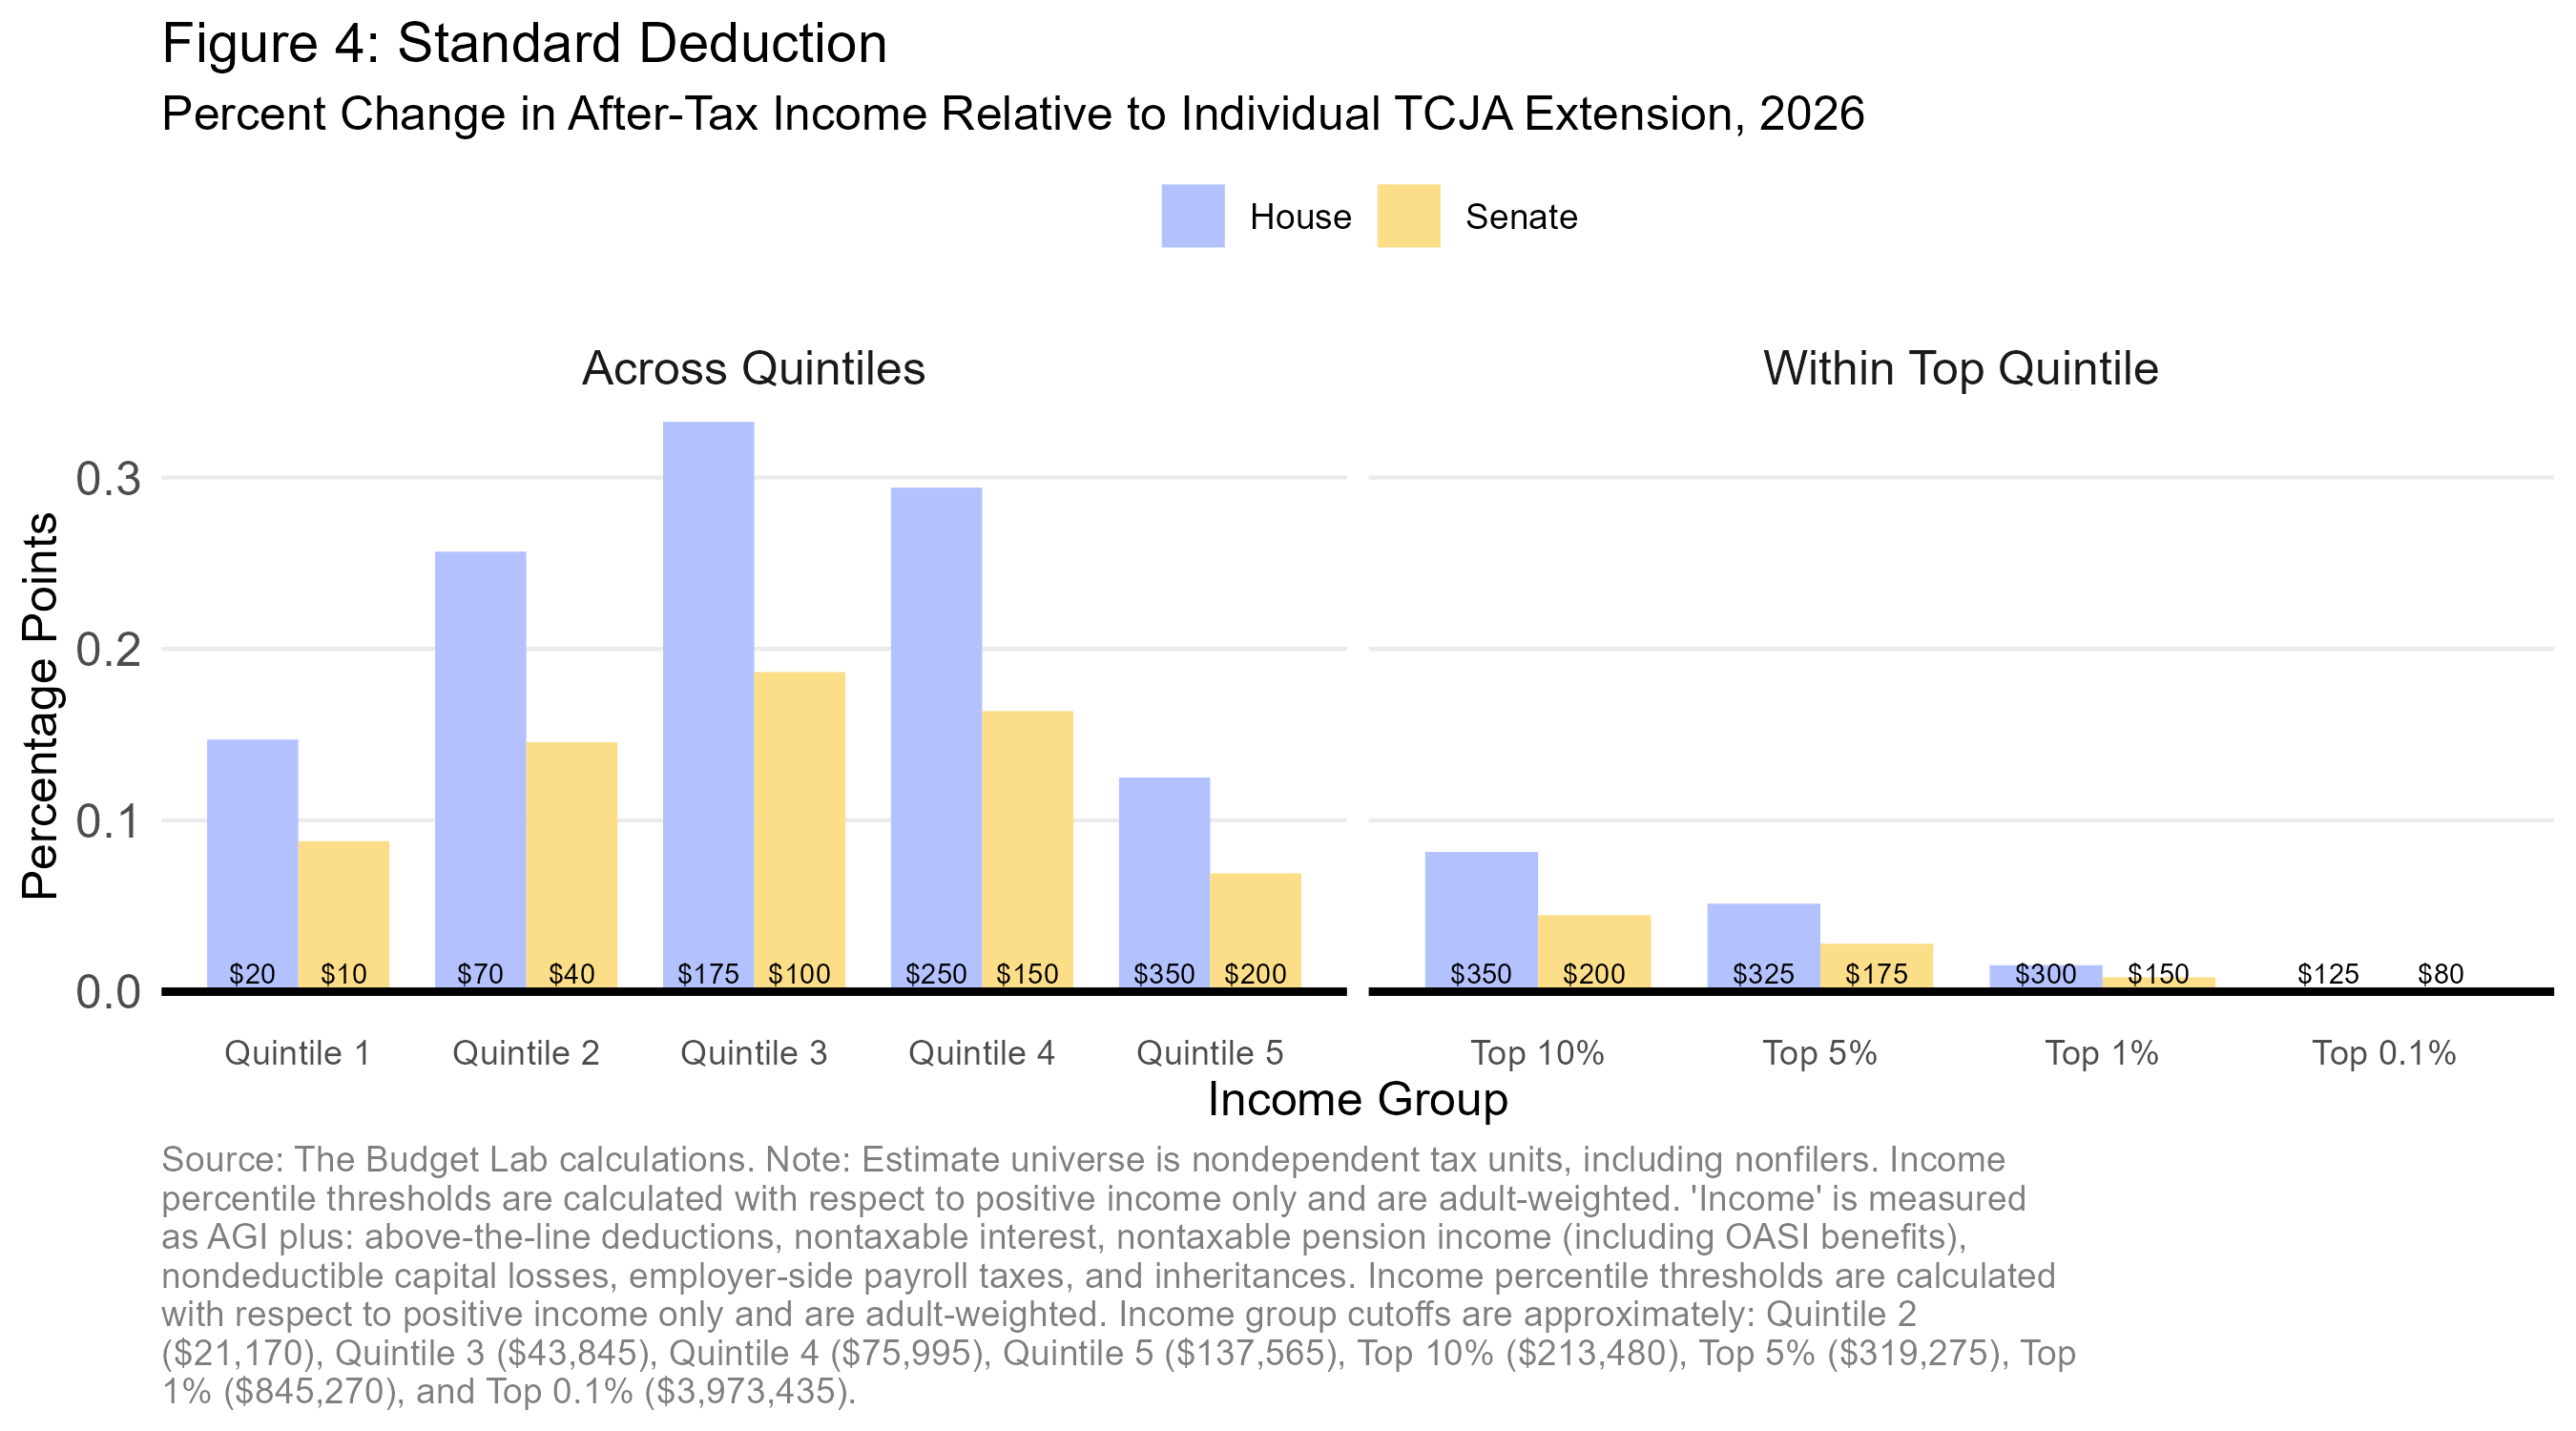
Standard Deduction
Average change in after-tax income, House version: $170
Average change in after-tax income, Senate version: $95

The House version would be almost twice as generous as the Senate version due to the additional year of inflation indexing. The hump-shaped distributional pattern in each version reflects the net effect of two competing factors. On one hand, higher-income households benefit more from deductions due to the progressive tax rate system. On the other hand, higher-income households are more likely to itemize and thus, see no benefit from a higher standard deduction. These factors combine to create a “sweet spot” in the middle of the income distribution—the group that benefits most.
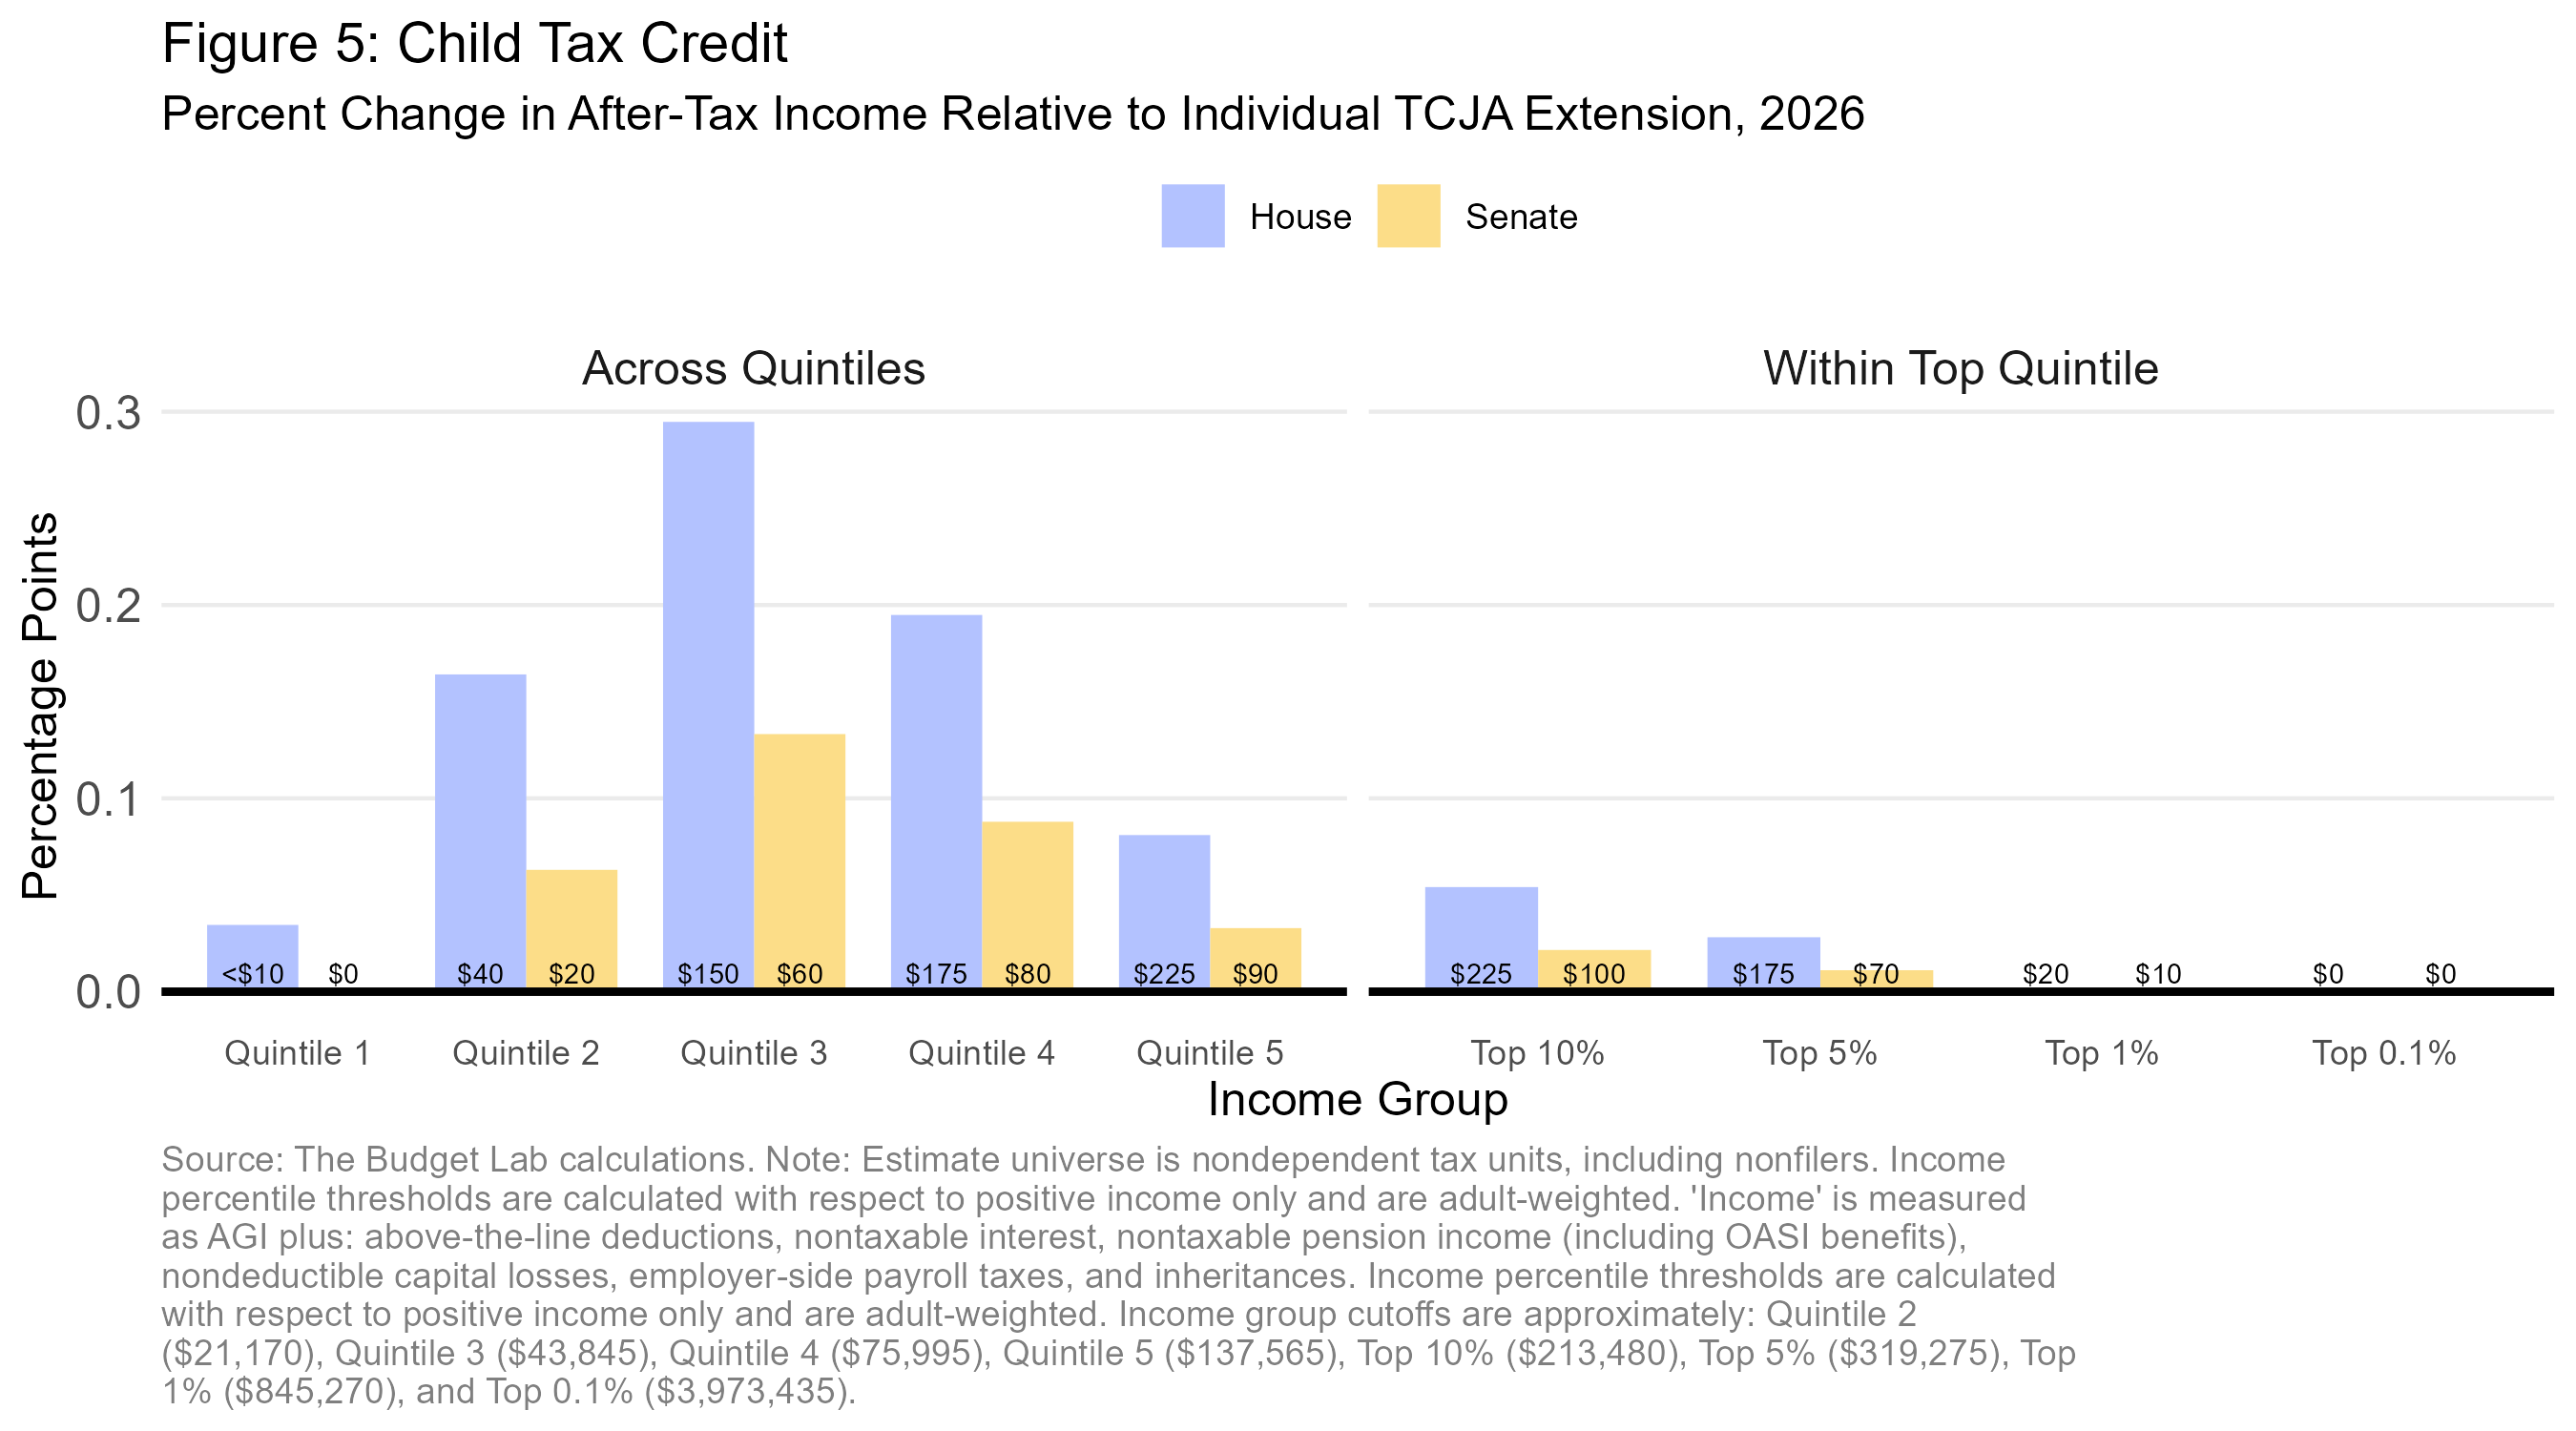
Child Tax Credit
Average change in after-tax income, House version: $115
Average change in after-tax income, Senate version: $50

The House version of CTC expansion would be more generous than the Senate version in 2026. (This is, however, not true for years after 2028.) Middle-income families benefit most from this policy change, while low-income families generally do not benefit from a higher credit value due to the earnings phase-in and lack of full refundability. For higher-income families, the flat-dollar CTC represents a smaller share of income, and at a high-enough income level the CTC phases out.
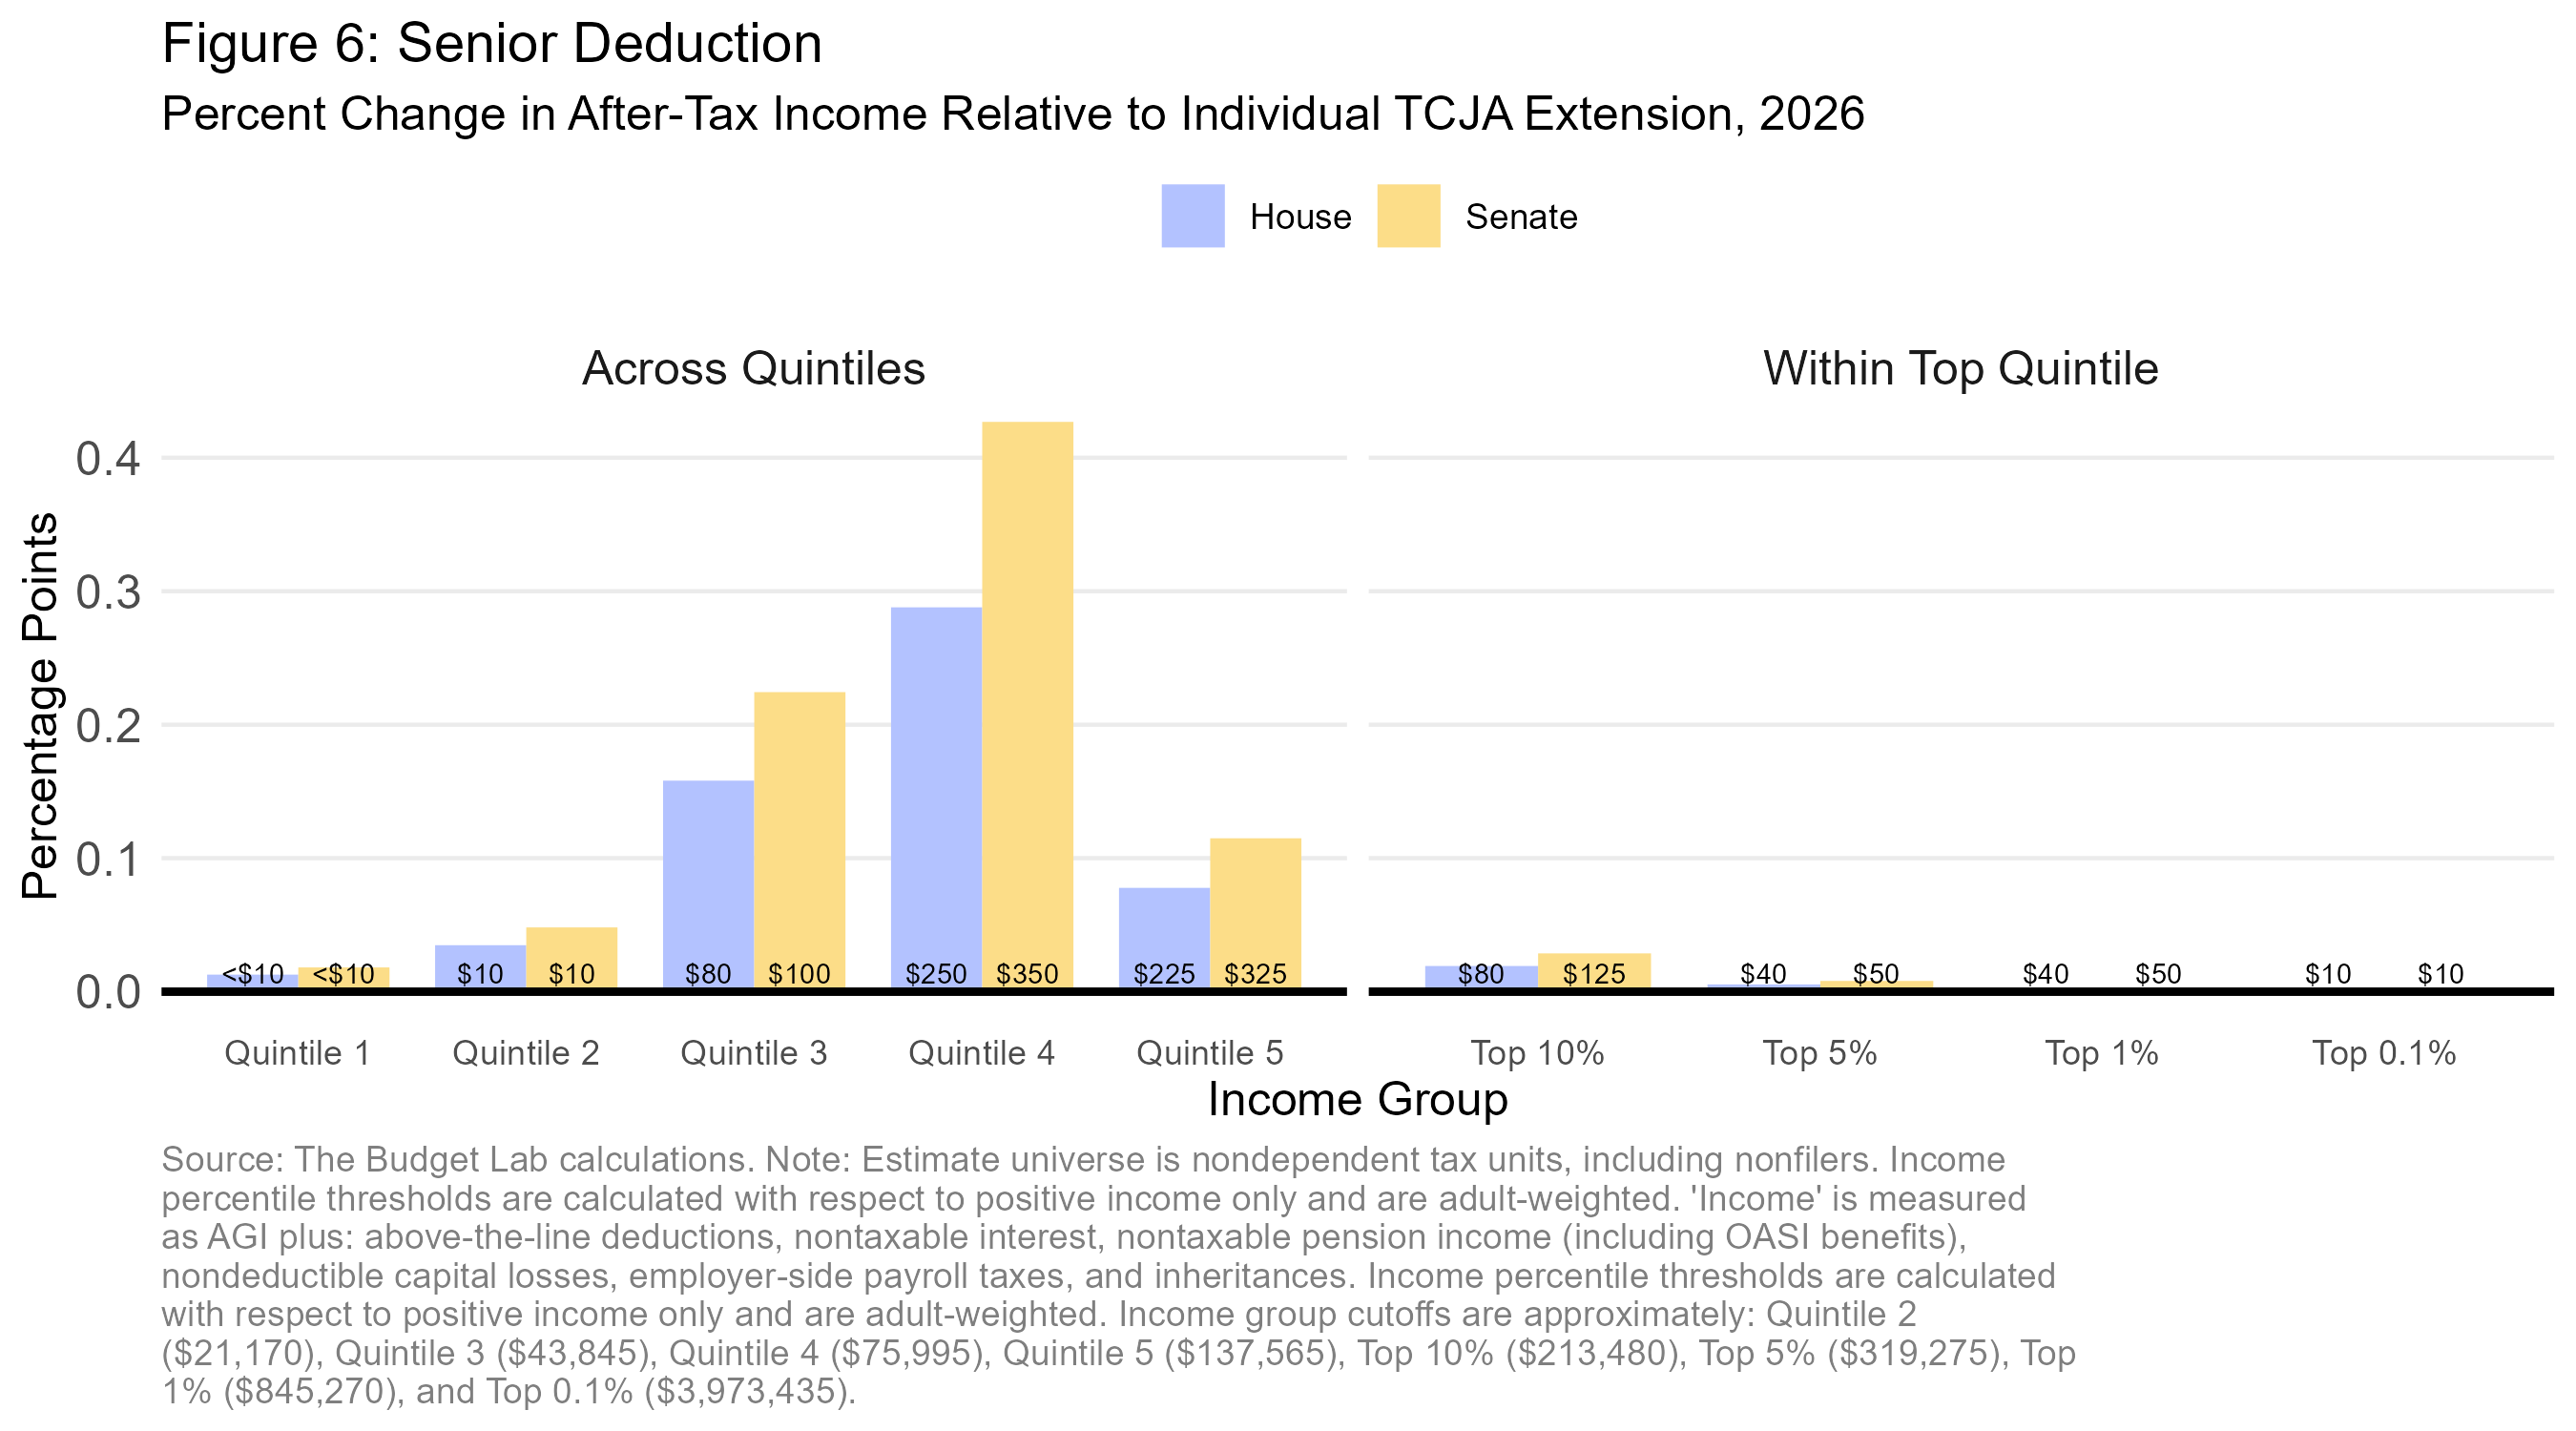
Senior Deduction
Average change in after-tax income, House version: $110
Average change in after-tax income, Senate version: $160

Average tax cuts are larger under the Senate proposal due to the larger deduction value. The distributional impact, where benefits grow with income before peaking in the fourth quintile then falling again, is the net outcome of two competing factors. First, a new deduction is less valuable to lower-income seniors who either lack any taxable income to offset or face low marginal tax rates, so the impact is negligible for those at the bottom end of the distribution. Second, a fixed-dollar deduction represents a smaller fraction of income as income grows, and the deduction phases out above a threshold, so impacts are muted at higher income levels.
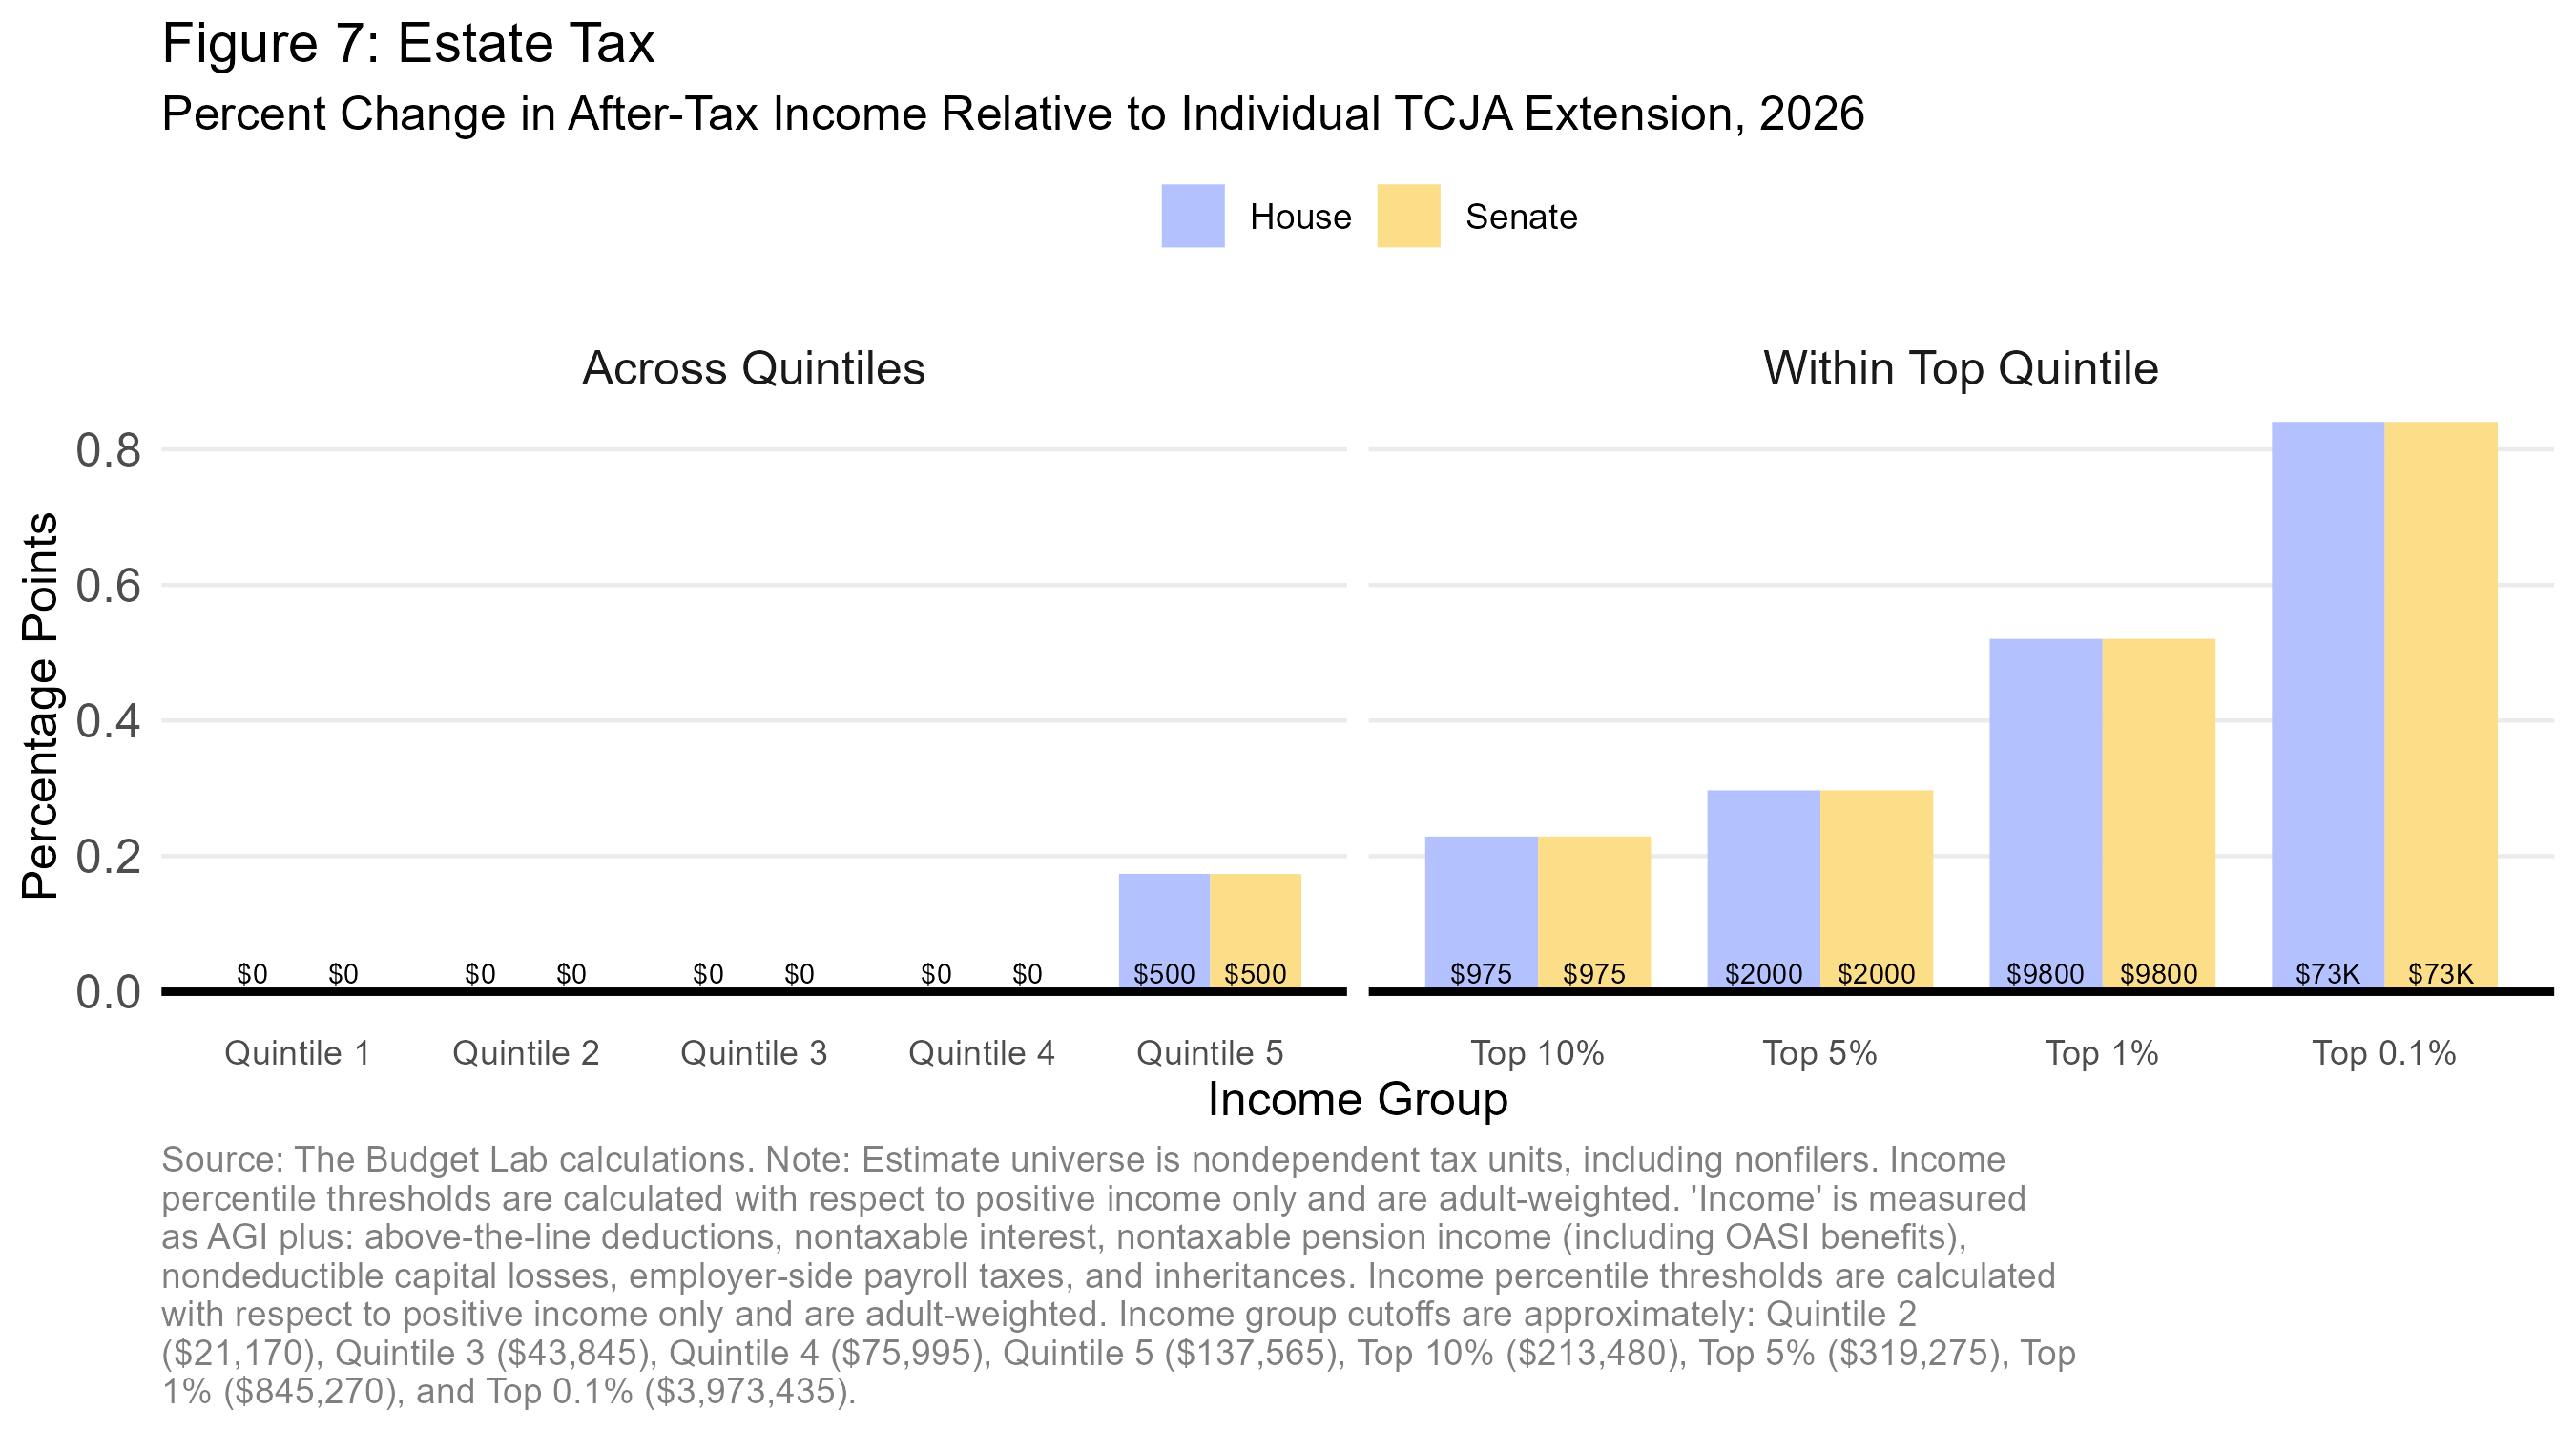
Estate Tax
Average change in after-tax income, House version: $95
Average change in after-tax income, Senate version: $95

Inheritance income is included in the definition of income used to rank households in these tables. Cutting the estate tax only benefits heirs whose inheritances come from large estates, from which they likely inherit millions of dollars. Therefore, high-income households are more likely to benefit from a reduction in estate taxes. The result is a steeply regressive tax cut.
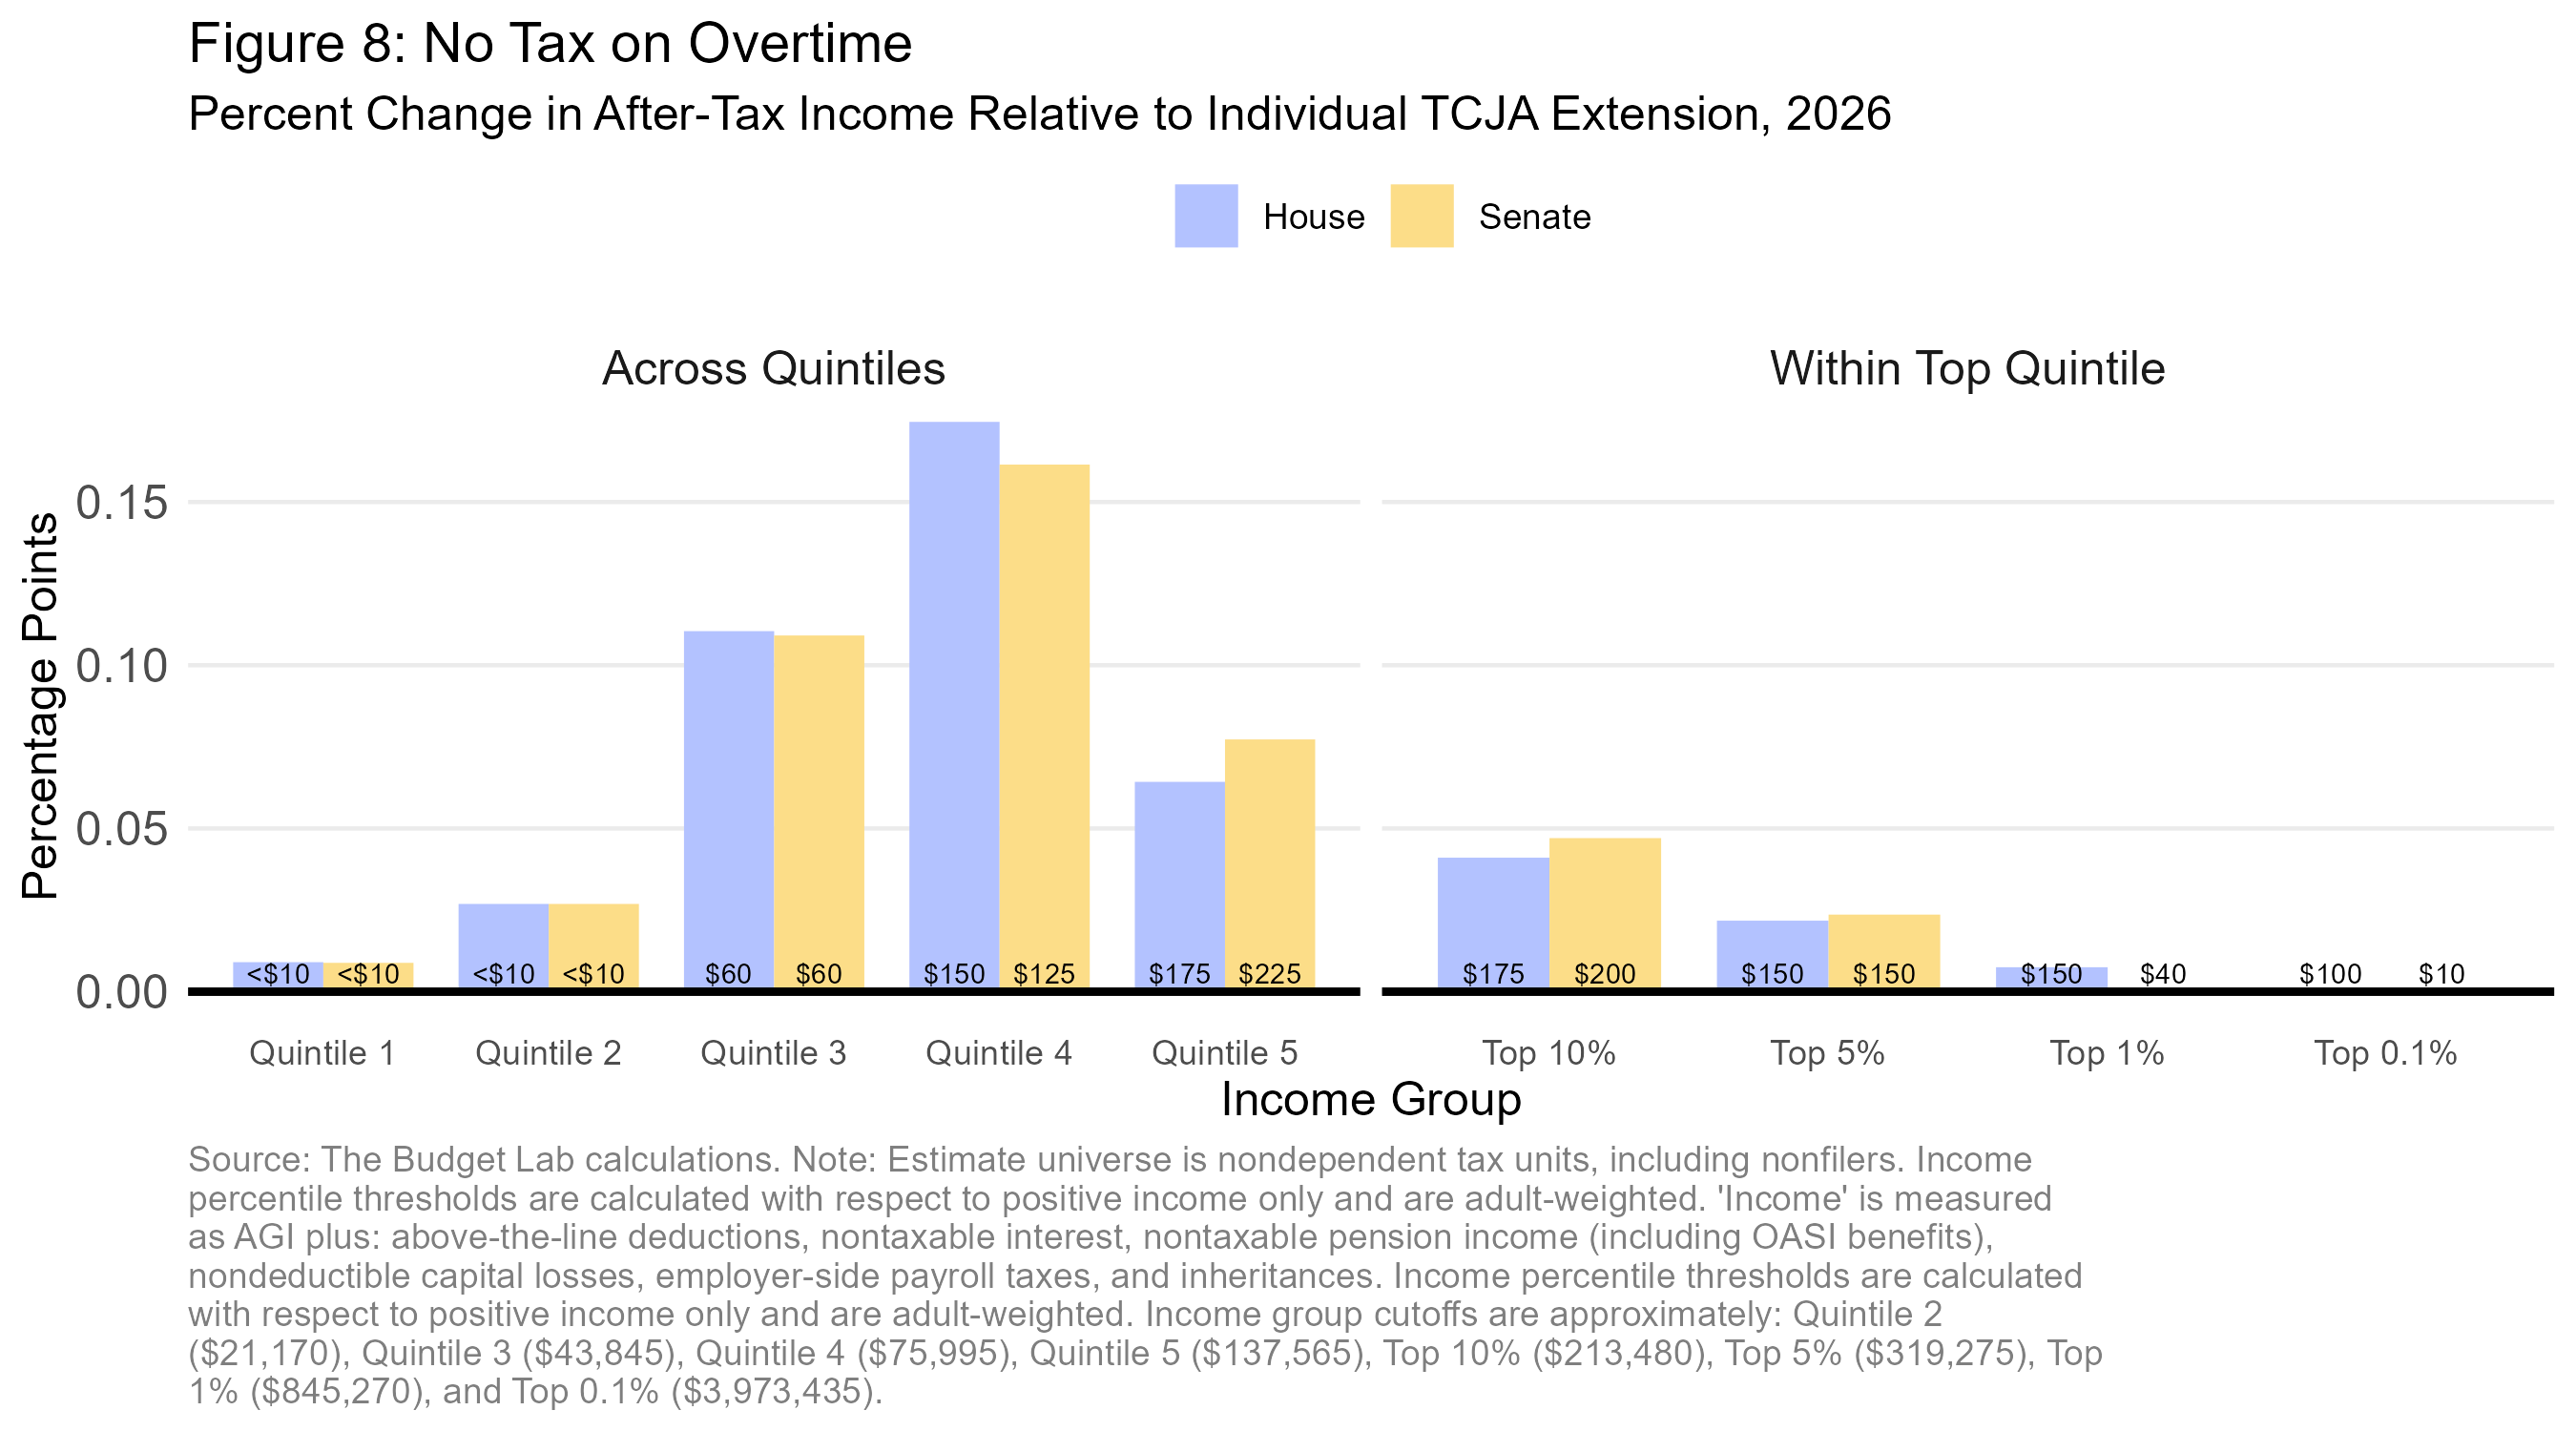
No Tax on Overtime
Average change in after-tax income, House version: $80
Average change in after-tax income, Senate version: $85

As a share of after-tax income, benefits are largest for middle- and upper-middle households. Households at the bottom end of the income distribution are characterized by low market incomes, so they generally don’t earn overtime pay. And even if they do earn overtime, a new deduction provides minimal tax benefits because these filers have low taxable incomes and face low marginal tax rates. High-income households generally don’t qualify due to income-based limitations (the net distributional effects of swapping the House’s “highly compensated employee” wage-based limitation for the Senate's AGI phaseout limitation are minimal). The result is a hump-shaped distribution.
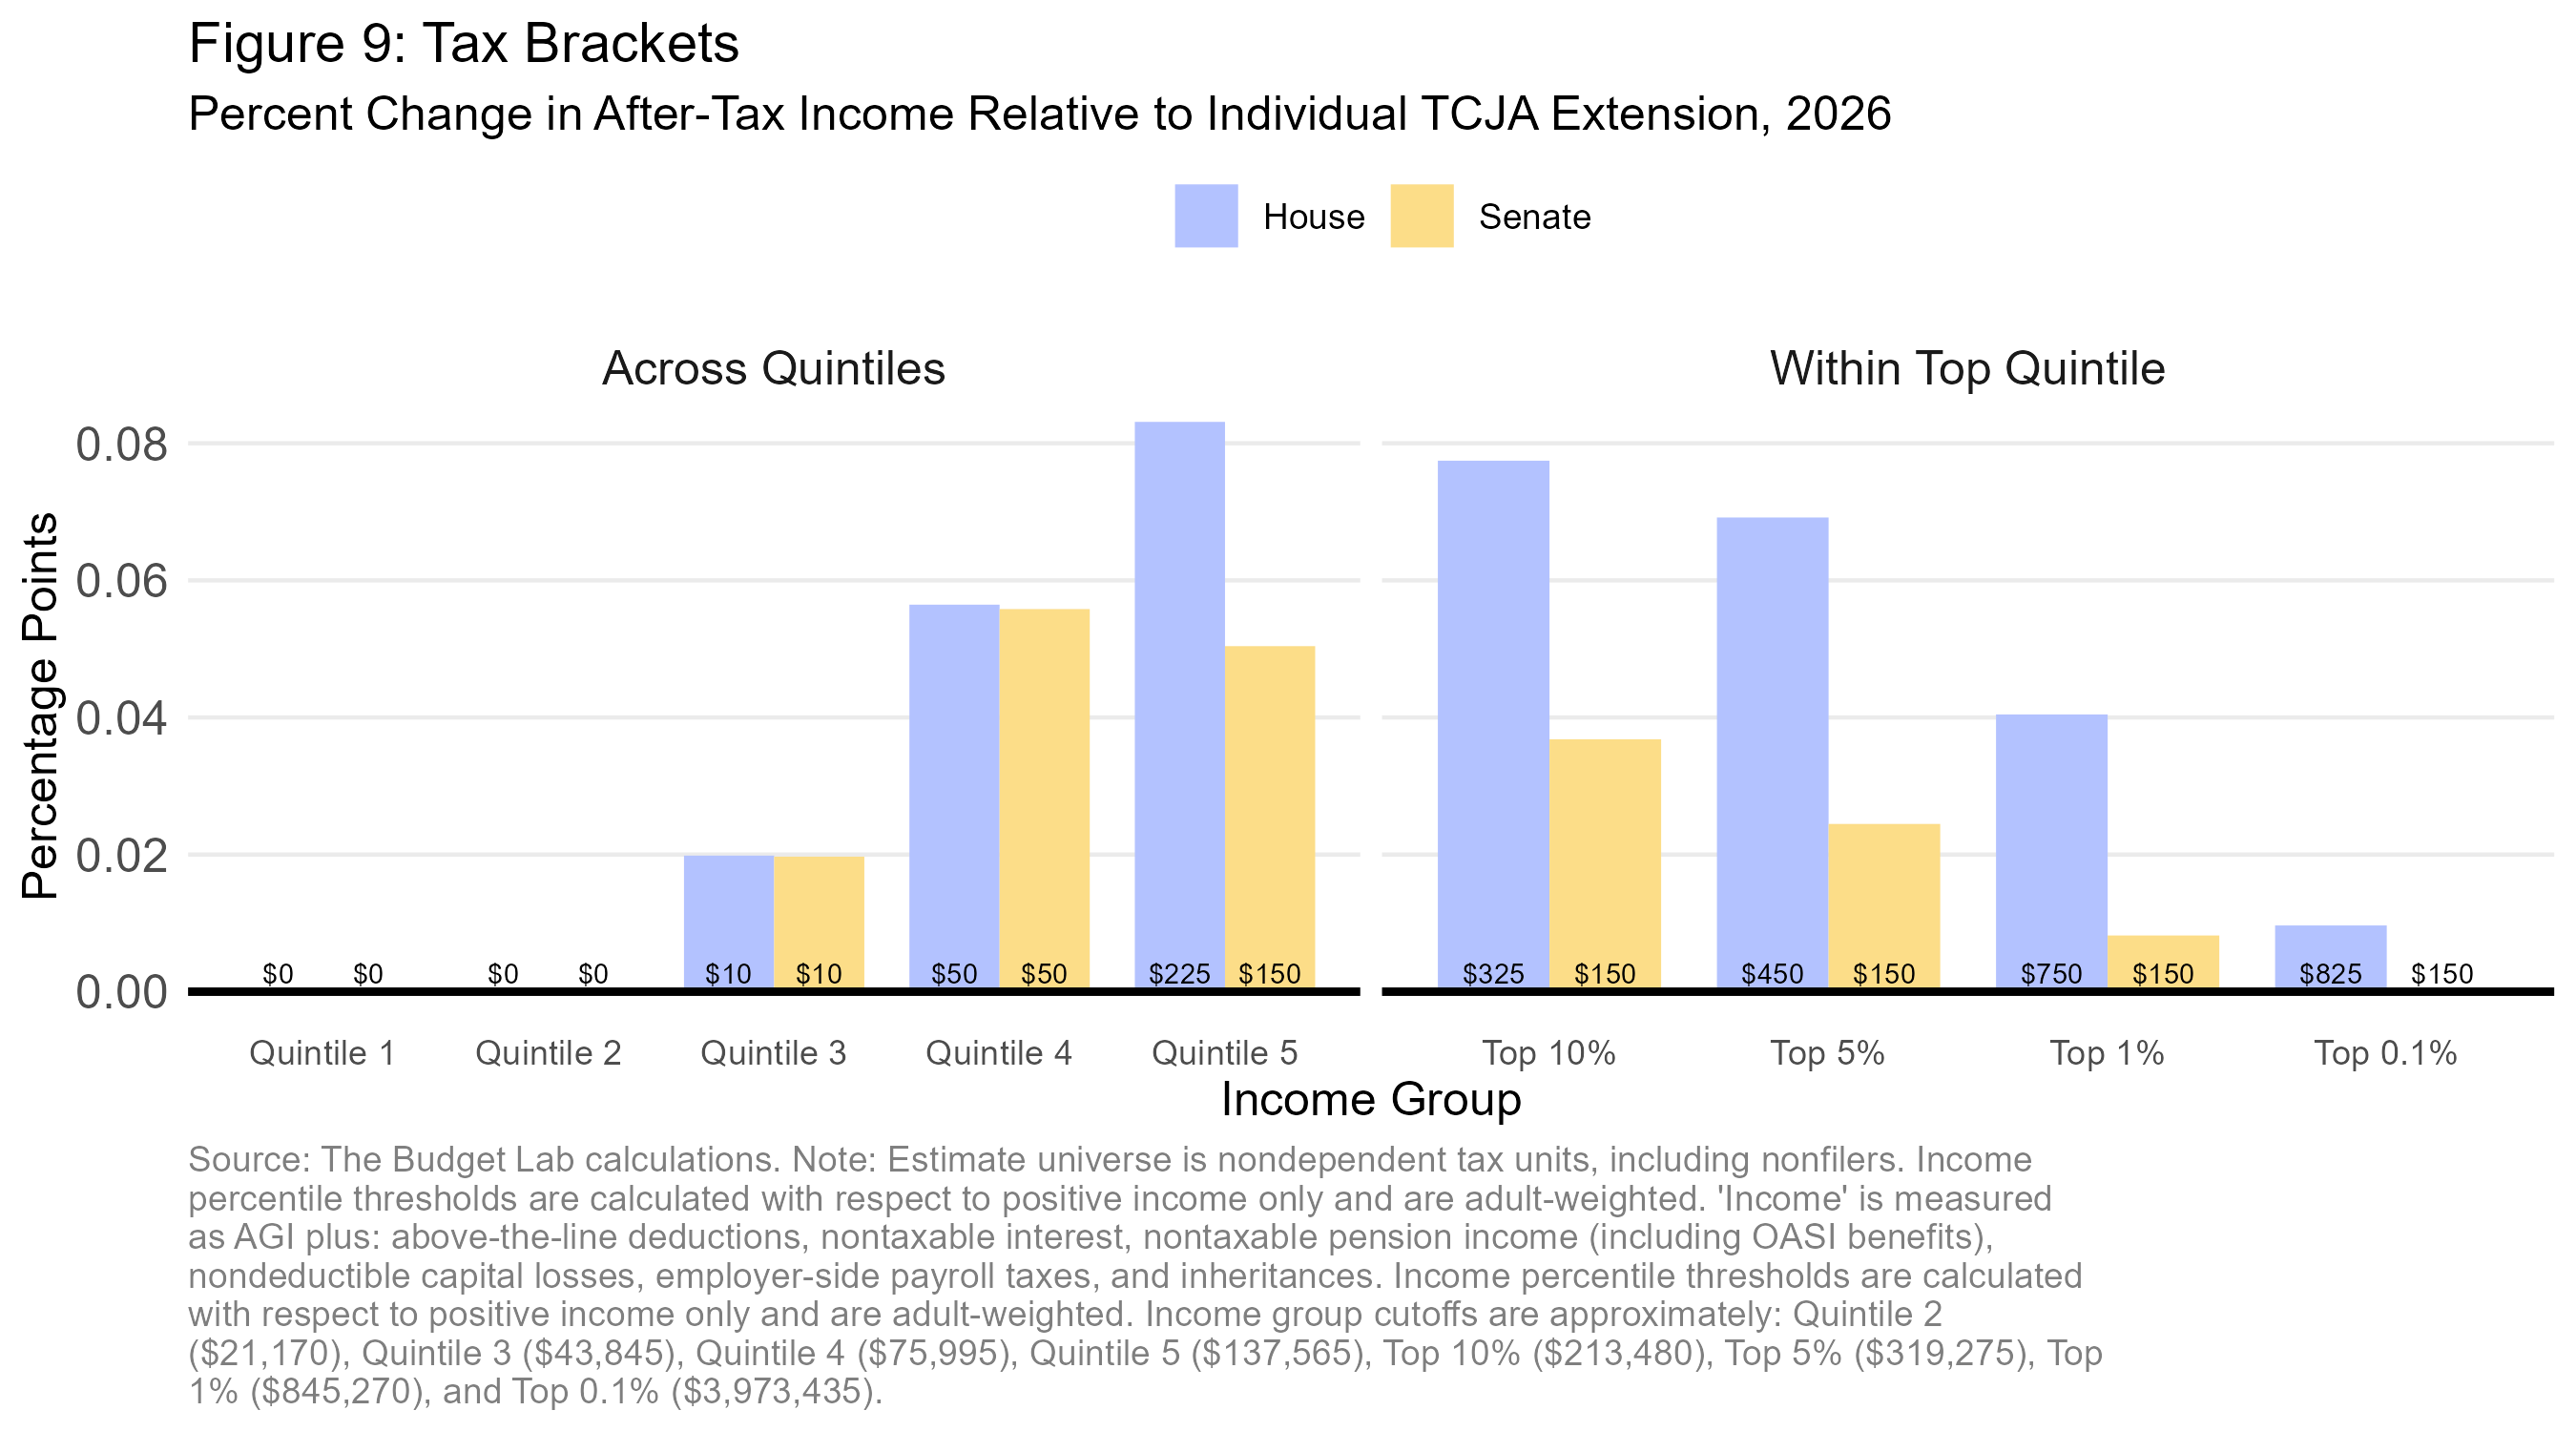
Tax Brackets
Average change in after-tax income, House version: $60
Average change in after-tax income, Senate version: $40

Lower-income households often have no taxable income and/or tax liability and thus do not benefit from higher tax brackets. In dollar terms, tax savings grow until income reaches the level of the highest bracket affected by the indexing; after that point, tax savings are fixed. This dynamic creates a scenario where, as a share of after-tax income, the benefits of this provision rise with income then fall (because the fixed dollar-amount tax cut represents a smaller fraction of income). The House version, which increases six brackets rather than three, is more generous for upper-income households, though this effect fades for those at the very top.
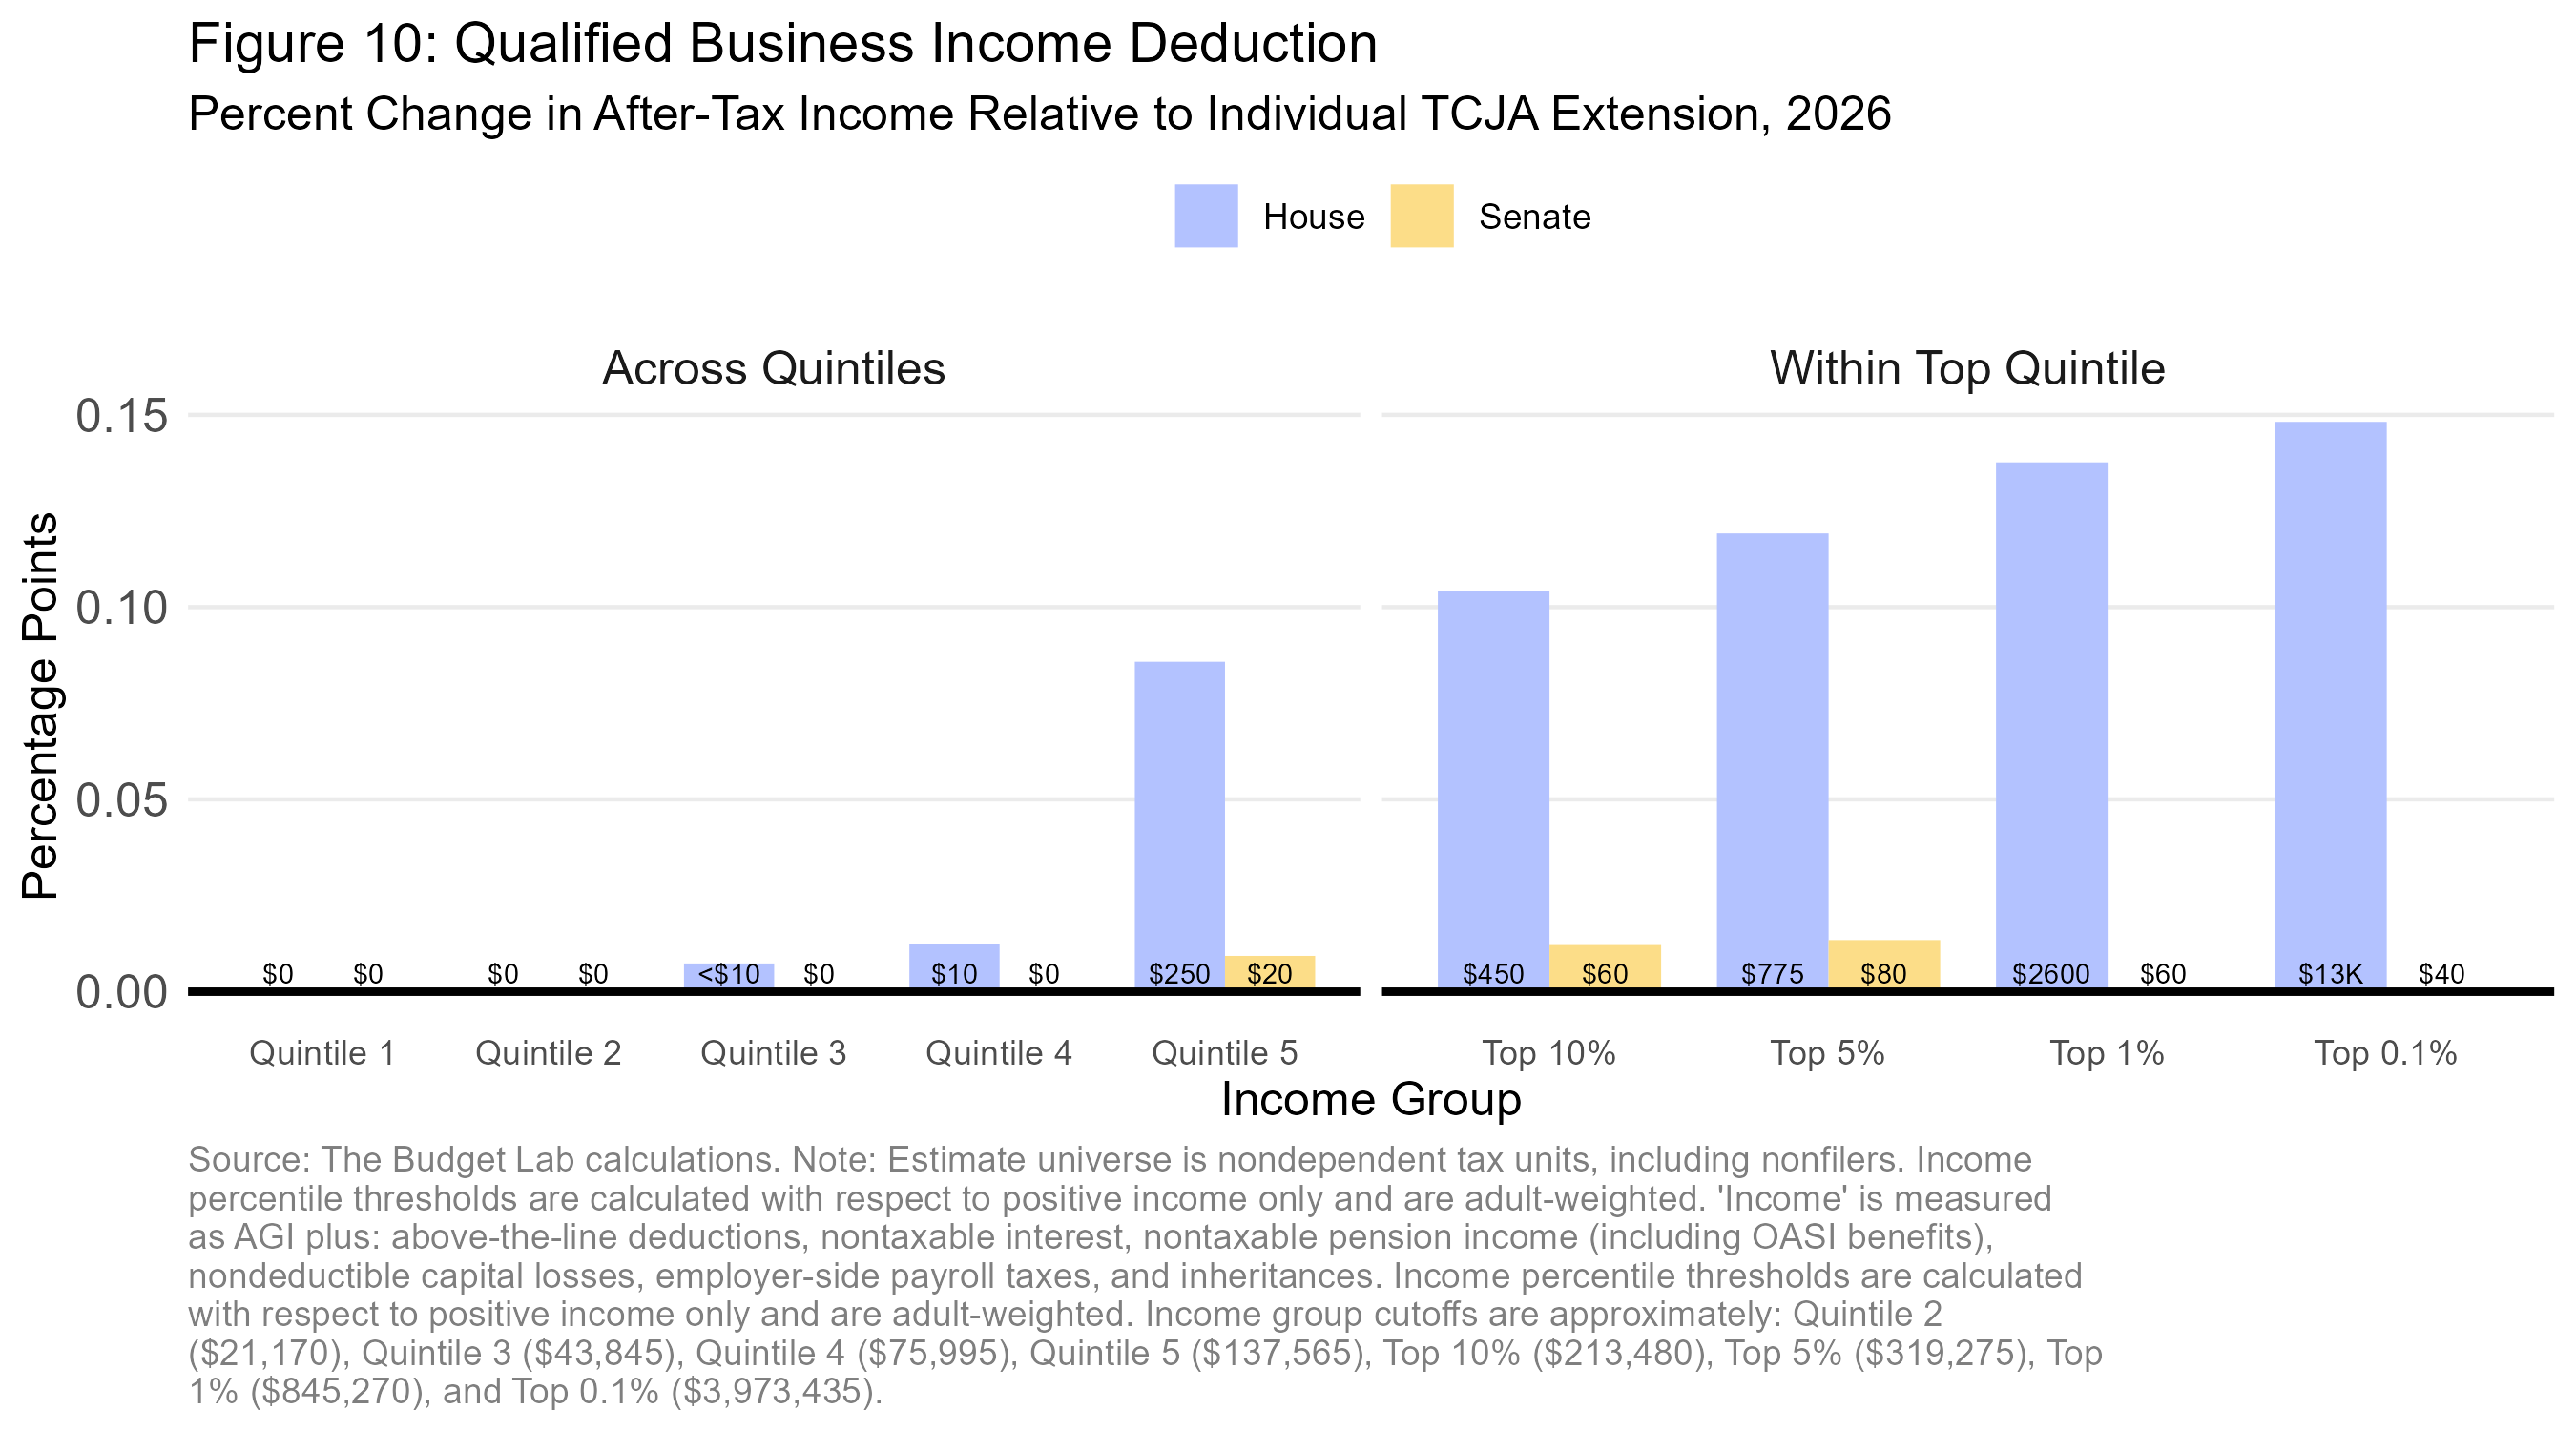
Qualified Business Income Distribution
Average change in after-tax income, House version: $50
Average change in after-tax income, Senate version: $5

High-income households are disproportionately likely to earn income through pass-through business, and the tax benefit of a deduction rises with income due to progressive tax rates. A straightforward expansion of the QBI deduction, then, is regressive. This is true even within the top quintile, where the benefits of the House plan continue to grow with income.
The Senate version would not increase the deduction rate and thus would not deliver large tax cuts to the top of the income distribution. It modestly expands the phaseout range, a change designed to reduce marginal tax rates for some households earning pass-through income in professional or service activities, but this does little to reduce average tax rates. The $400 minimum deduction creates nonzero tax savings for some in the top quintile—professional services pass-through owners who are phased out under current policy—but these tax savings are negligible as a share of after-tax income.
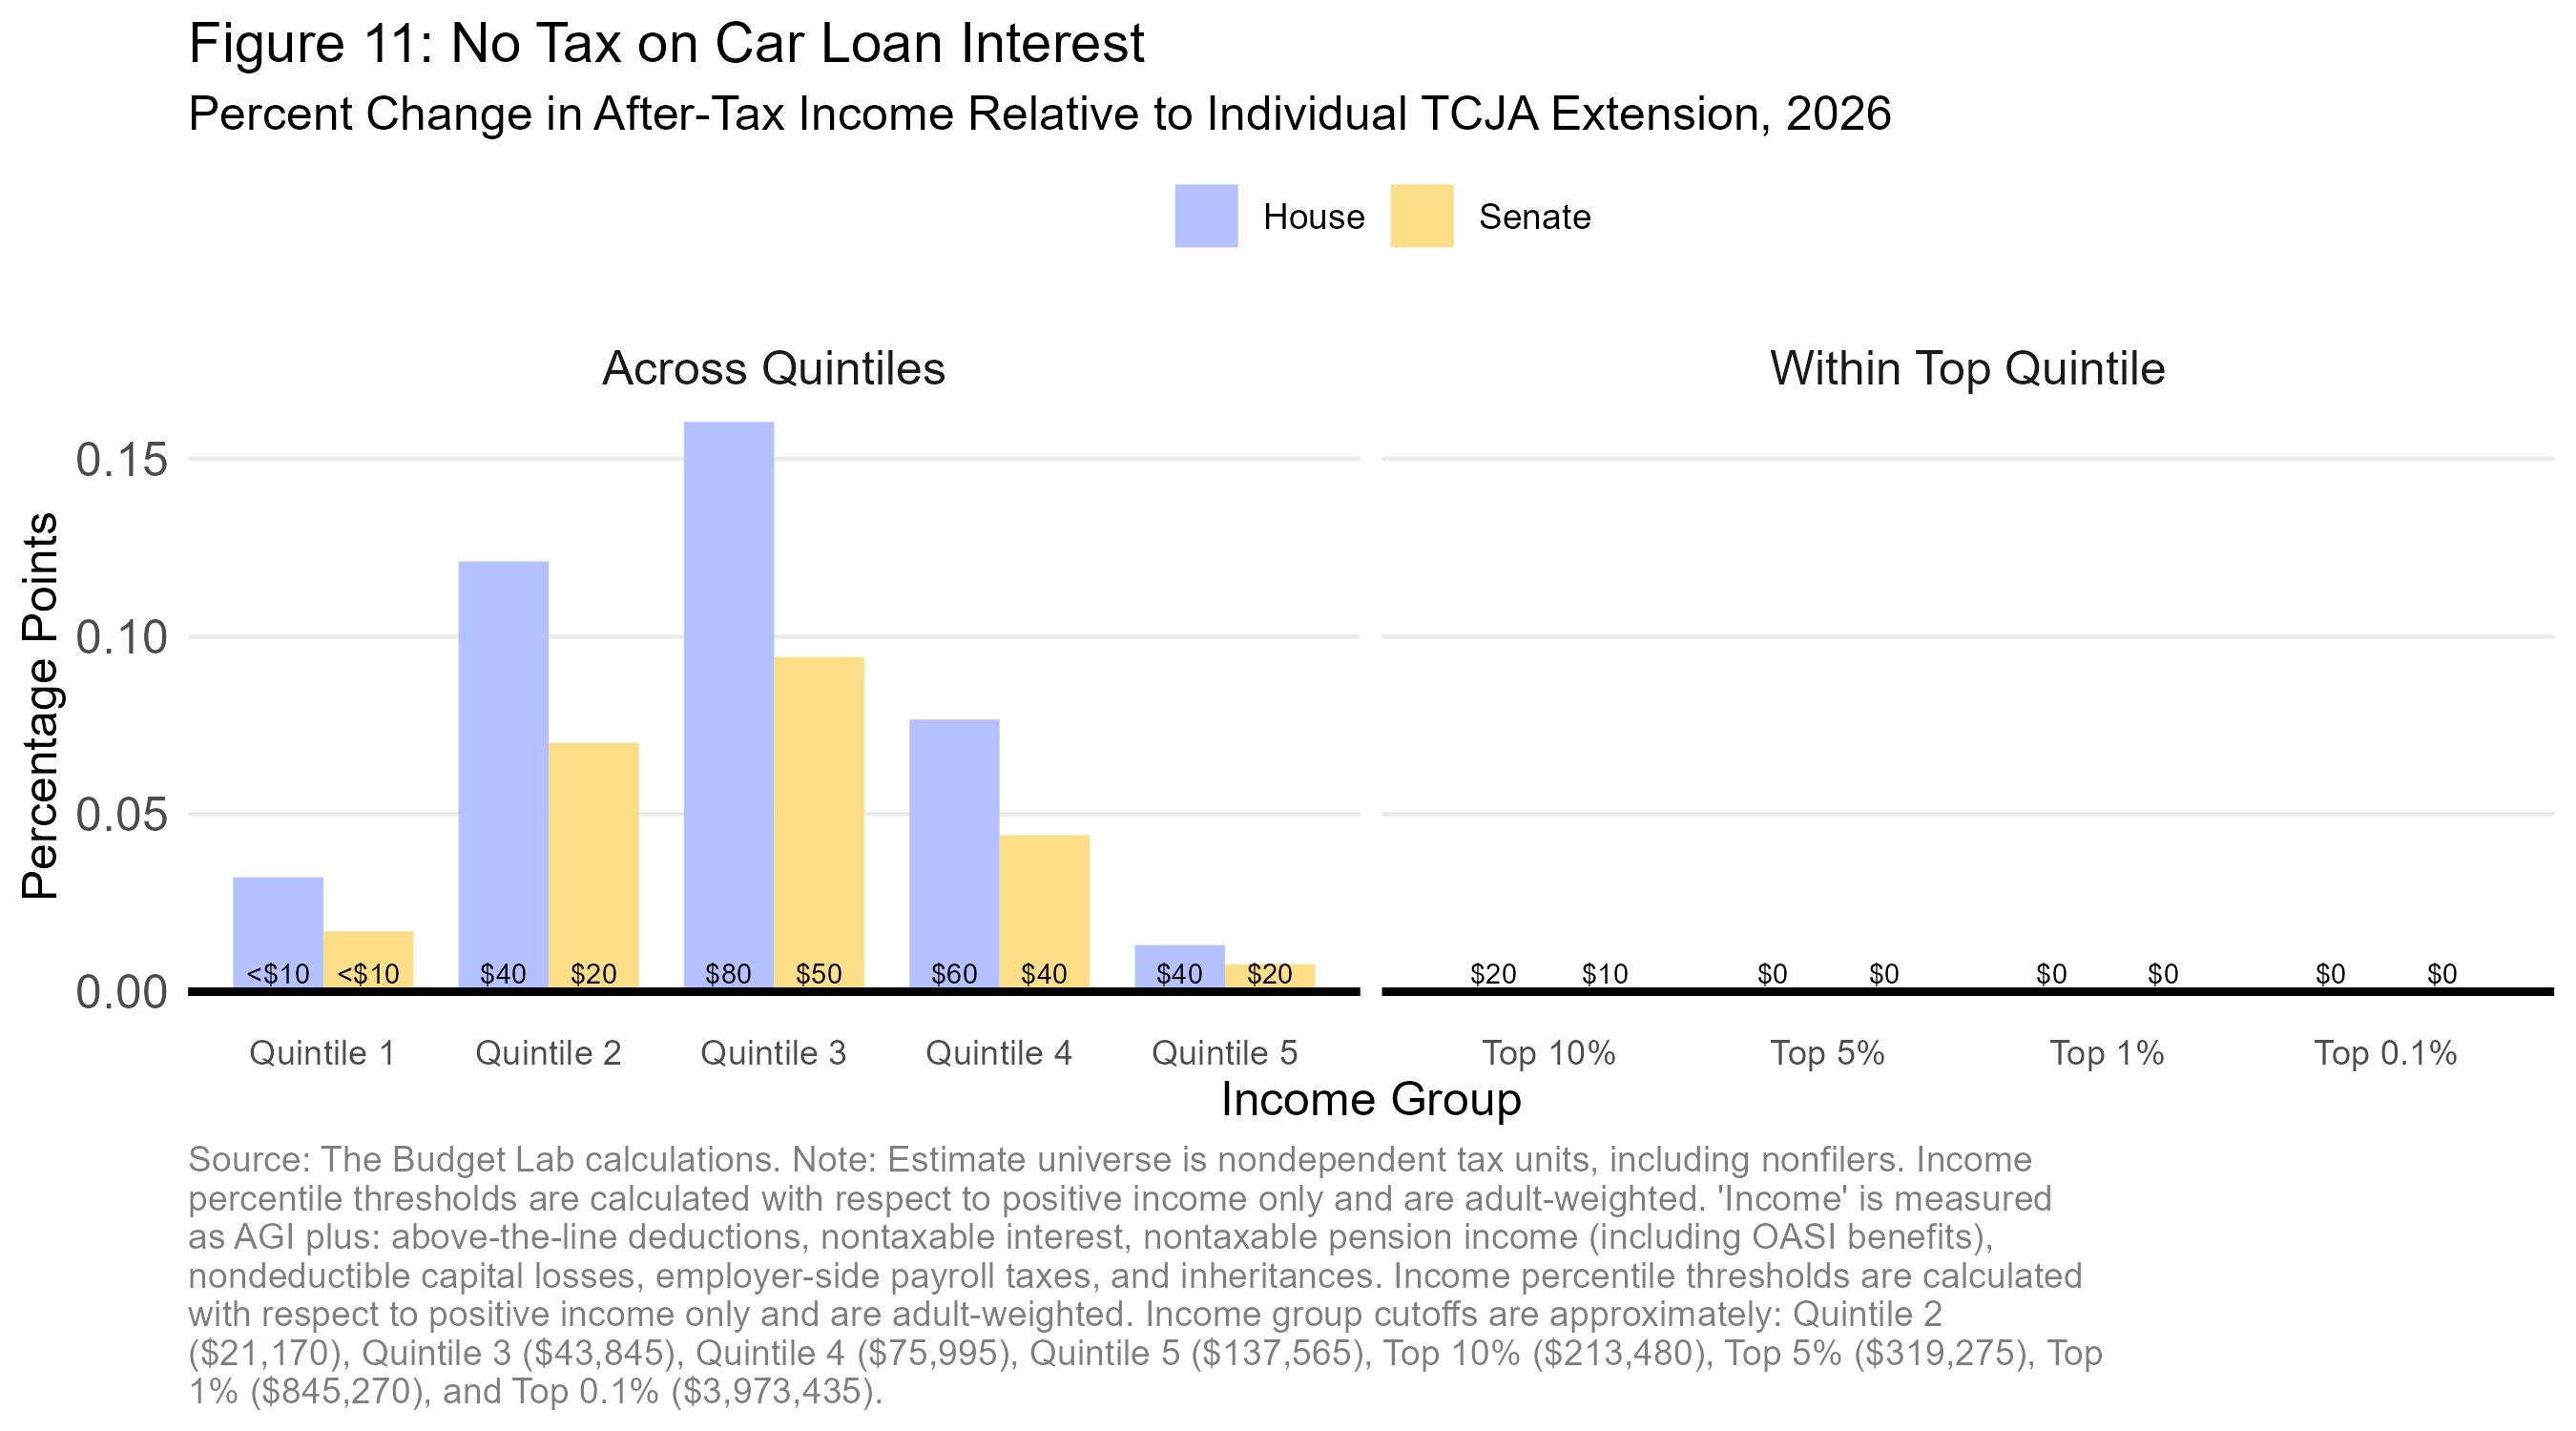
No Tax on Car Loan Interest
Average change in after-tax income, House version: $45
Average change in after-tax income, Senate version: $25

The distributional impact of this provision is hump-shaped, with middle-income households benefiting most in relative terms. These filers tend to meet the following criteria: well-off enough to buy a car, but not well-off enough to buy in cash; well-off enough to have positive taxable income to deduct against, but not well-off enough to be phased out of the deduction.
The Senate version is less generous on average than the House version due to the new car requirement. All else equal, our analysis likely overestimates the progressivity of the Senate version because our preliminary model for this new restriction does not account for differences in propensity to buy new cars (versus used cars) by income group.
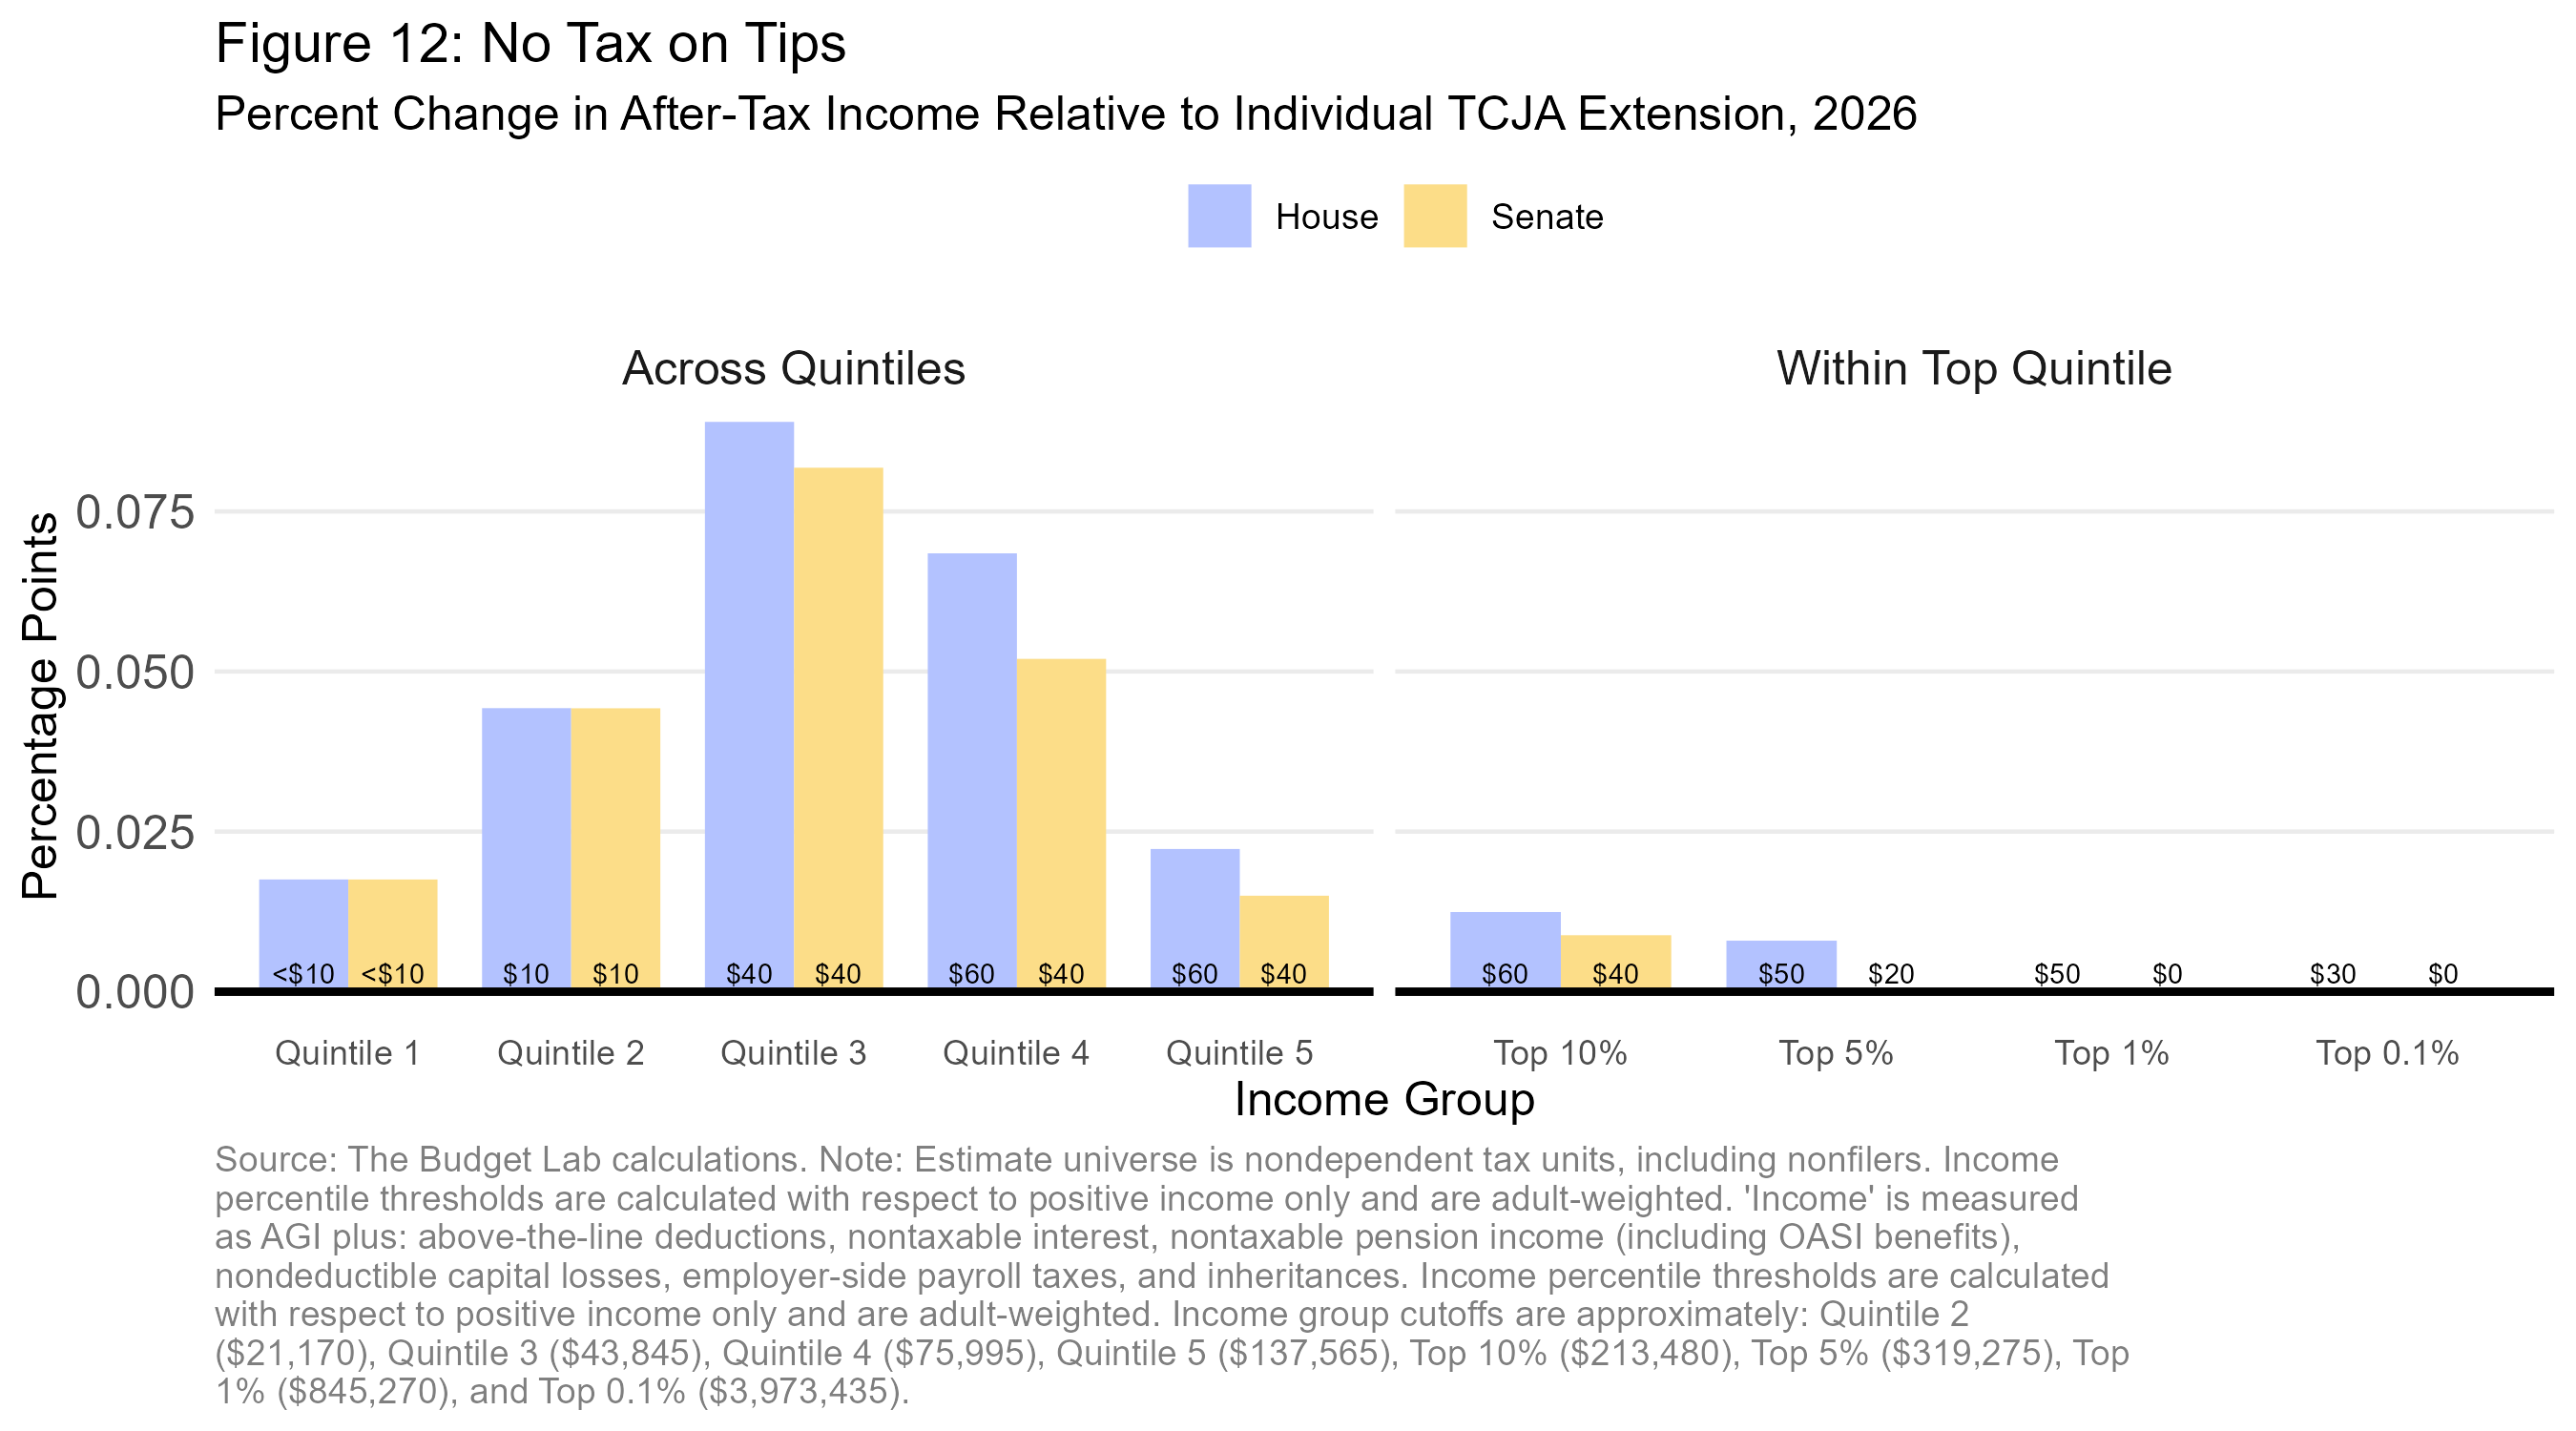
No Tax on Tips
Average change in after-tax income, House version: $35
Average change in after-tax income, Senate version: $30

Tips are disproportionately earned by those in the bottom half of the income distribution. But many of these taxpayers have little to no taxable income, meaning they do not benefit from a new deduction. This dynamic, combined with the income-based restrictions in both bills, gives rise to the hump-shaped distributional impact. The Senate bill would be somewhat less generous because it caps the deduction at $25,000, affecting a small number of workers who report tips in excess of that amount.
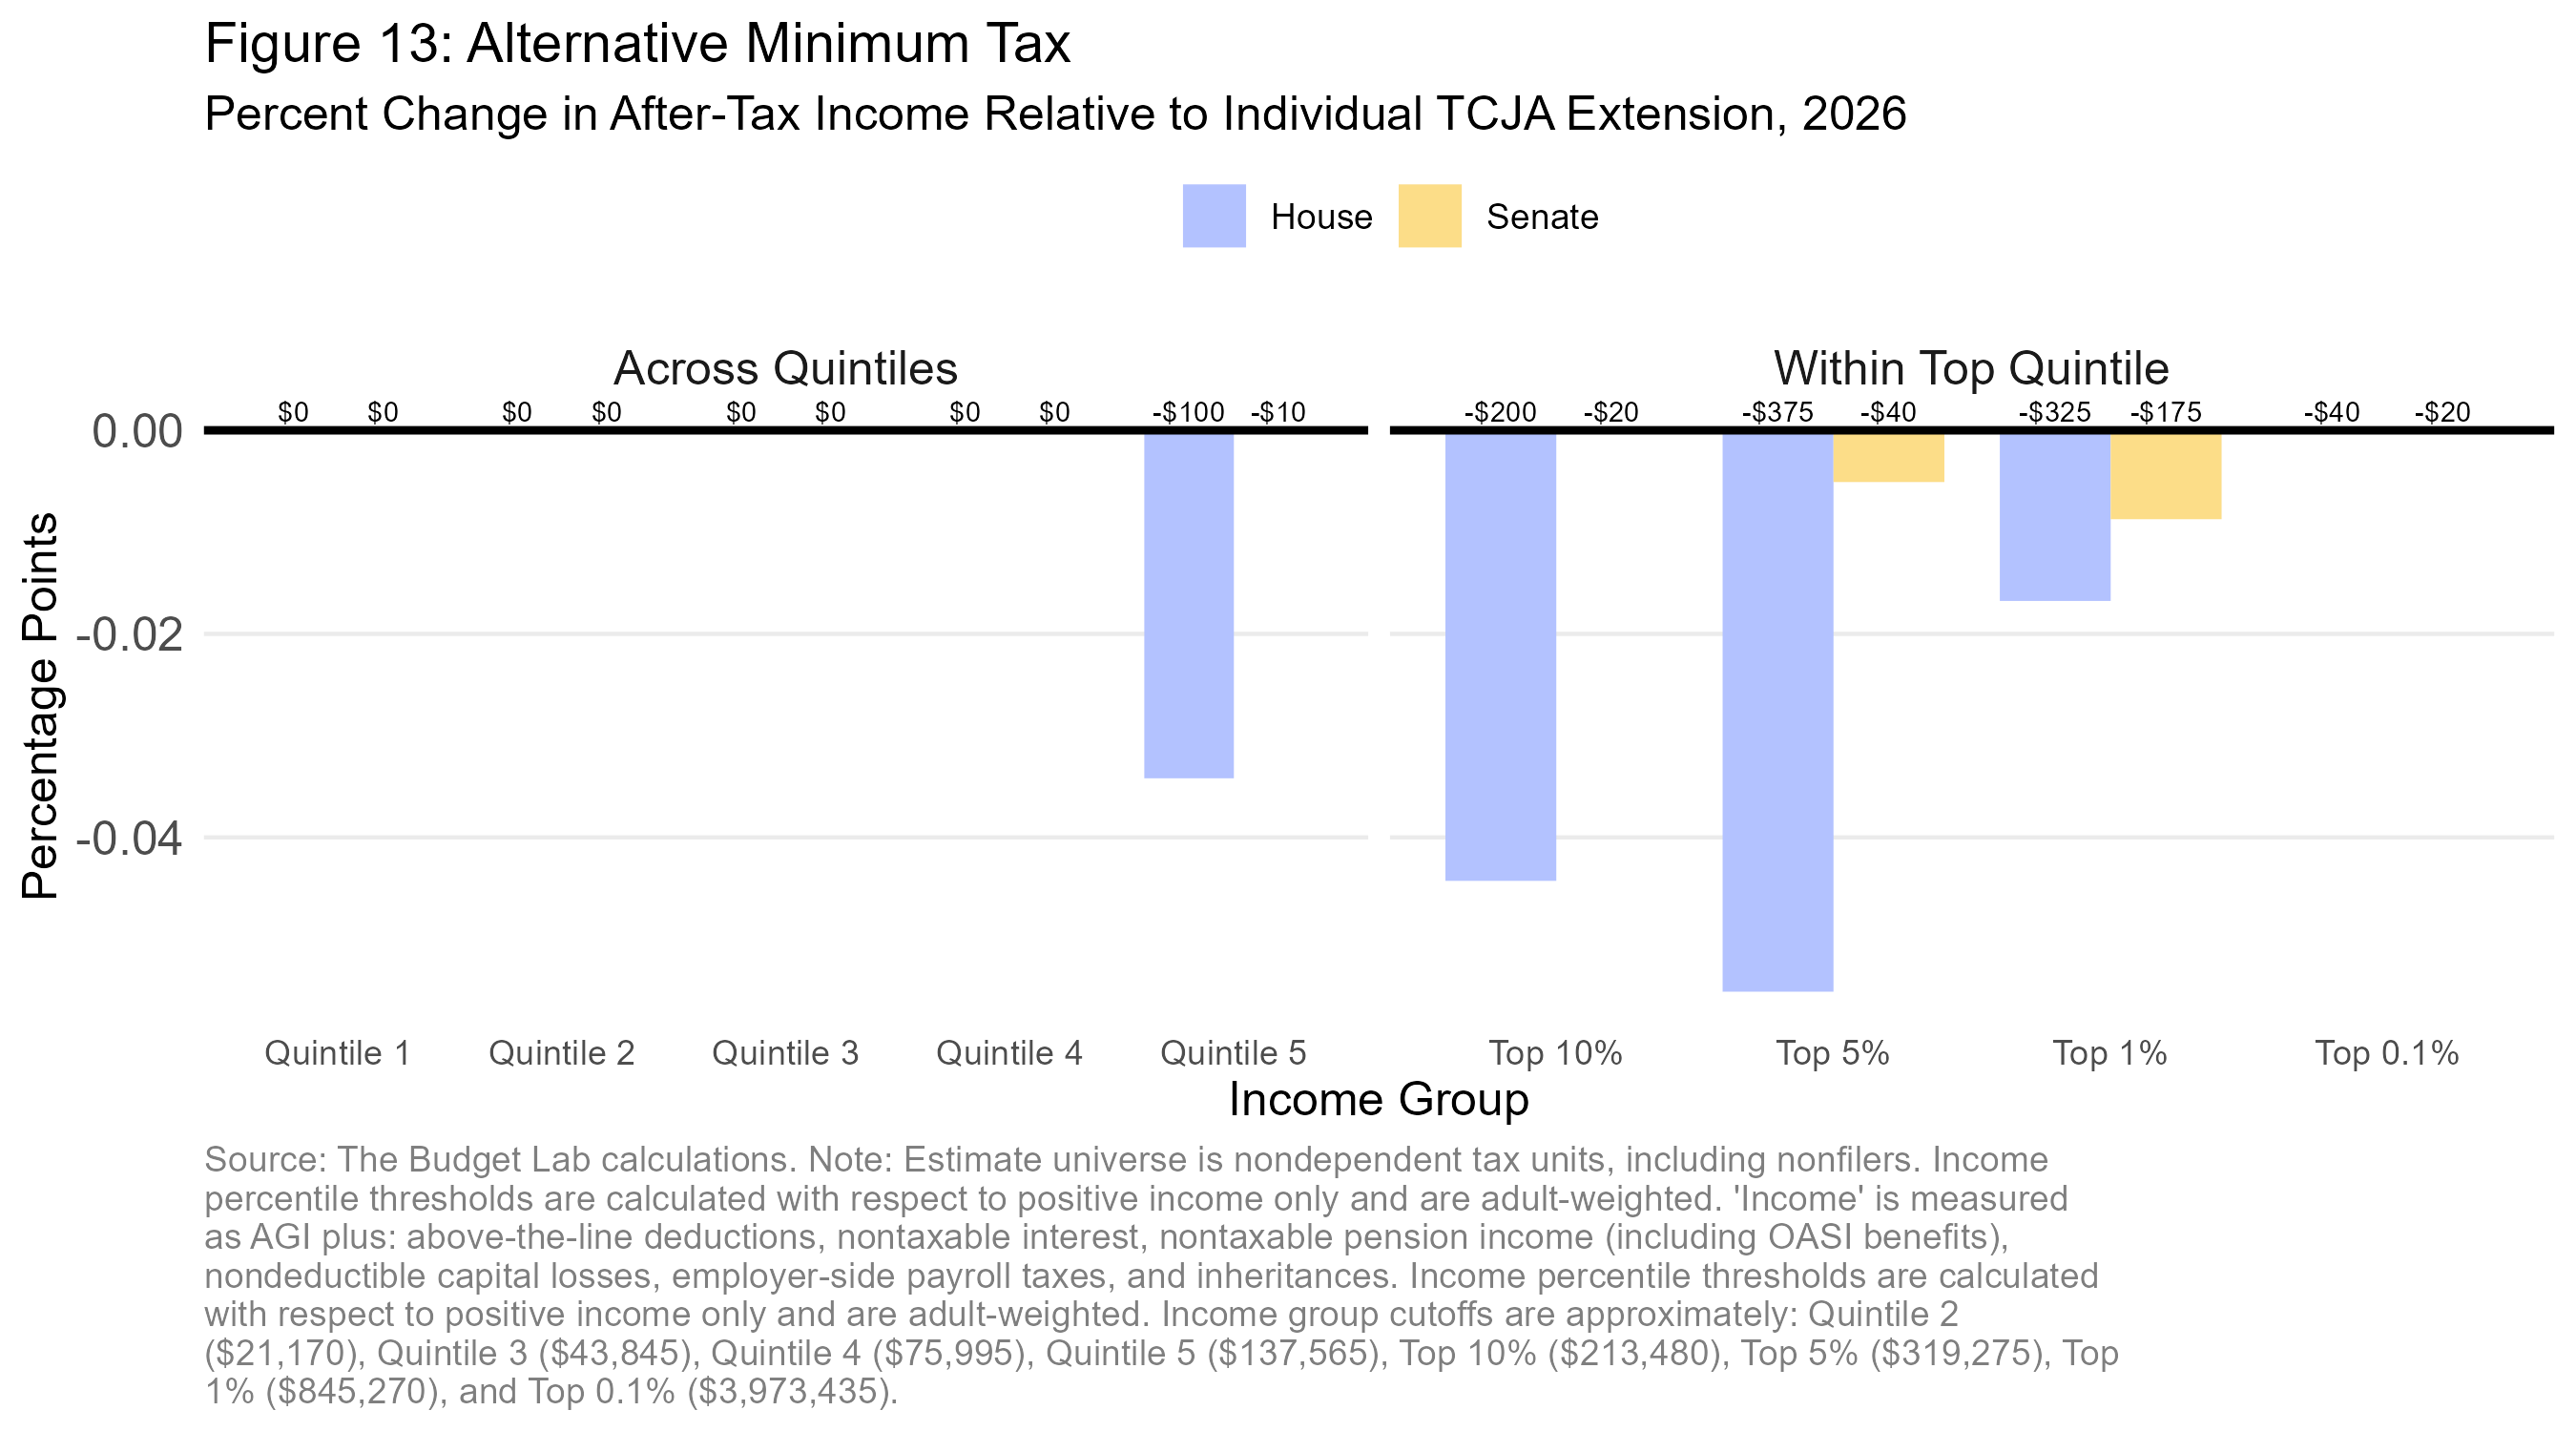
Alternative Minimum Tax
Average change in after-tax income, House version: -$20
Average change in after-tax income, Senate version: <-$5

By increasing the amount of income subject to AMT rates, each version would progressively raise a small amount of revenue. The Senate version, which only lowers the income threshold at which the exemption phases out (and not the exemption itself), represents a much smaller tax increase than that of the House.
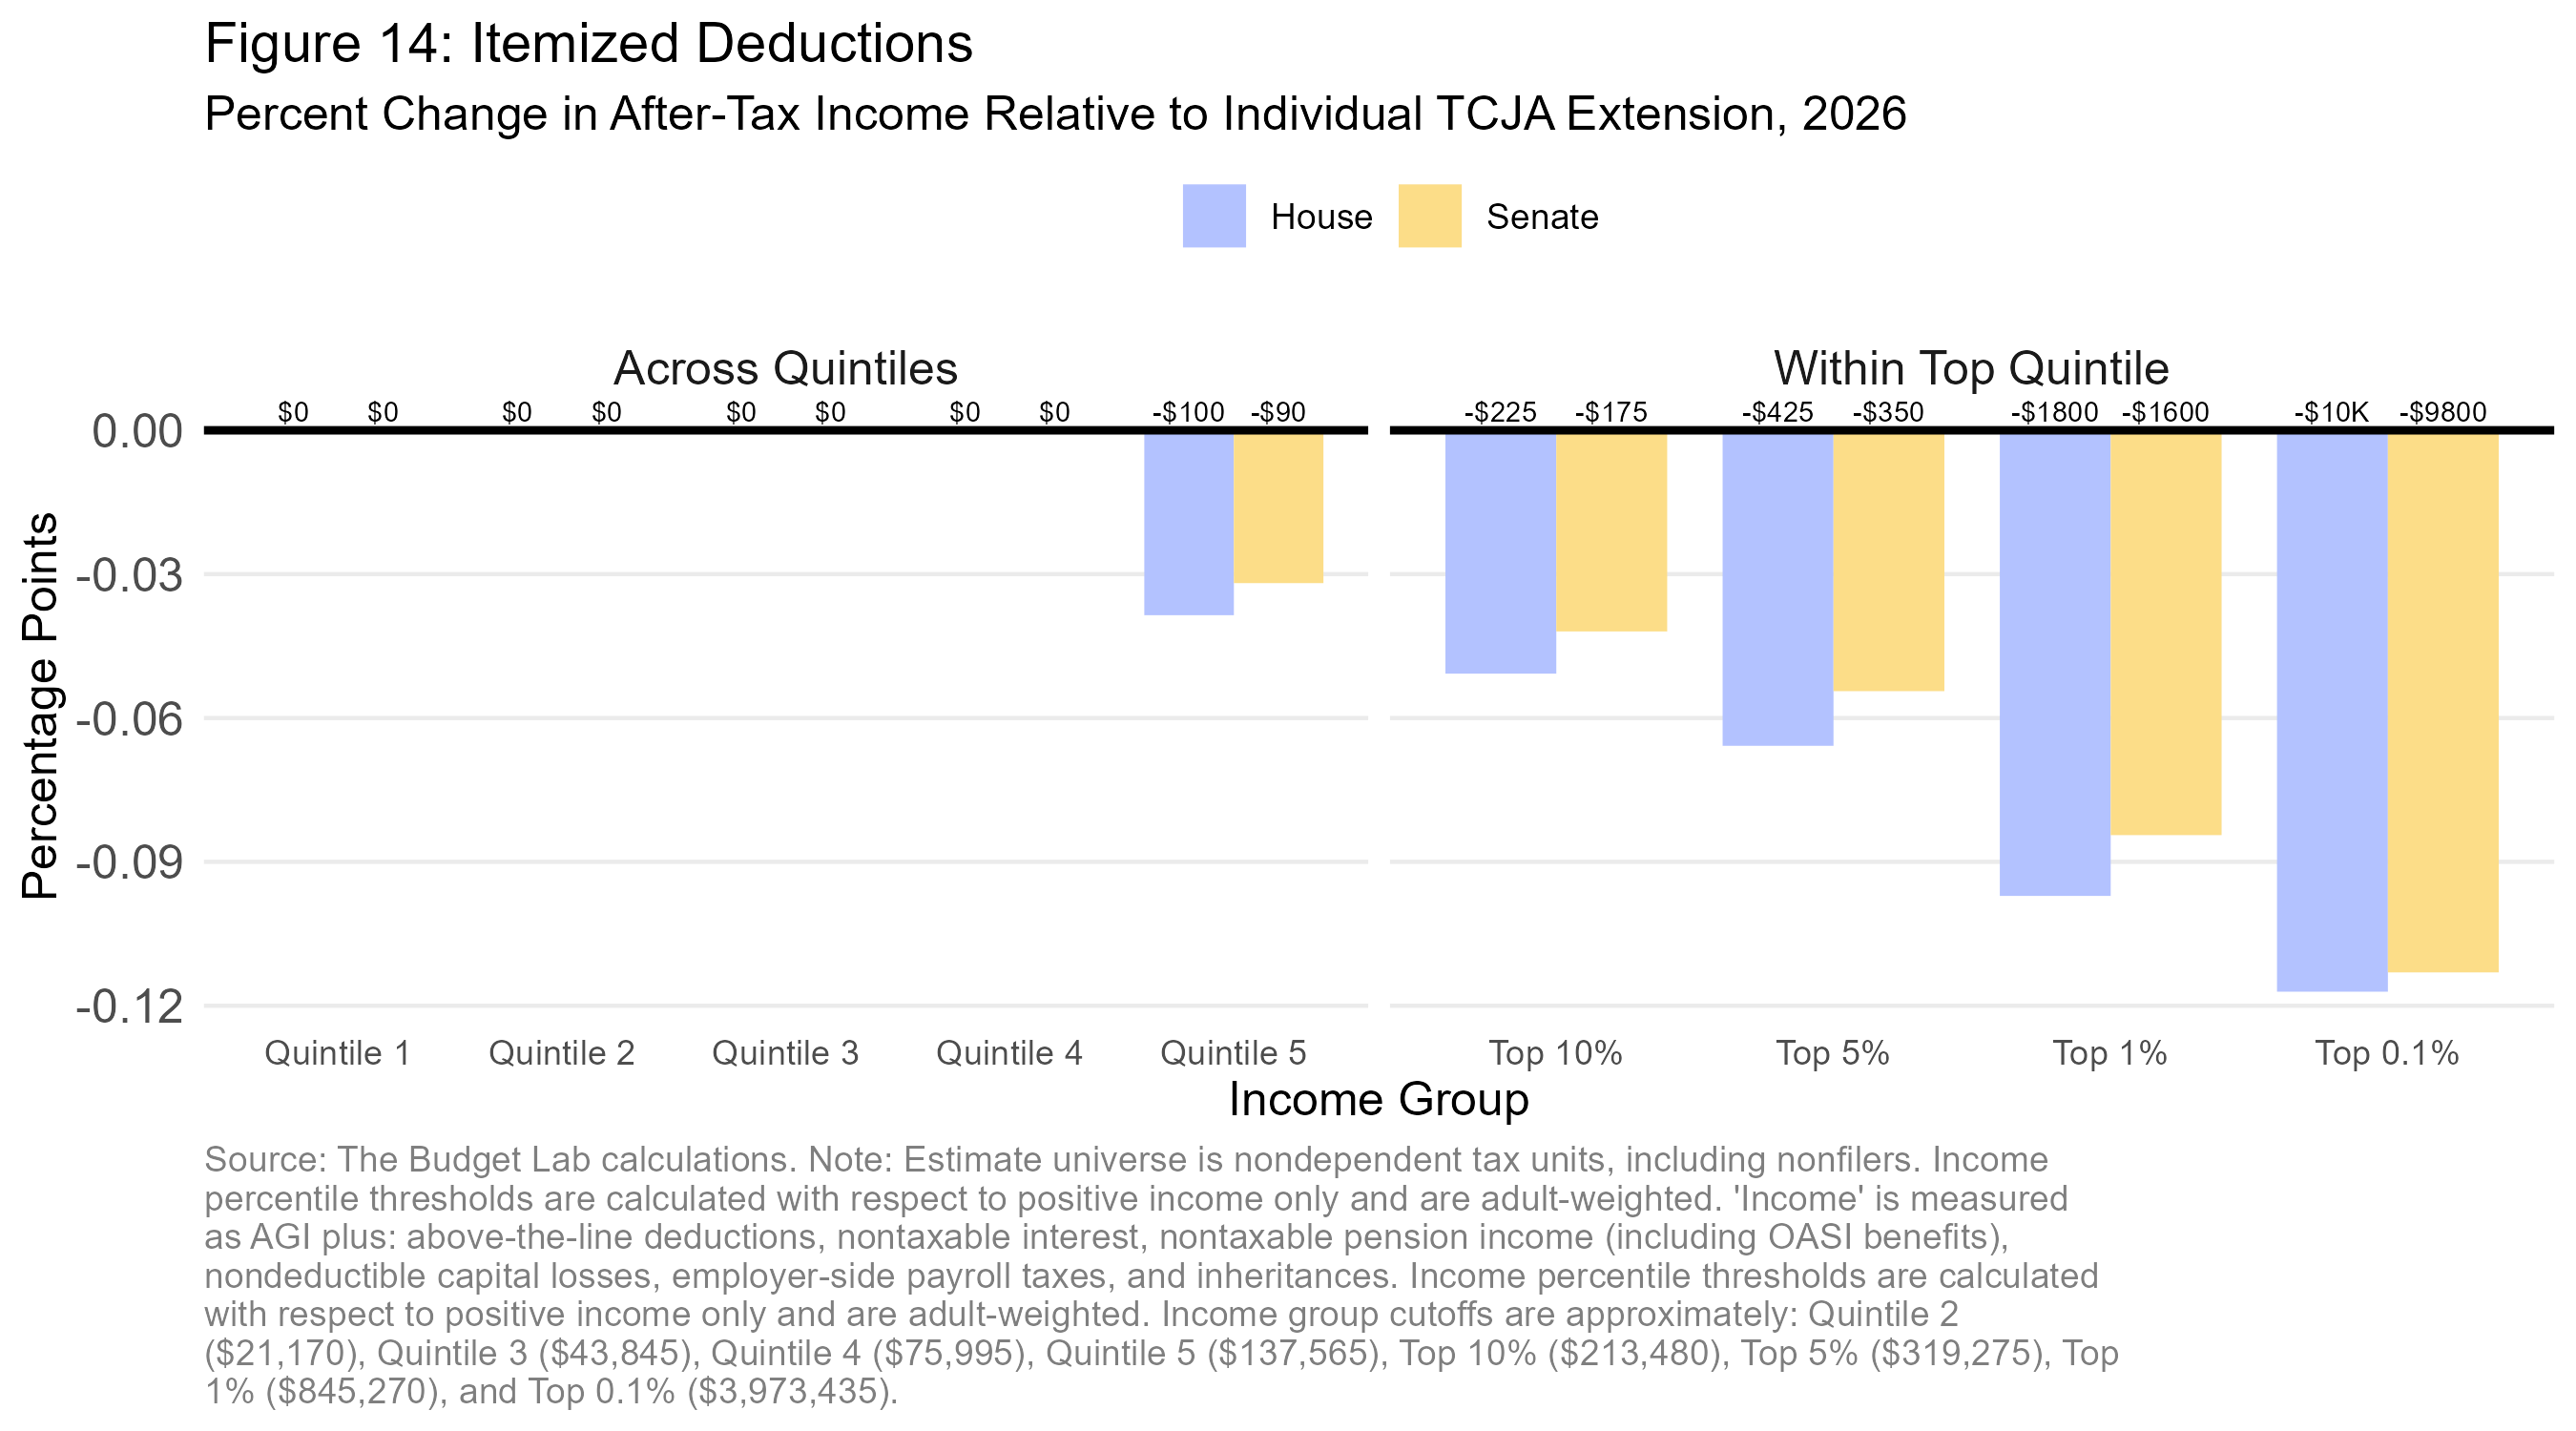
Limit on Itemized Deductions
Average change in after-tax income, House version: -$20
Average change in after-tax income, Senate version: -$20

Because they apply only to those in the top income bracket, these provisions represent a progressive tax increase. The House version generates slightly higher tax increases than the Senate version due to the SALT-specific tax value limitation, though this difference affects households in the 90th-95th percentiles more than those at the very top because the SALT deduction is already limited to a fixed dollar cap.
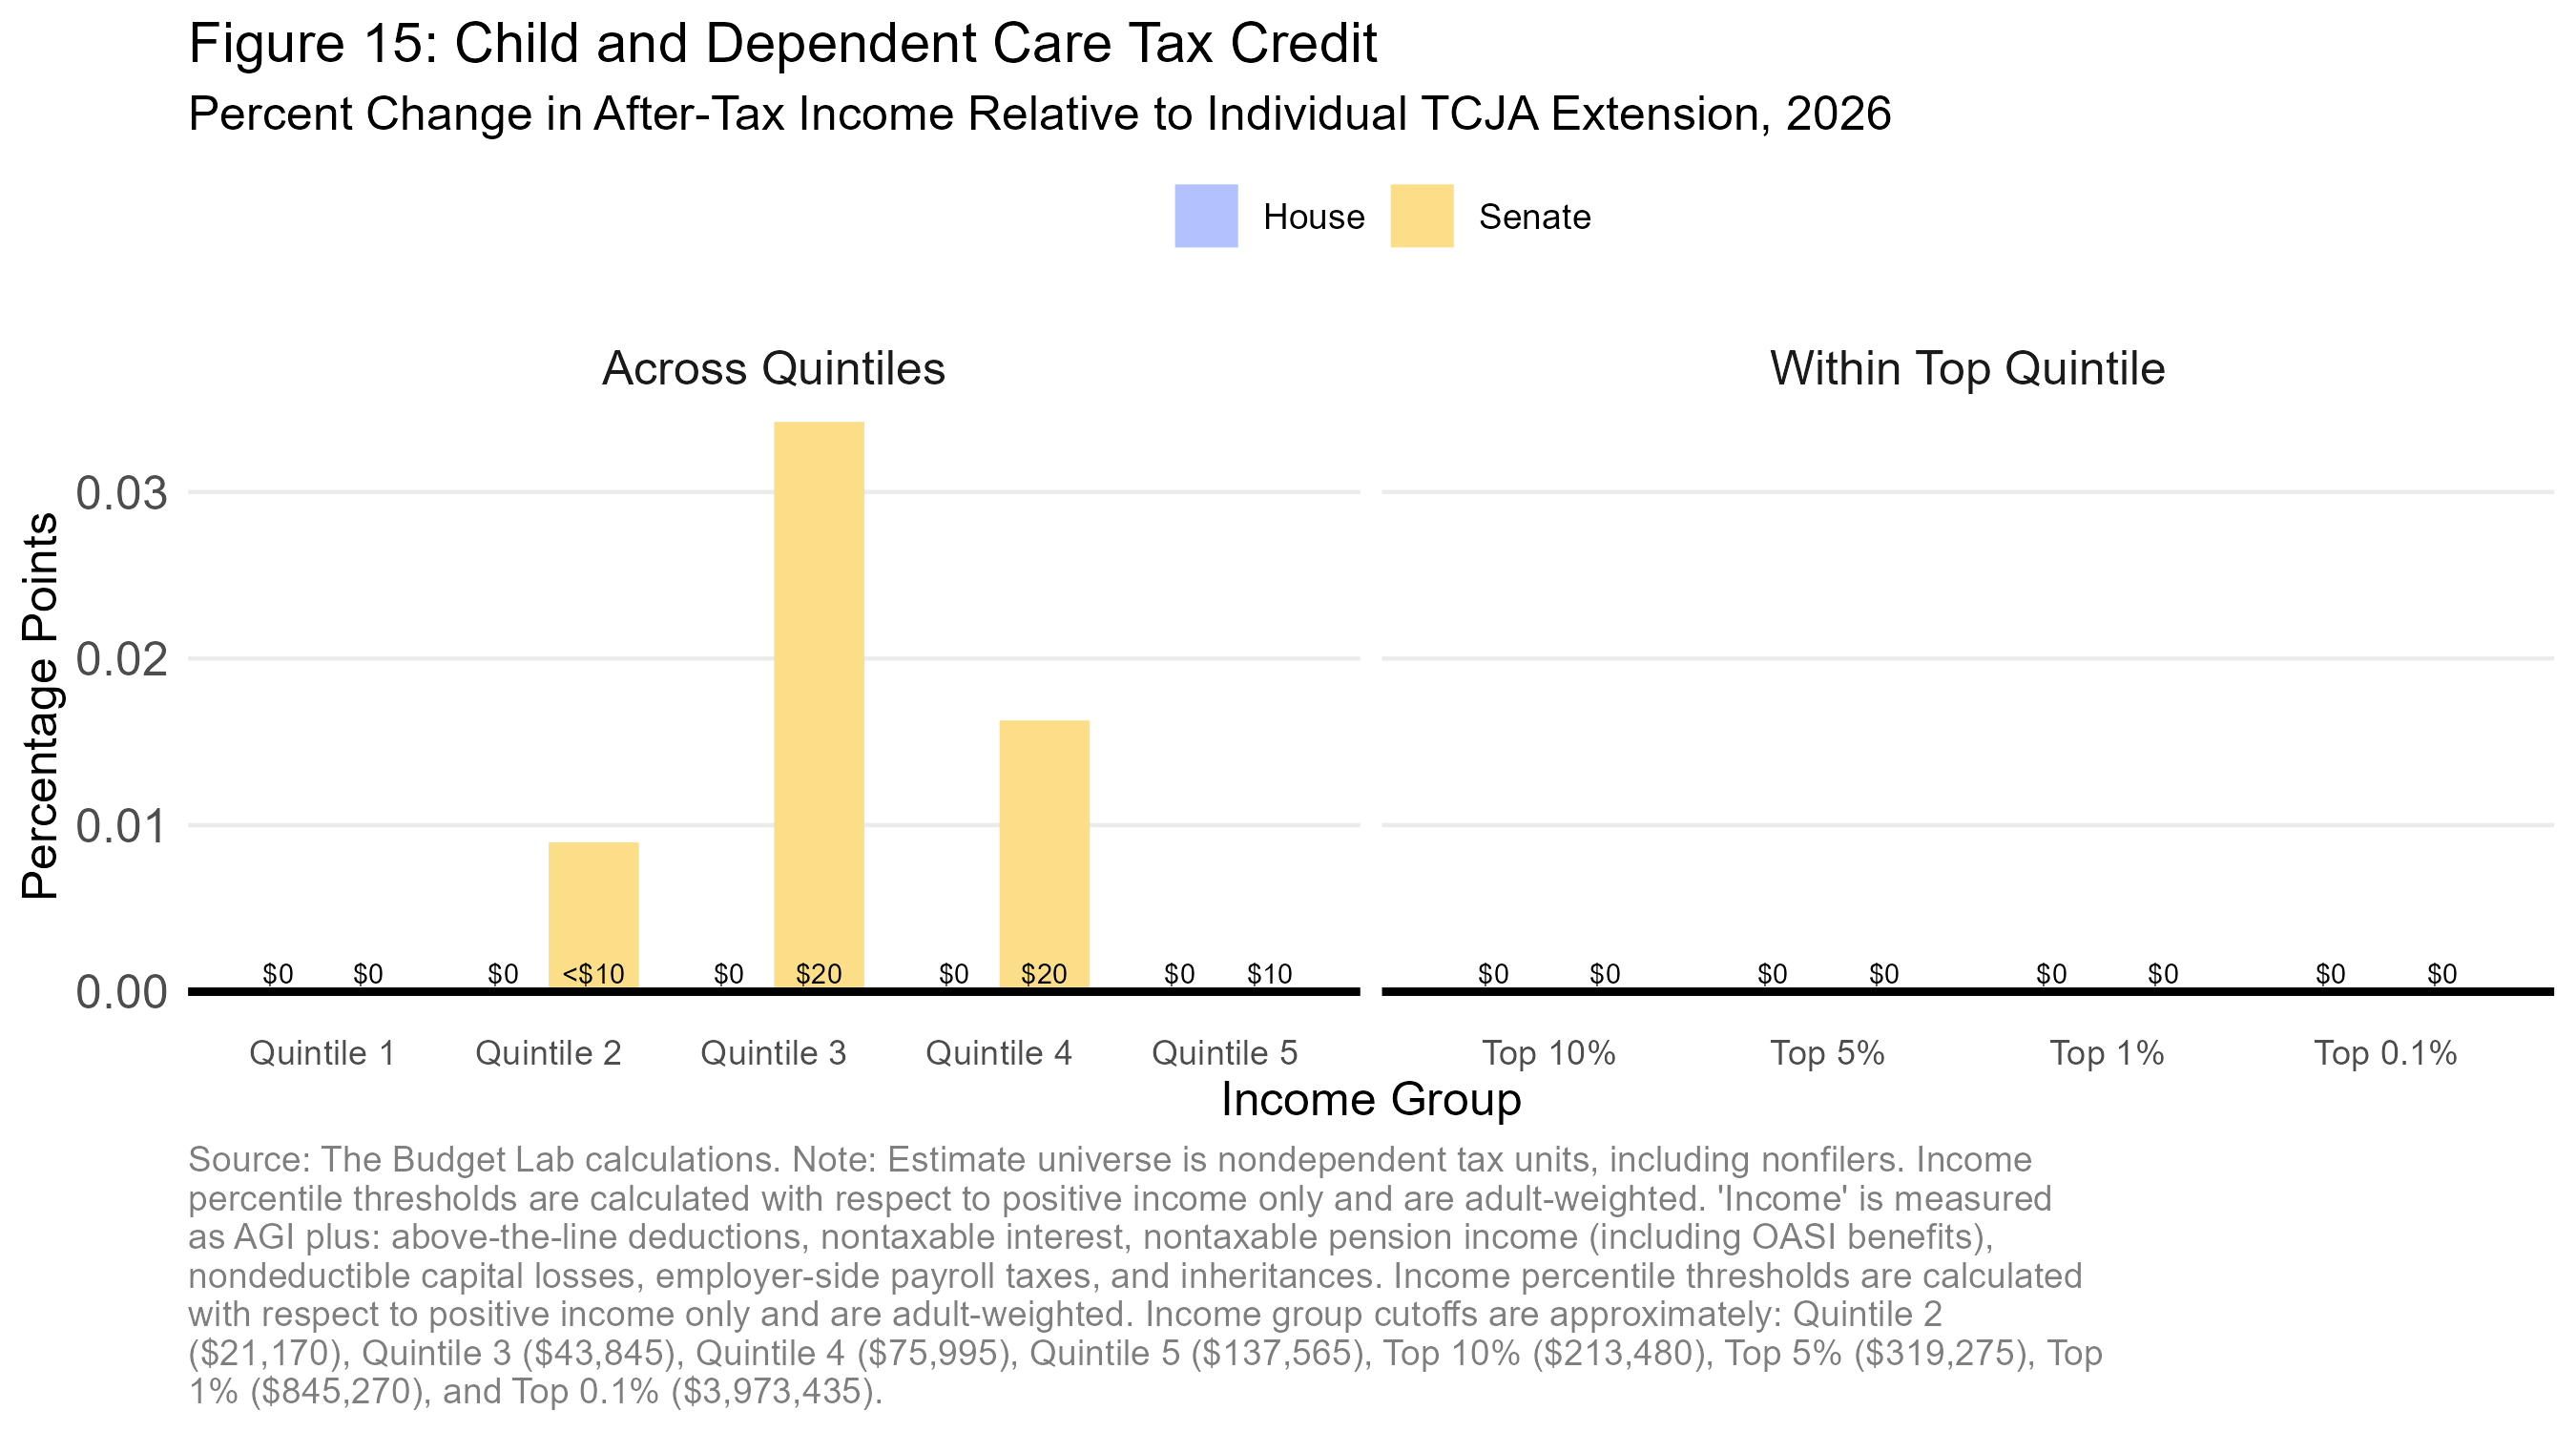
Child and Dependent Care Tax Credit
Average change in after-tax income, House version: N/A
Average change in after-tax income, Senate version: $10

The CDCTC is a relatively small credit under current law, and the Senate’s expansion is modest. Low-income households gain almost nothing from the 50% rate because taxpayers with children who make less than $43,000 have little to no tax liability and thus do not benefit from a nonrefundable credit. Some middle-income taxpayers benefit from the higher credit rate.
Itemized Charitable Deduction Floor
Average change in after-tax income, House version: N/A
Average change in after-tax income, Senate version: -$40

The Senate's charitable contribution floor for itemizers is progressive: high-income households are more likely to itemize, and charitable deductions make up a larger fraction of itemized deductions for those at the very top of the income distribution. For the top 0.1%, the average reduction in after-tax income would be about $12,000.

Footnotes
- Because some provisions are temporary, the distributional effects would be different in future years.
- Interaction effects are generally small for the provisions considered here.
- One alternative approach is to distribute the annual aggregate revenue change induced by a change in cost recovery rules. But these policies create unintuitive annual fluctuations in revenues, so this approach would either overstate or understate the tax burden depending on the year and whether the policy is temporary or permanent.
- Relative to a corporate tax rate cut, a smaller fraction of the aggregate tax benefit from making cost recovery rules more generous accrues to owners of capital. This is because cost recovery rules only affect investments that have yet to be made (“new capital”), whereas a corporate tax cut lowers the tax burden on returns from existing capital (“old capital”) and above-market returns (“rents”) that are insensitive to the cost of capital. The assumed allocation of incidence between capital and labor reflects this dynamic (50-50 for depreciation changes and 80-20 for rate changes).